Rolling mills are precision machines operating under extreme forces, processing millions of tons of steel annually. A single unplanned stoppage can halt production for hours or days, costing manufacturers $20,000+ per minute in lost output. Yet most rolling mill downtime is preventable. Research shows that facilities implementing systematic maintenance optimization reduce unplanned stops by 60% while extending equipment lifespan by 30-50%. The difference between reactive firefighting and proactive maintenance excellence comes down to one thing: having the right system in place.
Modern rolling mill maintenance programs combine predictive analytics, condition monitoring, and systematic planning to prevent failures before they occur. When bearing failures, gearbox misalignment, and roll wear can be detected weeks in advance, maintenance teams shift from emergency repairs to scheduled interventions during planned downtime. This transformation isn't theoretical—leading steel manufacturers are achieving 85%+ equipment availability through intelligent maintenance optimization, turning their rolling mills into reliable profit centers rather than unpredictable cost drains.
The Real Cost of Rolling Mill Downtime
Every minute of unplanned downtime creates a cascade of costs beyond the obvious production loss. Understanding the true financial impact drives the business case for maintenance optimization.
Direct Costs
Indirect Costs
Top 5 Causes of Rolling Mill Failures
Understanding failure patterns is the first step toward prevention. These five failure modes account for over 80% of unplanned rolling mill stoppages.
Bearing Failures
Rolling mill bearings operate under extreme radial and axial loads. Fatigue spalling, contamination, and misalignment cause 29% of unplanned stops.
- Increased vibration amplitude
- Temperature rise of 10-15°C
- Metallic noise during operation
- Excessive backlash or play
Gearbox Misalignment
Misalignment causes 50-70% of machinery vibration problems. Foundation settling and thermal expansion create alignment drift over time.
- Increased gear mesh vibration
- Uneven tooth wear patterns
- Oil temperature elevation
- Unusual operating noise
Lubrication Failures
Inadequate or contaminated lubrication accelerates wear by 500x. Water ingress of just 1% can reduce bearing life by 90%.
- Elevated bearing temperatures
- Discolored or contaminated oil
- Increased particle count in analysis
- Low oil level or pressure
Roll Wear & Damage
Roll surface deterioration from abrasion, thermal shock, and spalling requires frequent replacement and affects product quality.
- Product dimensional variation
- Surface defects on strip
- Increased rolling force required
- Visible roll surface damage
Cobbles & Jams
Material jams and cobbles cause immediate stoppages and potential equipment damage. Often result from process upsets or guide failures.
- Guide alignment drift
- Inconsistent strip tension
- Speed ratio mismatches
- Temperature excursions
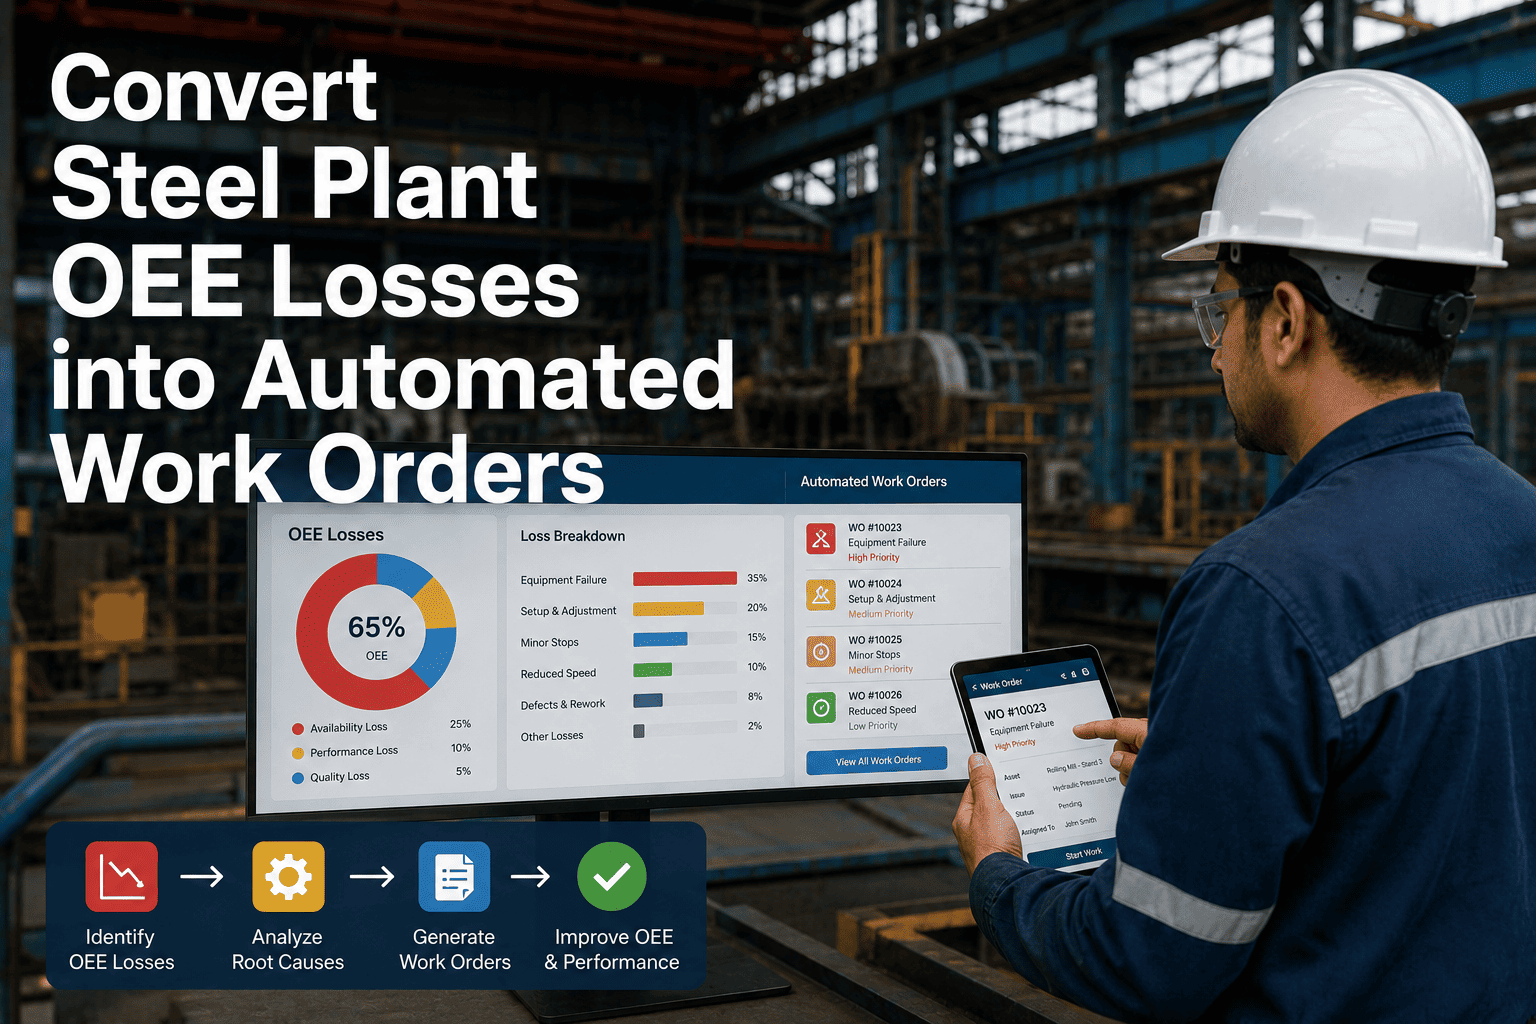
Ready to Reduce Unplanned Stops by 60%?
Implement predictive maintenance with real-time monitoring, automated work orders, and failure prevention analytics.
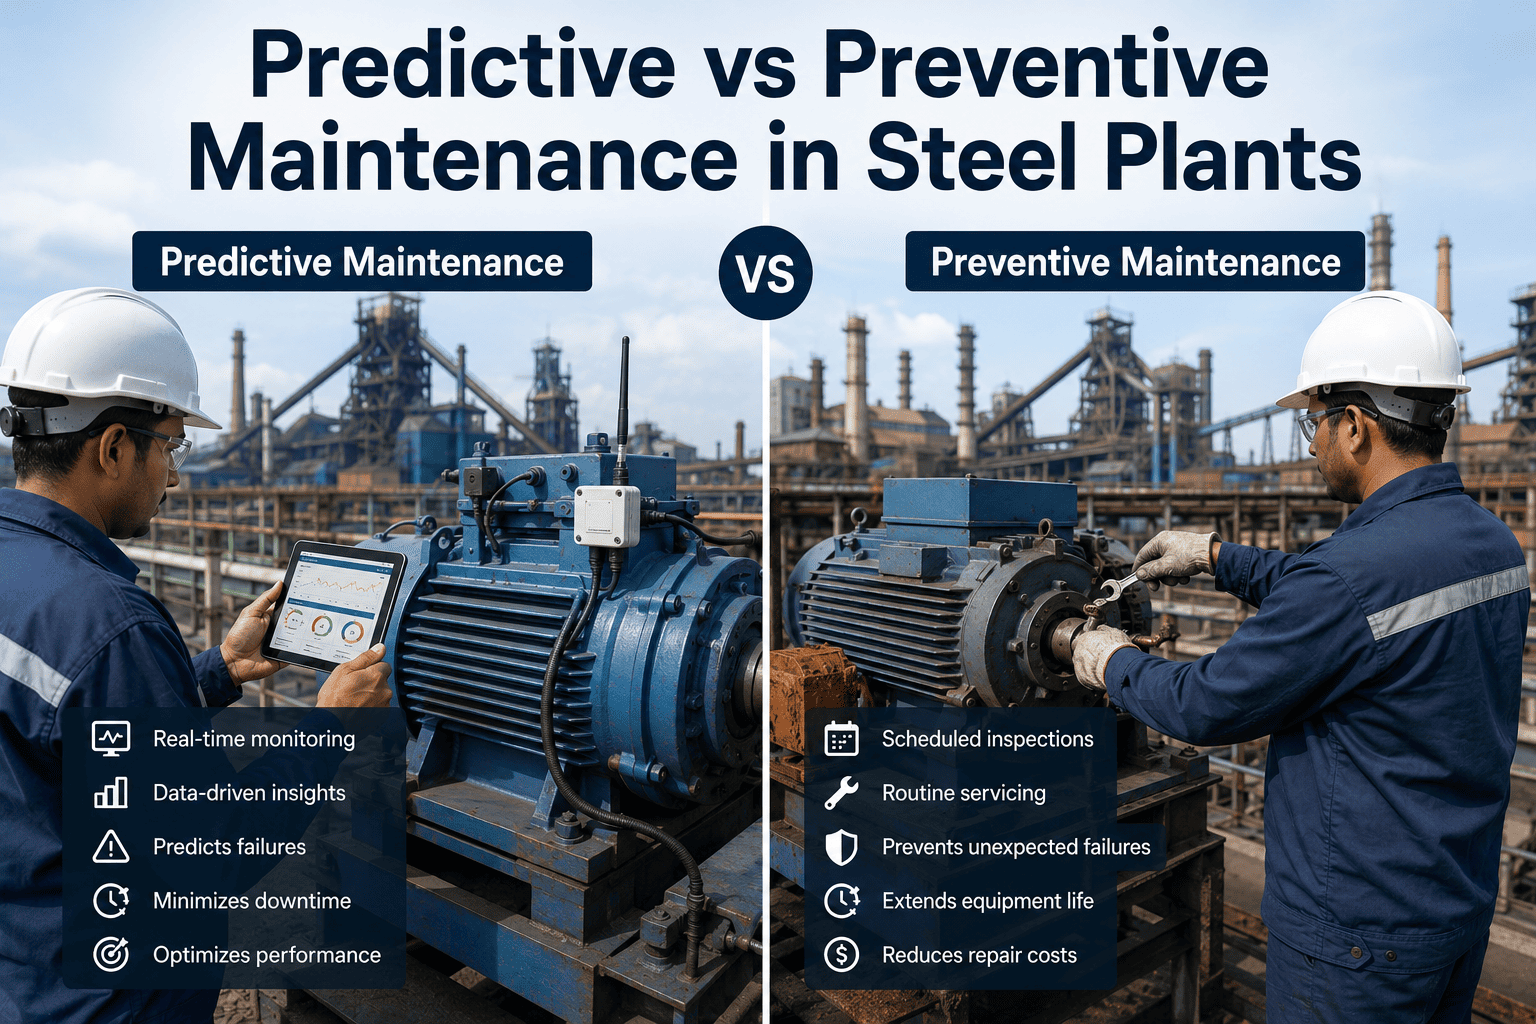
Predictive Maintenance Technologies
Modern sensor technologies and analytics detect developing problems weeks before failure, enabling planned interventions during scheduled maintenance windows.
Vibration Monitoring
Tri-axial accelerometers detect bearing defects, misalignment, and imbalance before audible symptoms appear. Early detection provides 2-4 week lead time.
Thermal Imaging
IR cameras identify hot spots from friction, misalignment, or electrical faults. Fixed installations provide continuous monitoring of critical components.
Oil Analysis
Spectrographic analysis detects wear metals, contamination, and lubricant degradation. Trending data reveals developing problems months in advance.
Laser Alignment
Precision measurement systems verify gearbox and coupling alignment to within 0.001". Corrects the #1 cause of vibration and premature bearing failure.
AI Analytics
Machine learning algorithms analyze sensor data patterns to predict failures 4-8 weeks before occurrence. Optimizes maintenance scheduling and parts inventory.
Motor Current Analysis
Monitors electrical signatures to detect mechanical faults, broken rotor bars, and electrical issues. Non-invasive monitoring requires no equipment modification.
The 4-Pillar Optimization Framework
Successful rolling mill maintenance combines four integrated strategies that work together to minimize unplanned downtime and maximize equipment reliability.
Condition Monitoring
Deploy sensors and monitoring systems that provide real-time visibility into equipment health across all critical components.
- Continuous vibration and temperature tracking
- Oil condition and contamination monitoring
- Alignment and position verification
- Performance parameter trending
- Automated alert generation
Predictive Analytics
Use AI and machine learning to analyze sensor data, identify patterns, and forecast when components will require maintenance.
- Failure mode pattern recognition
- Remaining useful life calculation
- Optimal maintenance timing prediction
- Parts inventory optimization
- Cost-benefit analysis automation
Planned Interventions
Schedule maintenance activities during planned production downtime to minimize impact on output and throughput.
- Coordinate with production schedules
- Prepare parts and tools in advance
- Stage maintenance during low-demand periods
- Use rolling updates to maintain partial operation
- Implement redundant systems where critical
Continuous Improvement
Document all maintenance activities, analyze failure patterns, and refine processes based on actual performance data.
- Root cause analysis for all failures
- Maintenance KPI tracking and trending
- Benchmarking against industry standards
- Team training and skill development
- Process refinement based on learnings
Implementation Roadmap
Phase 1: Assessment & Planning
- Conduct equipment criticality analysis
- Baseline current failure rates and costs
- Identify sensor installation points
- Define KPIs and improvement targets
- Develop implementation budget and timeline
Phase 2: Sensor Deployment
- Install vibration sensors on critical bearings
- Deploy thermal imaging cameras
- Implement oil analysis program
- Configure data collection systems
- Train maintenance team on new tools
Phase 3: Analytics Integration
- Establish baseline equipment signatures
- Configure AI/ML prediction models
- Set up automated alerting rules
- Integrate with CMMS work order system
- Begin predictive maintenance scheduling
Phase 4: Optimization & Scaling
- Refine prediction algorithms based on results
- Expand monitoring to additional equipment
- Document ROI and cost savings
- Establish continuous improvement process
- Scale successful practices across facility
Midwest Steel: 60% Downtime Reduction in 11 Months
Deployed 150+ sensors across rolling mills, gearboxes, and critical bearings. AI analytics provided 4-6 week early warning on developing failures, enabling scheduled interventions during planned production windows.
Traditional vs. Optimized Maintenance
Transform Your Rolling Mill Maintenance
Join leading manufacturers achieving 60% downtime reduction and $850K+ annual savings through predictive maintenance optimization.