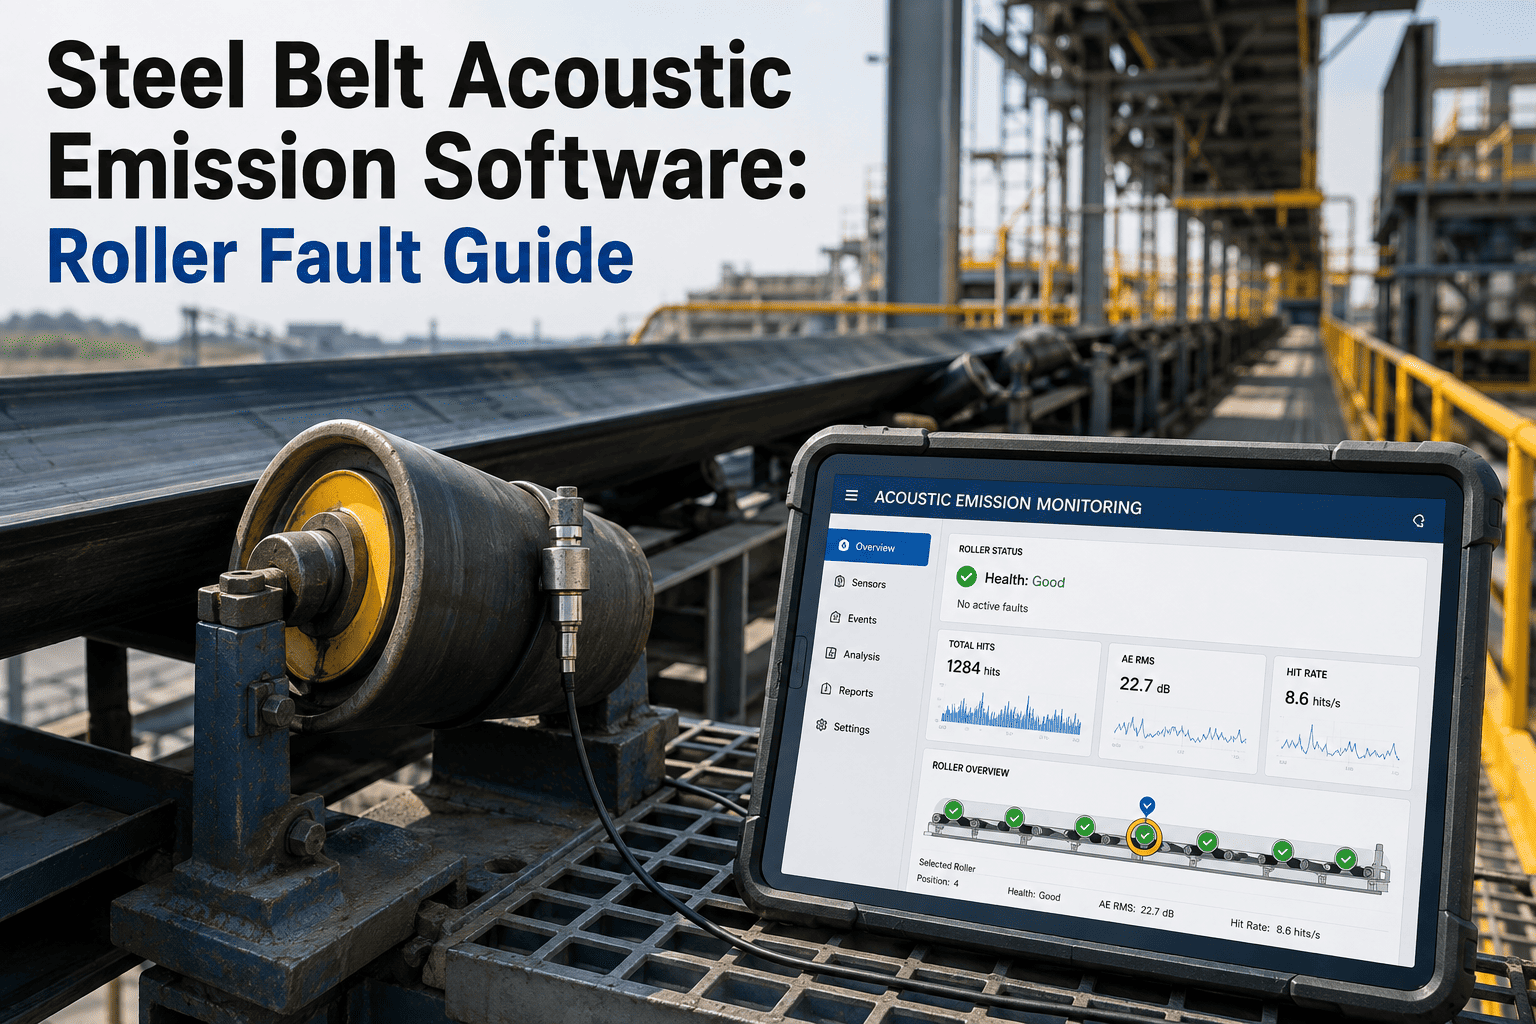
Steel plants running kilometers of belt conveyors depend on thousands of idler rollers to keep sinter, coke, and iron ore moving between yards, blast furnaces, and finishing lines. Each roller carries a sealed bearing that spins thousands of times a shift, and early-stage bearing damage — spalling, fretting, or lubricant breakdown — produces a distinct acoustic signature long before vibration sensors or thermal cameras notice anything wrong. Most mills still rely on a technician walking the gallery once a week, listening for a grinding or squealing roller among hundreds that sound identical, which means a bearing that started failing on Monday might not get flagged until it seizes and tears the belt on Friday. Acoustic emission sensors paired with a steel plant CMMS change that timeline: continuous listening posts pick up the high-frequency stress waves a damaged bearing releases, match them against known fault frequencies for that roller's bearing model and running speed, and route a work order before the roller ever locks up. The result is fewer belt rips, less unplanned conveyor downtime, and a maintenance crew that inspects on evidence instead of guesswork — see how the acoustic emission monitoring workflow inside Oxmaint is built for exactly this kind of high-idler-count environment.
ACOUSTIC EMISSION MONITORING · OXMAINT PLATFORM
Catch Roller Bearing Faults Before the Belt Tears
Continuous acoustic listening across every idler zone. Fault-frequency matching flags the exact roller and bearing condition. Work orders route straight into your steel plant CMMS, so nothing waits for the next walk-by inspection.
Why Idler Roller Faults Go Unnoticed on Steel Plant Conveyor Lines
A single steel plant conveyor route can carry 800 to 3,000 idler rollers spread across yard belts, charging conveyors, and product transfer lines. Each roller runs at low rotational speed — typically 60 to 120 RPM — which is exactly the range where traditional vibration monitoring struggles, because low-speed bearing defects generate weak, slow-building vibration energy that is easy to miss between scheduled readings. Add constant exposure to iron ore dust, coke fines, moisture, and radiant heat from nearby process equipment, and bearing grease breaks down faster than in almost any other plant asset class. Idler failure research consistently splits roller bearing damage into three stages: incipient failure, where rolling elements begin pitting or fretting while the roller still turns quietly; final failure, marked by audible grinding, excess runout, or a roller that starts dragging; and catastrophic failure, where the bearing seizes, the roller stops turning, and belt friction against a stationary shell can gouge the belt cover or, in the worst cases, ignite dust buildup. Because idlers are cheap, numerous, and physically scattered, most mills cannot justify wiring individual vibration transducers to every roller, so they fall back on walk-by listening checks that depend on a technician's ear, the ambient noise of the gallery, and how recently that specific roller was inspected.
The practical result shows up in two failure patterns that repeat across almost every mill running long overland or in-plant conveyors. First, a roller flagged as noisy on a walk-by round often sits on the schedule for days before a technician has time to swap it, because a subjective "sounds a bit off" note rarely gets prioritized against confirmed work orders. Second, and more costly, is the roller nobody hears at all — one buried in a return-side gallery, drowned out by a nearby crusher or screen, or simply skipped because that section of belt was not on this week's route. Acoustic emission sensing removes the subjectivity from both patterns: instead of a technician's judgment call, the platform compares measured energy at a calculated fault frequency against that roller's own healthy baseline, so a genuine defect gets flagged with a confidence score rather than a hunch, and a quiet roller two galleries away gets the same attention as one sitting next to the walkway.
800–3,000
Idler rollers per steel plant conveyor route
60–120
RPM roller speed, the hardest range for vibration-only sensors
3 stages
Incipient, final, and catastrophic bearing failure progression
$50K–$200K
Cost of a single belt replacement after a seized-roller rip
How Acoustic Emission Sensing Reads a Roller's Bearing Condition
Acoustic emission sensors do not simply record loudness — they capture high-frequency stress waves released the instant a rolling element passes over a pit, crack, or spalled patch inside the bearing race. Every bearing model has a set of characteristic fault frequencies determined by its geometry and the roller's rotational speed: ball pass frequency of the outer race, ball pass frequency of the inner race, and fundamental train frequency. A common conveyor idler bearing running at roughly 105–110 RPM, for example, carries a probable fault frequency in the low single-digit Hz range, a signal too faint and too slow for the human ear to separate from ordinary belt noise, but well within reach of a continuously sampled acoustic sensor. Once captured, the raw acoustic stream is broken into short time-frequency windows, spectral features are extracted, and a trained classifier compares the pattern against the expected healthy signature for that exact bearing and speed. When the pattern drifts — a rise in impulsive energy at the calculated fault frequency, a new harmonic, or a broadband noise floor increase — the system flags the specific roller, not just a general gallery zone, and pushes that reading straight into the CMMS as a prioritized inspection task.
Continuous Acoustic Listening Posts
Fixed acoustic emission sensors or periodic drone and walk-by acoustic scans capture sound from banks of idlers simultaneously. Sampling runs continuously or on a tight rotation, replacing the once-a-week manual listening check with a data stream that never skips a shift.
Bearing Fault Frequency Matching
Each idler's bearing model and running speed define its expected fault frequencies. The platform calculates outer race, inner race, and cage fault frequencies per roller and compares live acoustic energy against that specific signature instead of a generic threshold.
Spectral Pattern Classification
Time-frequency features extracted from the acoustic stream feed a trained classifier that separates genuine bearing distress from belt splices, clamps, material spillage, or ambient plant noise, which keeps false alarms low across noisy production floors.
CMMS Work Order Routing
A confirmed anomaly creates a work order tied to the exact roller ID, gallery location, and bearing history inside your steel plant CMMS. Maintenance planners see a prioritized queue instead of a raw sensor feed, and technicians walk in knowing what to check.
Reading a Fault Frequency Signature Per Roller
Every rolling element bearing has a small set of geometry-driven frequencies at which a defect announces itself: the ball pass frequency of the outer race, the ball pass frequency of the inner race, the fundamental train frequency of the cage, and the ball spin frequency. These are calculated from the bearing's pitch diameter, roller element diameter, contact angle, and the shaft's actual rotational speed — not looked up from a generic chart, because two idlers running the same bearing model at slightly different belt speeds will carry slightly different fault frequencies. In published conveyor idler studies, a common sealed bearing running at roughly 105 to 110 RPM carries a probable outer race fault frequency in the low single-digit Hz range, a signal that sits well below what a person can consciously distinguish from background belt noise but is straightforward for a sensor sampling continuously to isolate. Once the platform holds this per-roller signature, it does not just watch for "loud" or "quiet" — it watches a narrow frequency band and its harmonics for the specific roller in question, which is what lets it separate a genuinely degrading bearing from a belt splice clamp, a nearby crusher, or ordinary material spillage hitting the idler shell.
From First Pit to Seized Roller: The Bearing Fault Timeline
A roller bearing rarely fails without warning — it moves through a predictable sequence, and each stage carries a different acoustic signature and a different intervention cost. Understanding where a roller sits on that timeline is what turns acoustic emission data into a scheduling decision rather than just an alert.
Incipient Wear
Rolling elements begin pitting, fretting, or fatiguing from abrasive dust and lubricant breakdown. The roller still turns freely and sounds normal to a passing technician, but acoustic energy at the calculated fault frequency starts rising above baseline.
Progressive Damage
Spalling spreads across the race, harmonics of the fault frequency appear, and broadband acoustic energy climbs. This is the window where a planned roller swap during a routine stoppage avoids any unplanned line stop.
Final Failure
Excess runout, an audible grind, or a roller starting to drag becomes noticeable even without sensors. Acoustic signatures are unmistakable at this stage, but the intervention window is now measured in shifts, not weeks.
Catastrophic Seizure
The bearing locks, the roller stops turning, and the moving belt drags across a stationary shell. This friction can score or rip the belt cover and, on dust-laden lines, generate enough localized heat to become a safety hazard.
Walk-By Inspection vs. Continuous Acoustic Emission Monitoring
The gap between a technician's weekly listening round and a continuously sampled acoustic sensor network shows up most clearly when the numbers sit side by side. Detection speed, coverage, and the cost of the average intervention all shift once every roller has a standing acoustic baseline instead of an occasional pass-by check.
| Monitoring Metric | Weekly Walk-By Inspection | Continuous Acoustic Emission |
|---|---|---|
| Rollers screened per shift | 40–80 (subject to route length) | Every monitored roller, every shift |
| Typical detection stage | Final failure (audible grinding) | Incipient wear (fault-frequency drift) |
| Time from onset to flag | Days to weeks, route-dependent | Within the current listening cycle |
| Average intervention | Reactive belt or roller repair | Planned roller swap during a scheduled stop |
| Documentation | Paper or spreadsheet route sheet | Work order with roller ID and acoustic history |
Acoustic emission flagged a roller two galleries over from where our last walk-by check happened. We swapped it during a scheduled blast adjustment instead of finding out about it when the belt tracked off center. That single catch paid for the sensor rollout on that line.
— Conveyor Maintenance Lead, Integrated Steel Mill, USA
What Changes for the Maintenance Team on the Ground
The technology only matters if it changes what a technician actually does on shift, and the biggest shift is in how a day starts. Instead of opening a route sheet and walking a fixed path regardless of what happened overnight, a planner opens a prioritized queue built from confirmed acoustic anomalies, sorted by how far each roller has drifted from its own healthy baseline. A roller sitting in the incipient stage gets scheduled into the next planned stoppage; one already showing progressive-damage harmonics gets pulled forward. Technicians still carry out physical inspections and swaps — acoustic emission does not replace hands-on maintenance — but it removes the guesswork of deciding which roller among hundreds is worth stopping to check. Over a few months, that shift also builds a usable failure history per roller and per bearing model, which feeds back into spares planning: a mill can see which bearing supplier or which gallery zone produces more early failures and adjust procurement or lubrication schedules accordingly, instead of treating every roller replacement as an isolated event.
STEEL PLANT BELT ACOUSTIC CMMS · OXMAINT PLATFORM
Turn Every Roller Into a Monitored Asset
Map fault frequencies to your bearing catalog, stream acoustic data into one dashboard, and let confirmed anomalies open work orders automatically — without adding a single extra walk-by route.
Where the Return on Acoustic Emission Monitoring Shows Up
The financial case for acoustic emission monitoring rarely comes from one dramatic save — it comes from steadily shrinking the number of roller failures that turn into belt damage or an unplanned line stop. A seized idler that gouges or rips a belt cover typically forces a belt section replacement running $50,000 to $200,000 depending on belt width and material grade, plus the lost throughput while that section of the route sits idle. A planned roller swap caught at the incipient or progressive-damage stage, by contrast, is a parts-and-labor job measured in a few hundred dollars and a short scheduled stop. Across a plant running several major conveyor routes, shifting even a handful of failures per year from the reactive column to the planned column changes the maintenance budget meaningfully, and it does so without adding headcount to the walk-by inspection route — the same technicians simply spend their time on rollers the system has already confirmed need attention.
Deploying Acoustic Emission Monitoring Without Stopping the Line
Rolling out acoustic emission sensing across a steel plant's conveyor network is a phased job, not a shutdown. Sensors clip onto existing gallery structures or ride on scheduled drone and handheld acoustic scans, so production continues while the baseline is built. The steps below reflect a typical rollout across a single major conveyor route before the same pattern repeats across the rest of the plant, and each phase is designed so operations never has to slow the belt to accommodate it.
Map the Idler Population and Bearing Catalog
Walk the route once to log every idler position, bearing model, and running speed. This roller-level inventory is what lets the platform calculate a fault frequency for each individual bearing instead of applying one generic threshold to the whole gallery.
Install Sensors or Schedule Recurring Acoustic Scans
Fixed listening posts go on high-idler-density zones and known trouble spots; lower-density stretches are covered by recurring handheld or drone acoustic passes. Data starts streaming into the platform within the first week, with zero conveyor downtime required.
Build the Healthy Baseline and Tune Thresholds
Two to four weeks of acoustic data establishes what normal sounds like for each roller under your plant's real dust, load, and ambient noise conditions. Thresholds are tuned during this window so early alerts stay meaningful instead of noisy.
Route Confirmed Alerts Into the CMMS
Once the classifier is tuned, confirmed anomalies automatically generate work orders inside your steel plant CMMS, complete with roller ID, gallery location, and acoustic trend history, so the assigned technician knows exactly what to inspect before walking out.
Frequently Asked Questions — Steel Belt Acoustic Emission Monitoring
What makes acoustic emission better suited to idlers than standard vibration sensors?
Idlers run at low RPM, where vibration energy from an early bearing defect is weak and easy to miss. Acoustic emission captures the high-frequency stress waves a defect releases regardless of roller speed, so incipient damage shows up sooner.
Do we need a sensor on every single idler roller?
No. Fixed listening posts cover high-density or high-risk zones, while recurring handheld or drone acoustic scans cover the rest of the route. Both feed the same fault-frequency matching engine inside the platform.
How does the system tell a bad bearing apart from normal belt or plant noise?
Each roller's bearing model and speed define an expected fault frequency. The classifier checks acoustic energy specifically at that frequency and its harmonics, filtering out splices, clamps, and general gallery noise that a fixed loudness threshold would miss.
Can this replace our existing weekly walk-by inspection route entirely?
Most mills run both in parallel at first, then shift inspection time toward rollers the acoustic system actually flags. You can compare the two approaches and see current detection benchmarks by starting a free trial against your own route data.
How is this connected to our steel plant CMMS?
Confirmed acoustic anomalies generate a work order automatically, tagged with the roller ID, gallery position, and acoustic trend. Planners see a prioritized queue instead of a raw data feed, and every reading stays attached to that roller's maintenance history.
STEEL BELT ACOUSTIC EMISSION SOFTWARE · OXMAINT PLATFORM
Give Every Idler Roller a Voice Before It Fails
Map your bearing catalog, calculate fault frequencies per roller, and let acoustic emission data drive your steel plant CMMS work orders — start today with your own conveyor route.