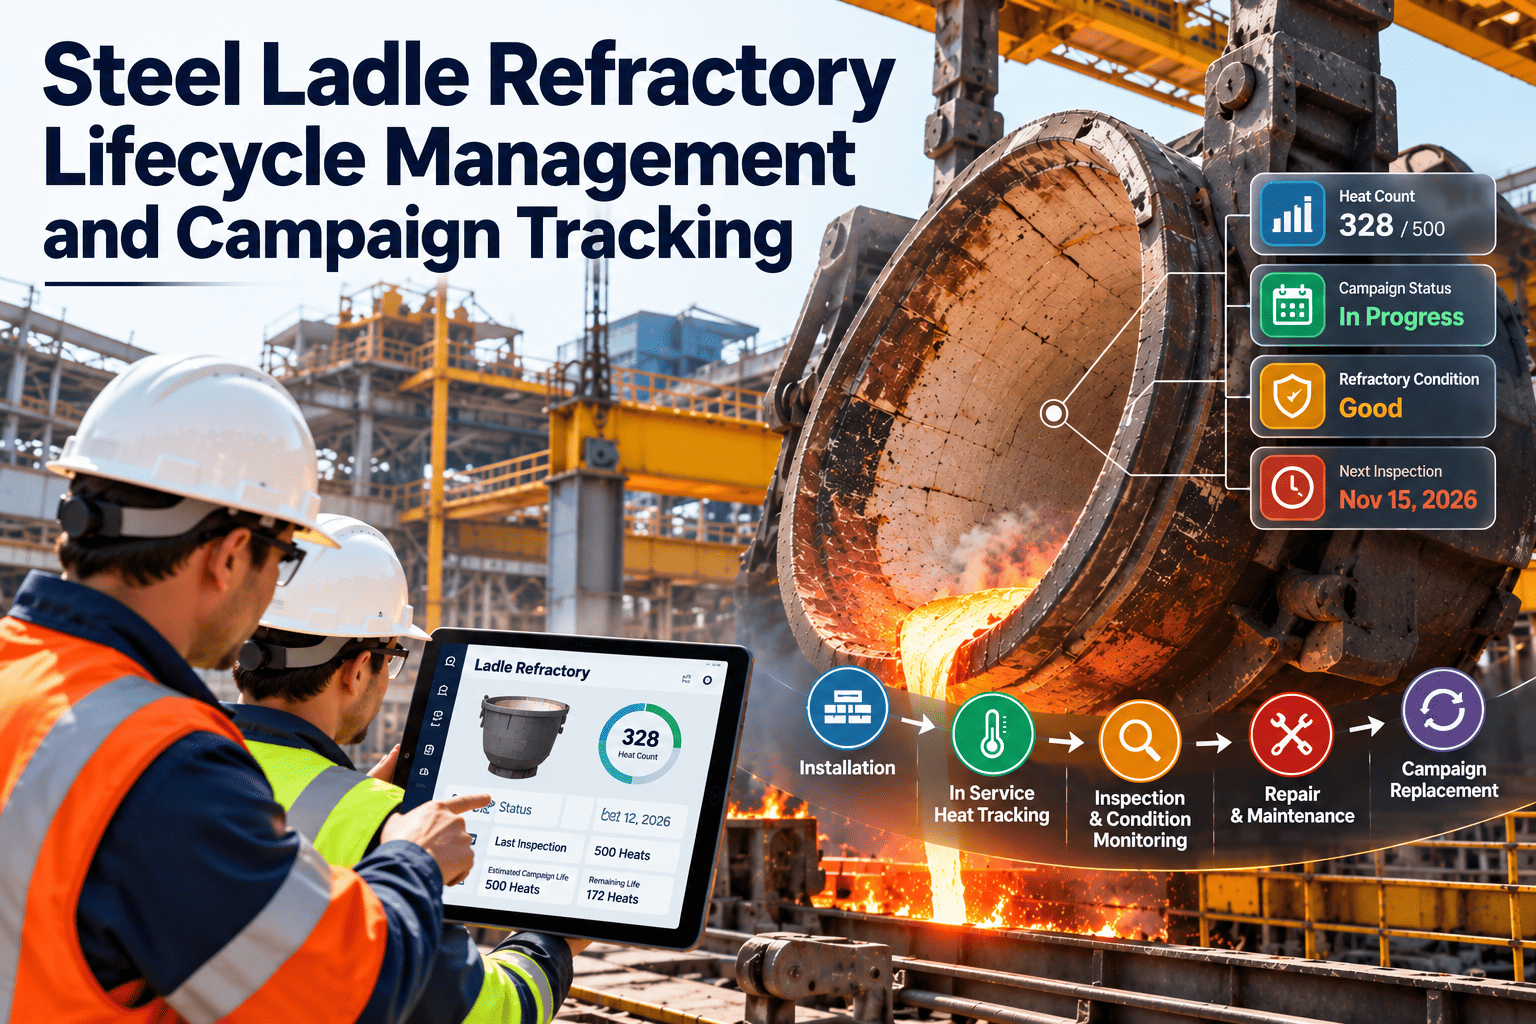
Predicting how much life a ladle lining has left is one of the most valuable and least certain judgements in a melt shop. Retire a lining too early and good refractory is wasted, while running it too long risks a breakout, a lost heat or a safety incident. Wear prediction replaces gut feel with measured thickness, heat history and wear rate by zone, and a connected condition-based maintenance platform can store those readings and turn them into planned inspection, repair and relining work.
Steel ladle refractory wear prediction for smarter campaign management
Combine thickness measurements, heat history and zone-level wear rates to estimate remaining campaign life and plan relining before the lining reaches its limit.
The cost of getting the prediction wrong
Prediction errors fall in two directions, and both are expensive in different ways.
- Usable refractory is torn out and discarded.
- Reline labour, drying energy and ladle downtime arrive sooner than necessary.
- Material cost per heat rises without any quality benefit.
- Fleet availability tightens when several ladles are pulled together.
- Thin lining raises the risk of shell overheating and breakout.
- Emergency removals disrupt casting sequences and heat schedules.
- Last-minute repairs are rushed and often of poorer quality.
- People work closer to a hazardous failure than necessary.
The data a wear prediction depends on
A prediction is only as good as the observations behind it. Four groups of data matter most.
Measured condition
Remaining thickness or wear profile by zone, taken at consistent locations and heat intervals.
Usage history
Heat count, time in service, hold time and idle periods since the reline.
Process conditions
Steel grade, temperatures, slag practice, stirring and vacuum or other treatment routes.
Interventions
Gunning, patching and part replacements with their zones and dates, since repairs change the wear curve.
Ways to measure lining condition
Plants use a mix of methods. Each has strengths and limits, so record which method produced each reading.
| Method | What it shows | Strength | Limitation to remember |
|---|---|---|---|
| Visual inspection | Surface condition, cracks, erosion, residual slag, flow control part state | Fast, needs no special equipment | Subjective and hard to compare between inspectors |
| Manual thickness probing | Remaining lining depth at selected points | Simple and low cost | Limited coverage and consistency depends on position |
| Laser or scanning measurement | Lining profile across larger areas | Detailed and repeatable wear mapping | Needs equipment, calibration and a trained operator |
| Shell temperature observation | Hot spots indicating heat transfer through thin lining | Useful safety indicator | Shows a problem late and does not quantify remaining life |
| Teardown measurement | Final wear pattern after retirement | Reveals true limiting zone for the campaign | Available only after the fact, so use it to calibrate predictions |
From simple rules to better forecasts
Prediction does not need to start with advanced analytics. Most plants gain a lot by moving up one level at a time.
Rule of thumb by heat count
Relining is scheduled at a typical number of heats for the lining design. Easy to run but blind to differences between ladles and grades.
Wear rate from measurements
Thickness readings are compared with heats to calculate wear per heat in each zone, then extended forward to the planning limit.
Adjusted for process conditions
Wear rates are separated by grade, temperature class or treatment route so the forecast reflects what the ladle will actually carry next.
Statistical or model-based prediction
Historical campaigns are used to estimate remaining life with a range of uncertainty, validated against teardown results.
How a wear forecast is built, step by step
The logic is easy to follow, which also makes it easy to audit and improve.
Record readings
Enter thickness by zone together with the heat count at the time of measurement.
Calculate wear rate
Divide material lost between inspections by the heats run, for each zone separately.
Find the limiting zone
The zone that reaches its planning limit first sets the expected campaign end.
Project forward
Estimate heats remaining before the limit, adjusted for the grades and conditions scheduled next.
Plan the action
Choose repair, closer monitoring or relining, then book materials and ladle availability.
Keep uncertainty visible
- Show forecasts as a range rather than a single day or heat number.
- Shorten inspection intervals when the range narrows toward the limit.
- Compare each forecast with the teardown result to learn how reliable it was.
Zone-level wear behaviour to track
Each zone has its own typical drivers, so predictions should not be averaged across the whole ladle.
Slag line
Strongly influenced by slag chemistry, slag volume and contact time. Often the limiting zone and the first candidate for targeted repair.
Sidewall
Wear follows steel contact time, temperature and cycling. Usually more uniform but sensitive to preheat and cooling practice.
Bottom and impact area
Affected by tapping stream energy and mechanical erosion, which can accelerate localised wear.
Purging and flow control area
Porous plugs, well blocks and nozzles have their own wear cycles and can fail before the main lining.
Turning predictions into alerts and work orders
A forecast only creates value when it changes what the team does. Link prediction to a clear action ladder.
Common reasons predictions disappoint
Data problems
- Measurements taken at different points each time.
- Heat count errors that distort wear per heat.
- Repairs not recorded, so wear appears to reverse.
- Different inspectors using different methods without noting it.
Interpretation problems
- Averaging wear across zones and missing the limiting one.
- Assuming wear is linear when it accelerates near the end.
- Ignoring grade and treatment changes between inspections.
- Never checking forecasts against teardown findings.
Measuring prediction quality and campaign results
Prediction improves when its performance is measured like any other maintenance process.
A worked example of the forecasting logic
The numbers below are placeholders to show the reasoning, not typical values. Use your own lining design, limits and measurements.
| Step | What you do | What it tells you |
|---|---|---|
| 1. Baseline | Record the starting lining thickness for each zone at reline. | The reference point for all later wear calculations. |
| 2. First inspection | Measure each zone and note the heat count. | Early wear rate, useful for spotting installation or preheat problems. |
| 3. Later inspections | Repeat at consistent locations and compare each interval. | Whether wear is steady, accelerating or slowing after repairs. |
| 4. Limiting zone | Find the zone closest to its planning limit relative to its wear rate. | The zone that decides the campaign end. |
| 5. Forecast | Divide remaining usable thickness by the recent wear rate per heat. | An estimate of heats remaining, to be shown with a range. |
| 6. Compare at teardown | Check the forecast against the real final wear pattern. | Calibration for the next campaign's assumptions. |
Why use recent wear rate rather than the campaign average
- Wear often accelerates as the lining thins and as thermal stresses grow.
- Changes in steel grade or practice can alter the rate partway through a campaign.
- Recent intervals show the current behaviour that will continue into the next heats.
Connecting forecasts to melt shop planning
A forecast that stays in the refractory office has little impact. The value appears when planners can use it.
Ladle allocation
Planners can assign more demanding grades to ladles with healthier linings and reserve worn ladles for lighter duty until relining.
Fleet availability
Forecast retirement dates show when several ladles may need relining together, so stops can be staggered.
Material orders
Buyers receive earlier, firmer demand signals for bricks, monolithics and flow control parts.
Contractor booking
Relining crews can be scheduled ahead of need instead of being called after an unplanned removal.
Safety margins and escalation rules
Prediction supports judgement but does not replace it. Define in advance when the forecast must yield to a safety trigger.
Rules to write down
- The planning limit for each zone, agreed by refractory, melt shop and safety teams.
- The conditions that require immediate removal regardless of forecast.
- Who may authorise extending a campaign past the planning limit, and what evidence they need.
- How shell temperature observations are recorded and escalated.
Why documented rules help
- Decisions stay consistent across shifts and supervisors.
- Pressure to keep a ladle running during a tight schedule meets a clear, agreed boundary.
- Incident reviews can see which rule applied and whether it was followed.
- New staff learn the safe operating limits quickly.
Using prediction data in supplier trials and benchmarking
Once wear rates are recorded by zone, comparing materials becomes much more objective.
- Like-for-like comparison: compare wear per heat for the same zone, grade mix and treatment route.
- Trial documentation: record the material, installation date and any practice changes so the result can be explained later.
- Cost interpretation: combine wear rate with material and repair cost to judge cost per heat instead of purchase price alone.
- Benchmarking across ladles: unusually fast or slow wear on one ladle prompts a check of installation, preheating or handling.
Building a prediction practice in stages
A reliable forecast grows from disciplined measurement, not from software alone.
Standardise
Fix measurement points, methods and units so readings from different inspectors can be compared.
Record
Enter every reading with the heat count, zone, method and date immediately after the inspection.
Trend
Plot wear against heats by zone and review the slope at each inspection.
Act
Use agreed limits to trigger repair, monitoring or relining work orders.
Calibrate
Compare every forecast with the teardown result and update assumptions for the next campaign.
Repairs change the curve: recording gunning and patching
A repair resets part of the wear picture. If it is not recorded, the forecast will misread the improvement as measurement error.
- Zone and area: note exactly where material was added so later readings are interpreted correctly.
- Method and material: gunning, patching and partial rebuilds behave differently and should be recorded as such.
- Heat count at repair: allows wear rate to be calculated separately before and after the intervention.
- Follow-up measurement: a reading soon after the repair confirms the new baseline.
- Result review: compare repaired zones with untouched ones to see how much life each repair really added.
Practical tips for consistent lining measurement
- Mark measurement points on the ladle or in the job plan so each inspector measures the same place.
- Measure at a similar thermal condition each time, since temperature can influence readings and access.
- Use the same method for trend comparison and note any change of method in the record.
- Take photographs alongside readings to help later review of unusual wear.
- Train backup inspectors so predictions do not depend on one experienced person.
What good looks like after a few campaigns
- Every inspection produces comparable readings by zone, linked to the heat count and the person who took them.
- Planners can see a forecast retirement window for each ladle and use it when allocating grades and scheduling stops.
- Relining is mostly planned, with materials and contractors ready before the limit is reached.
- Teardown findings are routinely compared with forecasts, and the difference is shrinking over time.
- Safety triggers are clear, rehearsed and applied the same way on every shift.
How Oxmaint supports wear prediction workflows
Prediction relies on organised readings, scheduled inspections and fast follow-up, which are core maintenance management functions.
Ladle wear prediction: frequently asked questions
Is wear prediction only for advanced plants?
No, a simple wear-rate calculation from regular measurements already beats fixed heat limits and needs no complex tools.
How often should the lining be measured?
Often enough to see the trend, with intervals shortening as the lining approaches its planning limit.
Why predict by zone instead of for the whole ladle?
The most worn zone sets the safe limit, so an average can hide the area that matters. You can schedule a demo to see zone records.
How do we know the prediction is reliable?
Compare each forecast with teardown findings and adjust assumptions after every campaign.
What is a good first step?
Standardise measurement points and record them with heat counts. You can sign up and start with one ladle.
Plan every reline from evidence, not guesswork
Connect measurements, heat history and repairs to forecast ladle lining life with confidence.