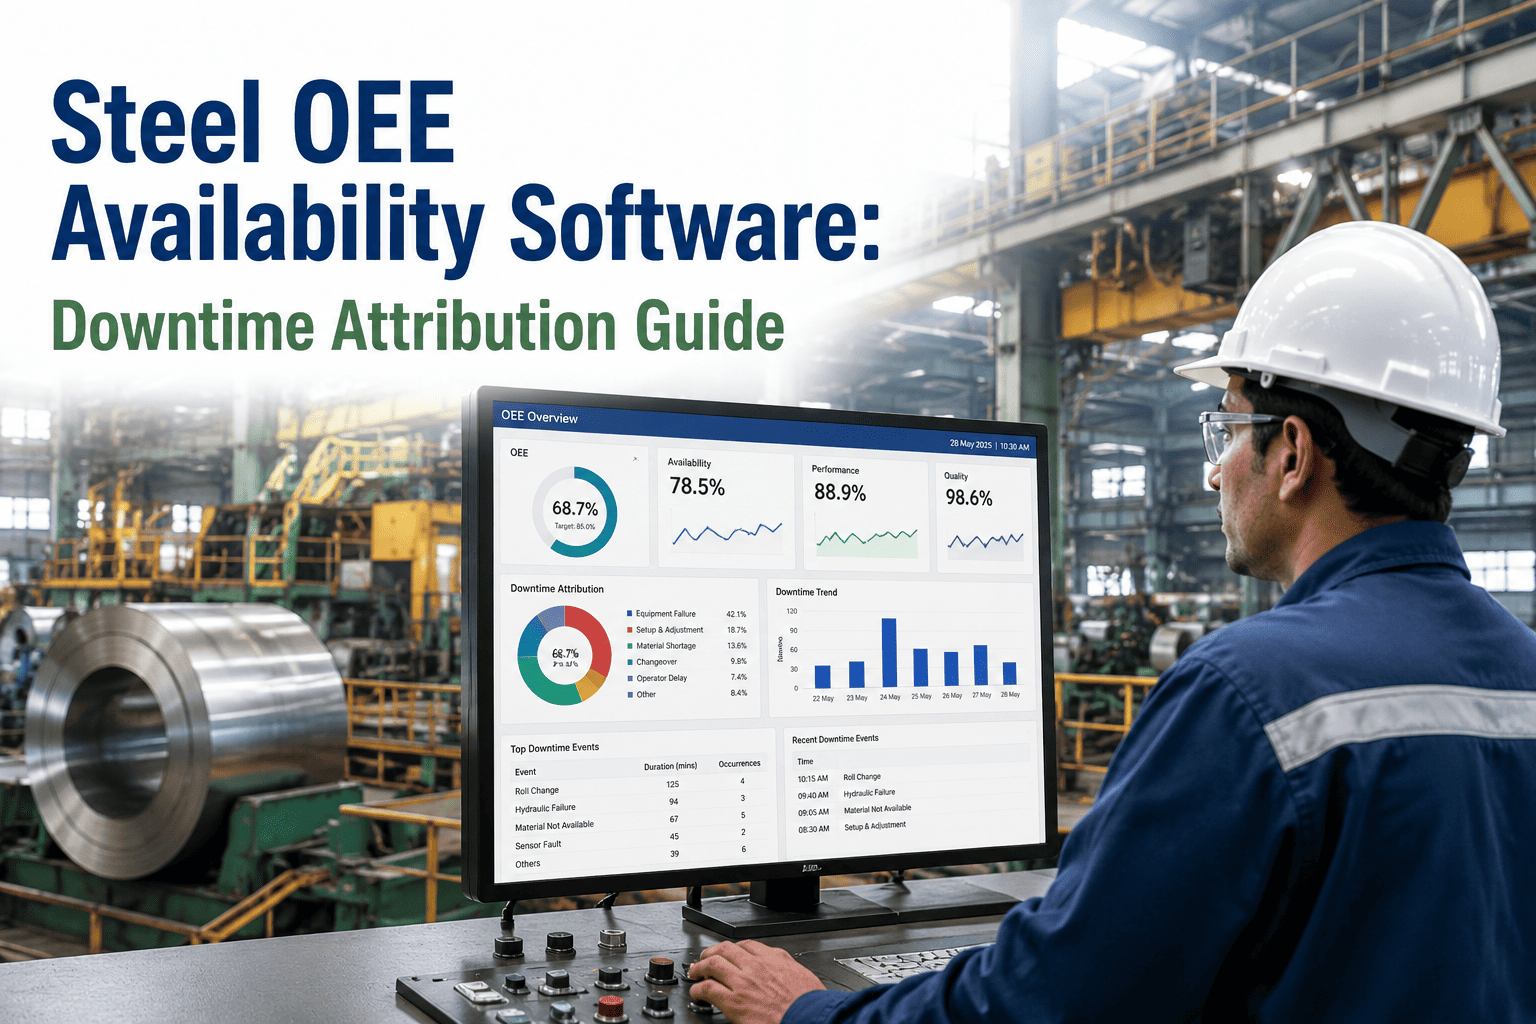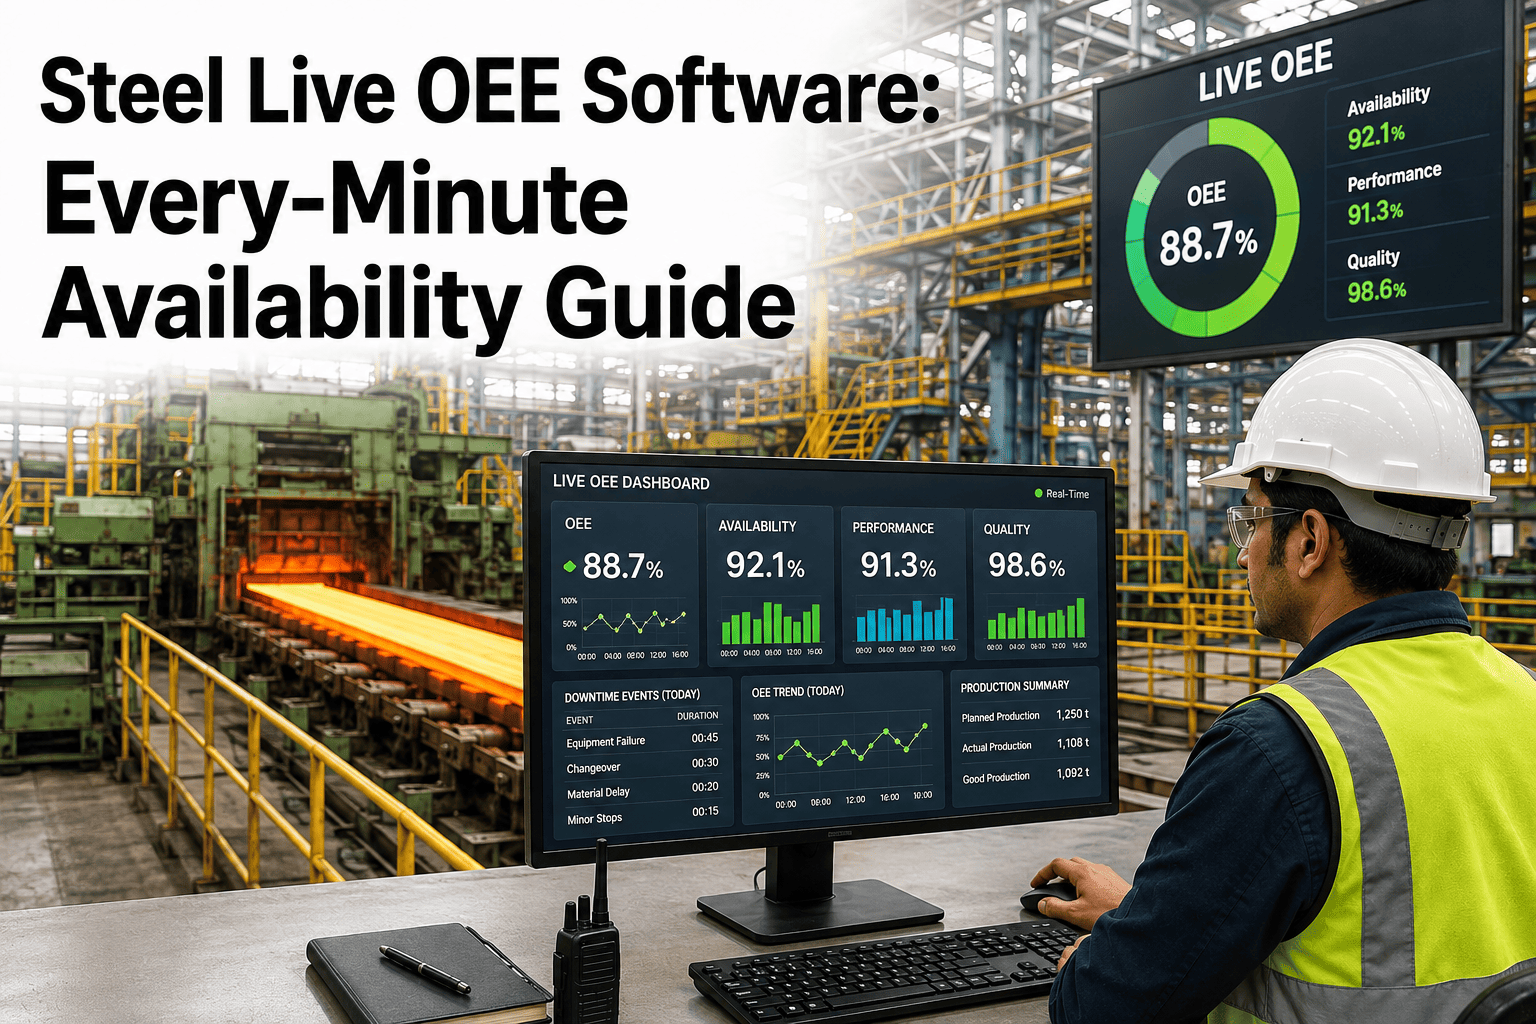
By the time a shift-end OEE report lands in a supervisor's inbox, the eight hours it describes are already gone — the eleven-minute changeover that ran long, the run of coils that drifted off gauge for twenty minutes, the six short stops that never individually looked worth logging but added up to an hour of lost run time. Traditional OEE reporting in a steel plant is built around a shift or daily rollup, which is useful for a monthly review but useless for the supervisor who needed to know at 10:42 AM that performance had dropped eight points so they could act before the next four hours ran the same way. Live OEE software closes that gap by calculating availability, performance, and quality continuously, minute by minute, off the same line data most mills already collect. This guide covers what live OEE actually measures differently from a shift report, why the timing matters more than the number itself, and how a purpose-built CMMS like OxMaint turns a live OEE dip into an action before the shift ends instead of a line item after it.
Live OEE: Availability, Performance, and Quality Updated Every Minute — Not Every Shift
Why an OEE number calculated once a shift arrives too late to act on, and what it looks like when availability, performance, and quality update in real time instead.
The OEE Formula, and Why Each Piece Needs to Move in Real Time
Overall Equipment Effectiveness is not one measurement — it is three, multiplied together. Each factor degrades for a different reason on a mill or caster line, and each one needs to be visible the moment it starts slipping, not summarized after the fact.
Shift-End Report vs Live OEE: What the Supervisor Actually Sees
The same eight-hour shift looks completely different depending on when the data reaches the person who can act on it.
OxMaint recalculates availability, performance, and quality continuously off your existing line data, so a supervisor sees a performance dip the same minute it starts — not the next morning in a report.
Live OEE vs Shift-Based Reporting, Side by Side
| Reporting Approach | Shift or Daily OEE | Live OEE |
|---|---|---|
| Update frequency | Once per shift or once per day | Continuous, minute by minute |
| Micro-stop visibility | Aggregated into a single downtime total | Each stop flagged individually with cause |
| Time to act on a dip | Often after the shift has already ended | Within the same run, before it compounds |
| Quality drift detection | Caught at final inspection or next shift review | Flagged while the run is still in progress |
| Root cause traceability | Reconstructed from memory and logs after the fact | Tied to the exact minute and asset automatically |
What Live OEE Actually Tracks, Minute to Minute
Live OEE is not a faster version of the same shift report — it tracks a different level of detail that a daily rollup simply cannot hold.
Time to Detection: Shift Report vs Live OEE
The value of live OEE is almost entirely about timing. The same performance dip that takes hours to surface in a shift report is visible within minutes on a live view.
Stop waiting for the shift-end report to find out what already happened. See availability, performance, and quality move in real time on the assets you run every day.
Field Perspective
A shift OEE number is a grade on a test you already turned in. It tells you what happened, but the shift is over and there is nothing left to fix. What changed for my line was not a better number, it was getting that number while the shift was still running, broken down enough to see which micro-stop or which speed drop was actually driving it. That is the difference between reacting the next morning and adjusting the same hour.
Frequently Asked Questions
See Availability, Performance, and Quality Move in Real Time — Not Tomorrow Morning
Give your supervisors a live OEE view that flags a dip while the shift can still be adjusted, instead of a report that only explains what already went wrong.