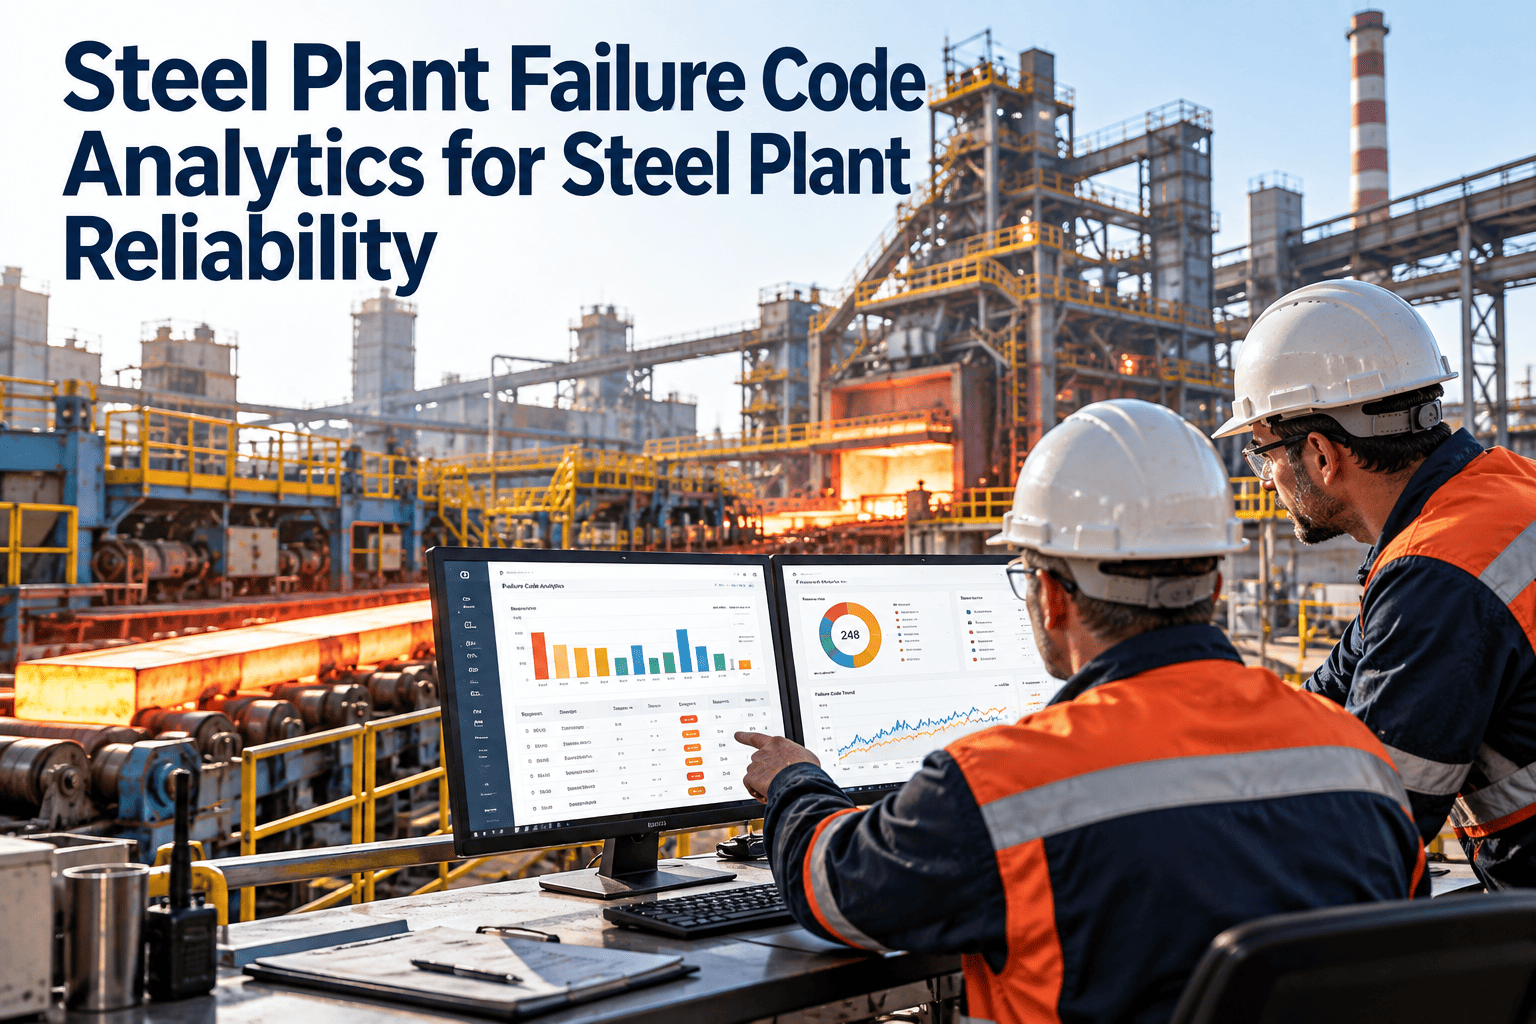
Steel Plant Failure Code Analytics for Steel Plant Reliability

By Corin Hale on September 29, 2026

steel-plant-failure-code-analytics-reliability

Most steel plants record thousands of breakdowns a year, yet few can say which failure modes cost them the most. The reason is usually the data: free-text descriptions, inconsistent codes and work orders closed with "repaired" as the only note. Failure code analytics fixes this by standardizing how failures are described, so reliability patterns become visible on a furnace fan, a crane gearbox or a caster segment. This guide shows how to build it, and how a steel plant CMMS keeps the data clean at the point of entry.

AI and Analytics / Steel Plant Reliability

Steel Plant Failure Code Analytics for Reliability Teams

Standardize failure codes, then measure failure-mode frequency, repeat failures, MTBF and degradation by asset class.
Asset class: Gearbox, Motor, Pump, Roll, Crane

Failure mode: Overheating, Leak, Vibration, Wear, Jam

Cause: Lubrication, Misalignment, Contamination, Overload

Action: Replace, Repair, Adjust, Clean, Redesign

What Breaks When Failure Data Is Unstructured

Typical work order text

Fan noisy, checked, ok
Motor tripped, reset
Leak at pump, tightened
Gearbox problem, repaired

What analytics needs

Asset: ID fan, bearing DE. Mode: high vibration. Cause: looseness. Action: re-tightened and re-aligned.
Asset: Cooling pump. Mode: external leak. Cause: seal wear. Action: mechanical seal replaced.
Asset: Roller table motor. Mode: thermal trip. Cause: blocked ventilation. Action: cleaned.
Asset: Crane gearbox. Mode: oil leak. Cause: breather failure. Action: breather replaced.

Free text is readable to the technician who wrote it and useless to a trend report. Codes turn stories into countable events.

Steel Plant Conditions That Make Failure Analysis Hard

  • Heat, scale, dust, water and vibration create many overlapping failure mechanisms on the same equipment
  • Continuous operation limits access, so repairs are rushed and details go unrecorded
  • Assets range from fixed equipment to mobile cranes and ladle cars, each with different failure profiles
  • Contract crews and shift changes produce inconsistent descriptions of the same problem
  • Production delays get logged, but not always the failing component
  • Root cause is often a process effect, such as overload or temperature excursions, not the part that broke

Designing a Failure Code Structure That People Will Use

Industrial standards such as ISO 14224 describe how to collect reliability and maintenance data, including failure mode, mechanism and cause. Use them as a guide, then trim to what technicians can select in seconds.

Problem

What was observed?

The symptom the technician saw: noise, leak, trip, high temperature, no start, wear.
Cause

Why did it happen?

The underlying reason: lubrication, contamination, misalignment, overload, aging, operator error, design.
Remedy

What fixed it?

The action taken: replace, repair, adjust, clean, lubricate, recalibrate, no fault found.

Rules for a usable code list

Keep each list short enough to scan on a phone
Make codes mutually exclusive so two technicians pick the same one
Filter codes by asset class so a pump never offers a conveyor belt option
Include an Other option, then review it monthly and promote repeat entries to real codes
Separate failure mode (what happened) from cause (why) from remedy (what was done)

Failure Modes by Steel Plant Asset Class

Asset classCommon failure modesTypical causesAnalytics question
Electric motorsOverheating, winding fault, bearing failureBlocked cooling, contamination, misalignmentWhich motors trip repeatedly, and after what load
GearboxesOil leak, gear wear, high vibrationLubricant degradation, overload, breather failureIs wear tied to lubricant age or load
Pumps and hydraulicsSeal leak, cavitation, pressure lossSeal wear, filter blockage, air ingressDo failures cluster after filter delays
Fans and blowersImbalance, bearing failure, foulingDust build-up, looseness, wearHow long between cleaning and vibration alarms
Rolls and bearingsSurface wear, spalling, bearing seizureThermal load, lubrication loss, contaminationWhich stands fail early in the campaign
Cranes and hoistsBrake wear, rope damage, limit switch faultsDuty cycle, heat, wearWhich cranes carry the most repeat electrical faults
Conveyors and roller tablesBelt damage, roller seizure, drive tripsMisalignment, spillage, jamWhere do jams recur by location

The Analytics That Coded Failures Unlock

Failure mode frequency
Count events by mode and asset class to rank what fails most often. Pareto charts make the shortlist obvious.
Repeat failure rate
Find assets that fail with the same mode within a set window, which signals a fix that did not last.
MTBF
Mean time between failures, calculated per asset or class, shows reliability trend and compares similar equipment.
MTTR
Mean time to repair by failure mode reveals where spares, skills or access slow recovery.
Downtime by cause
Link hours lost to codes, so lubrication issues can be compared to electrical faults in production terms.
Degradation patterns
Failures that arrive at similar ages or loads suggest wear-out, while random ones suggest other drivers.
MTBF in one line
MTBF = Total operating time divided by the number of failures in that period
Use operating hours, not calendar hours, and count only failures within the scope you define. Consistent scope matters more than the number.

Give Every Breakdown a Code That Means Something

Capture failure mode, cause and remedy on the work order, then report on it without spreadsheets.

Reading a Pareto: Where to Act First

The bars below show the shape you should expect, not real plant data. A few failure modes usually account for most lost time.

Mode A

Mode B

Mode C

Mode D

Mode E

Rank by downtime hours and by cost as well as by count. A rare failure on a critical caster component can outweigh many minor ones.

Repeat Failures: The Cost of Fixing Symptoms


Failure 1

Pump seal leaks. Seal replaced. Code: seal wear.

Failure 2

Same pump, same mode, weeks later. Seal replaced again.

Analytics flag

Repeat failure alert on the asset and failure mode combination.

Root cause review

Shaft alignment and cooling water quality investigated.

Permanent fix

Alignment corrected, PM task added, recurrence tracked.

Without codes, both failures look like unrelated jobs. With them, the second event becomes a trigger for root cause analysis.

From Codes to Predictive and Condition-Based Maintenance

Choose the right strategy per mode

Wear-out modes suit time or usage-based PM. Random failures may suit inspections or condition monitoring.

Set monitoring targets

Codes show which failure modes justify vibration, temperature or oil analysis on which assets.

Train useful models

Predictive models need labelled failure history. Consistent codes supply the labels.

Verify the results

Compare failure rates before and after each strategy change to see if it worked.
Predictive analytics is only as good as its history. Sensor data without accurate failure records makes it hard to know what the sensor is warning about. Start with a few high-consequence assets, confirm that alerts match coded failures, and expand only when technicians agree the warnings are useful. Trust from the shop floor matters more than model complexity.

How Oxmaint Supports Failure Code Analytics

1

Register assets

Build a hierarchy of plant areas, equipment and components so failures attach to the right asset.
2

Capture on the work order

Technicians record failure details, notes and parts on mobile as the job is closed.
3

Review the history

Filter completed work by asset, type and period to find repeat events.
4

Adjust the plan

Add or change preventive maintenance tasks, inspections and spares based on the pattern.
5

Report and repeat

Share dashboards with reliability, maintenance and operations leaders each month.

Confirm exactly how failure classification fields are configured for your plant in a live demo, so the structure matches your reporting needs.

Keeping Failure Data Trustworthy

Analytics fail quietly when data quality slips. A few routine controls keep the dataset useful year after year.

Weekly

Spot check closed work orders

Planners sample completed jobs for missing codes, vague notes and codes that do not match the description. Feedback goes to the technician the same week.
Monthly

Review the Other and Unknown share

A growing share means the list is missing real failure modes or people are skipping the field. Add codes or retrain accordingly.
Quarterly

Reconcile with production downtime

Compare maintenance records against operations delay logs. Gaps show breakdowns that never reached a work order.
Yearly

Refresh the code library

Retire unused codes, split overloaded ones and align the list with new equipment, strategies and safety requirements.

Who Uses the Analytics and For What

RoleDecision supportedReport they need
Maintenance technicianChoose the likely cause before starting a repairRecent failures and remedies on the same asset
Maintenance plannerAdjust PM frequency and task contentFailure modes not covered by current PM tasks
Reliability engineerPrioritize root cause analysis and redesignPareto by downtime, repeat failure list, MTBF trend
Operations managerUnderstand production risk from equipmentDowntime hours by area and failure cause
Stores and procurementStock the parts that fail mostParts consumed by failure mode and asset class

Worked Example: Reading One Asset's History

Consider a descaling pump with several coded events over a year. The pattern, not any single job, tells the story.

EventFailure modeCauseRemedyWhat the analyst learns
FirstExternal leakSeal wearSeal replacedNormal wear, no concern yet
SecondExternal leakSeal wearSeal replacedInterval shorter than expected
ThirdHigh vibrationMisalignmentRealignedPossible link to the seal failures
FourthPressure lossSuction blockageStrainer cleanedCleaning task missing from PM
Four different jobs, three related causes. Seeing them together points to alignment and suction condition, not simply a bad seal supplier.

Safety, Compliance and Audit Value

  • Coded history shows whether safety-critical devices such as brakes, interlocks and guards have failed repeatedly
  • Records support internal audits and management system reviews, including ISO 55001 style asset management practices
  • Insurers and regulators often ask how recurring incidents were investigated and closed
  • Near-miss and failure trends can be reviewed together to find shared equipment causes
  • Consistent remedy codes prove that corrective actions were carried out, not just planned

Linking Failure Codes to Spares and Cost

Parts by failure mode

Recording parts against each coded failure shows which spares are consumed by which problems, and helps set stock levels.

Labor by failure mode

Repair hours per mode reveal jobs that need better tools, procedures or training.

Contractor performance

Repeat failures after outside repairs can be spotted and raised with the supplier using evidence.

Budget conversations

Cost by cause supports investment cases for redesign, upgraded components or condition monitoring.

A First 90 Days Plan

Days 1 to 30
Pick two or three critical areas
Draft mode, cause and remedy lists with technicians
Confirm asset hierarchy and IDs
Days 31 to 60
Make codes required at work order closure
Train each shift with real examples
Run weekly quality spot checks
Days 61 to 90
Produce the first Pareto and repeat failure list
Start two root cause reviews
Adjust PM tasks and record the change

Failure Code Maturity: Where Is Your Plant?

Level 1
Free text only. Repairs described differently by every technician.
Level 2
Basic codes exist but are inconsistent or overused (Other, Unknown).
Level 3
Codes by asset class, with mode, cause and remedy. Monthly Pareto reviews.
Level 4
Repeat failure alerts drive root cause studies and PM changes.
Level 5
Failure data feeds condition monitoring and predictive models.

Questions Every Monthly Reliability Review Should Answer

Which three failure modes caused the most downtime hours this month, and are they the same as last month
Which assets failed with the same mode more than once, and what changed after the last repair
Which critical assets have no coded failures at all, and is that good reliability or missing data
Which failure modes are not covered by any preventive task or inspection
Which root cause studies remain open, and who owns the next step
Which code changes are needed to make next month's data clearer

Common Mistakes to Avoid

  • Creating hundreds of codes that technicians cannot remember or find
  • Letting Other and Unknown become the biggest category
  • Mixing the symptom, the cause and the repair action into a single field
  • Skipping training and feedback, so codes are chosen at random to close the job
  • Ignoring failures on critical assets because they are rare
  • Calculating MTBF with inconsistent start dates or scope

Frequently Asked Questions

How many failure codes should a steel plant start with?
Start small, with a short list per asset class. Add codes only when the Other category shows repeated patterns.
Do failure codes help with MTBF accuracy?
Yes. Codes separate true failures from adjustments and planned work. Sign up to test it on your own assets.
Can we classify old work orders?
Partly. Focus on critical assets and recent history first, then let new work orders build the clean dataset.
What is the difference between failure mode and cause?
Mode is how the asset failed, for example a leak. Cause is why, such as seal wear or misalignment.
Is a CMMS required for failure analytics?
Not strictly, but it captures data consistently. Book a demo to see the workflow.

Build the Failure History Your Reliability Program Needs

Bring assets, work orders and failure records into one system and find the failures worth fixing first.

Share This Story, Choose Your Platform!