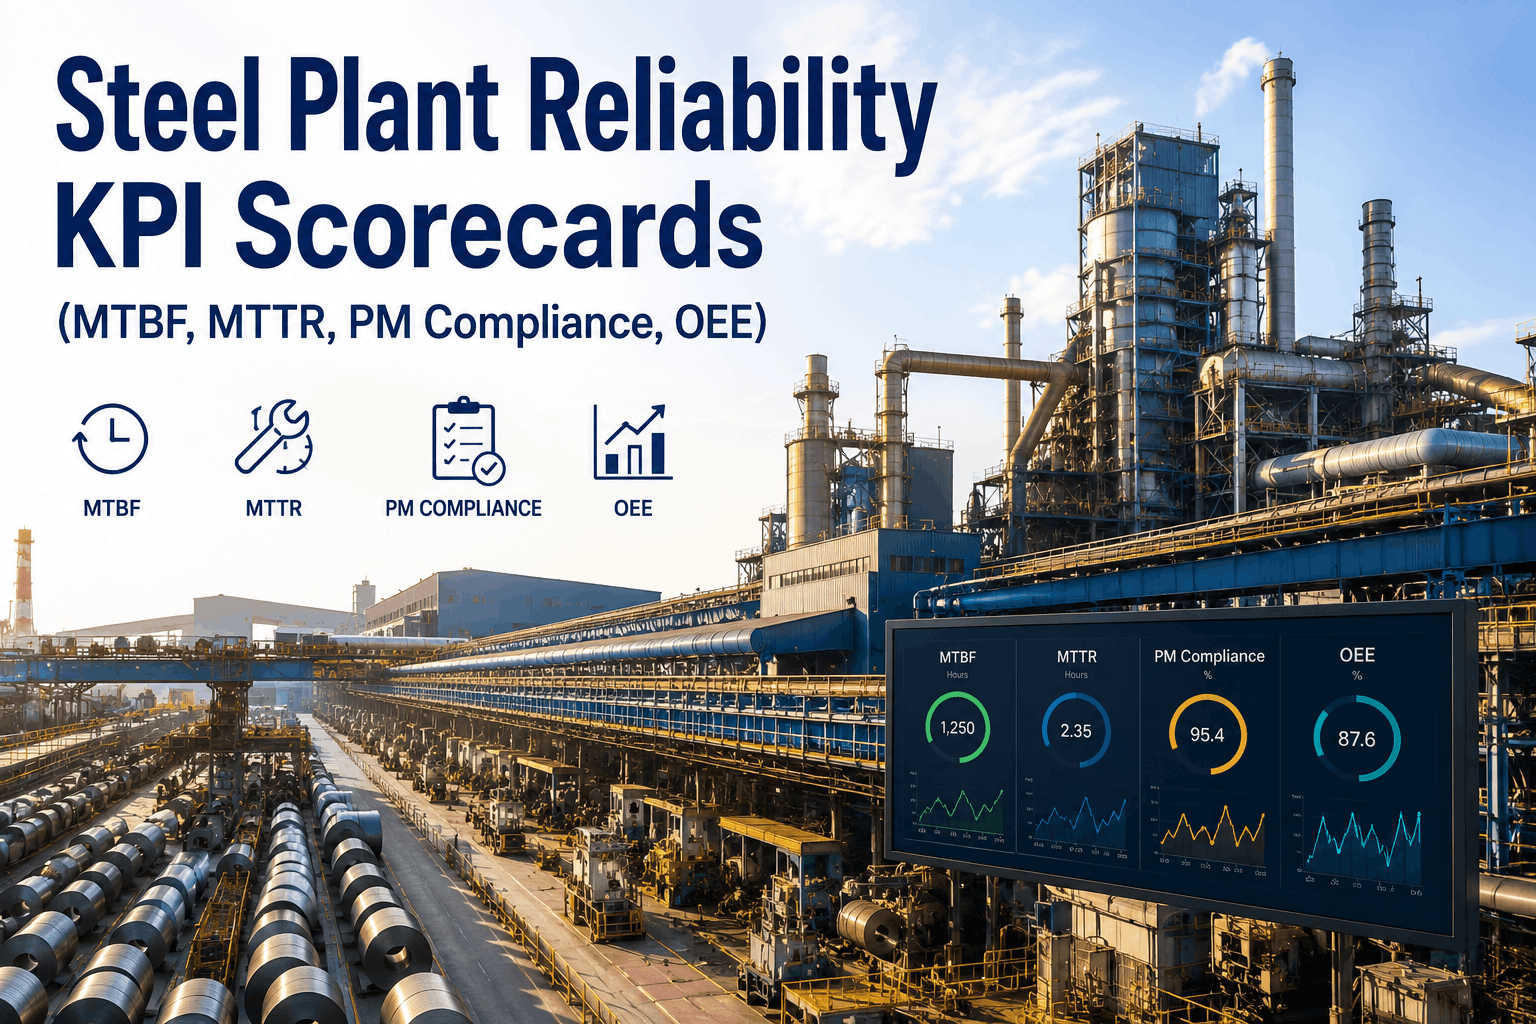
Your CMMS already contains the data that reveals your plant's reliability performance — the problem is that 76% of steel plant managers never track it systematically. Every work order your maintenance team has closed, every hour of downtime they have logged, every production shift they have lost over the past 24 months contains reliability patterns that repeat with statistical regularity across asset types, production lines, and failure modes. A 2024 industry analysis found that steel plants with comprehensive reliability KPI scorecards achieve 25-40% higher equipment availability than plants without structured performance tracking. The asset that consistently underperforms MTBF targets is not a random variation — it is a pattern sitting in your CMMS right now, invisible because nobody has built the scorecard that surfaces it. Oxmaint's reliability KPI module turns your maintenance history into a performance scorecard — automatically calculating MTBF, MTTR, OEE, and key reliability metrics, flagging underperforming assets, and tracking improvement trends. The data is already yours, and the analysis that drives reliability improvement takes minutes to configure, not months. If your steel plant is still managing reliability through intuition instead of data-driven scorecards, start a free trial or book a demo to see how Oxmaint surfaces reliability insights from your existing data.
Steel Plant Reliability KPI Scorecard: MTBF, MTTR, and OEE
Build a reliability KPI scorecard for steel plant performance tracking — MTBF, MTTR, OEE, availability, PM compliance, and key maintenance metrics for operational excellence.
You Already Have the Reliability Data — You Just Need the Scorecard
Every work order in your CMMS contains reliability data — uptime, downtime, failure frequency, and repair times. Oxmaint does not require new sensors or reliability consultants — it analyzes the maintenance data you have already been collecting and calculates the KPIs that drive performance improvement. Steel plant leaders ready to build a reliability scorecard can start a free trial or book a demo to see how KPI tracking works on your plant's actual data.
The Reliability KPI Scorecard — What to Track and Why
A comprehensive reliability KPI scorecard tracks performance across three dimensions: equipment availability, maintenance effectiveness, and operational efficiency. The scorecard provides visibility into current performance, identifies improvement opportunities, and tracks progress over time .
Additional Reliability KPIs for Steel Plant Scorecard
Beyond MTBF, MTTR, and OEE, a comprehensive scorecard tracks maintenance effectiveness, workforce efficiency, and planning effectiveness through complementary KPIs .
Definition: Percentage of scheduled preventive maintenance completed on time. Target: 90%+ for critical assets; 80%+ for all assets. Low PM compliance correlates with higher failure rates and emergency repairs .
Definition: Percentage of total work orders classified as emergency/unplanned. Target: <20% of total work orders. Reactive maintenance >30% indicates systemic issues .
Definition: Percentage of scheduled work completed within the planned timeframe. Target: 85%+ for planned work. Low compliance indicates planning or execution gaps .
Definition: Number of failures per asset per time period. Target: Continuous reduction year-over-year. Increasing failure frequency indicates asset deterioration or maintenance gaps .
Building Your Steel Plant Reliability Scorecard
Designing an effective reliability scorecard requires selecting the right KPIs for your plant, establishing baselines, setting targets, and defining a reporting cadence .
| KPI Category | KPI Name | Calculation | Steel Plant Target | Reporting Cadence |
|---|---|---|---|---|
| Availability | MTBF | Total operating time ÷ failures | Continuous improvement | Monthly |
| Efficiency | MTTR | Total repair time ÷ repairs | < baseline (reducing) | Monthly |
| Excellence | OEE | Availability × Performance × Quality | 85%+ world-class | Monthly |
| Effectiveness | PM Compliance | PMs completed on time ÷ PMs scheduled | 90%+ critical assets | Weekly |
| Reactivity | Emergency Ratio | Emergency WOs ÷ Total WOs | <20% | Monthly |
| Planning | Schedule Compliance | WOs on schedule ÷ WOs scheduled | 85%+ | Weekly |
Implementing Your Reliability Scorecard — A 5-Step Process
Implementing a reliability scorecard requires a structured approach that establishes baselines, sets targets, and creates a cadence for review and improvement .
Analyze 12-24 months of CMMS data to establish baseline performance for each KPI. MTBF, MTTR, OEE, PM compliance, emergency ratio, and schedule compliance. Baselines provide the starting point against which improvement will be measured.
Set realistic improvement targets for each KPI based on industry benchmarks and historical performance. Targets should be specific, measurable, and time-bound (SMART). Example: Reduce MTTR by 15% in 12 months, achieve 90% PM compliance within 6 months.
Ensure your CMMS captures the data required for each KPI — work order start/stop times for MTTR, asset operating hours for MTBF, and PM completion dates for compliance. Oxmaint calculates KPIs automatically from existing data .
Define the reporting frequency for each KPI — weekly for PM compliance and schedule compliance, monthly for MTBF, MTTR, OEE, and emergency ratio. Create a dashboard for real-time visibility into current performance.
Review performance against targets monthly. Identify underperforming areas and develop improvement plans. Celebrate successes and adjust targets as performance improves. Track year-over-year trends to measure progress.
Steel Plant Reliability Benchmarks by Equipment Type
Reliability benchmarks vary significantly by equipment type and application. The table below provides typical benchmarks for common steel plant equipment, based on industry data .
| Equipment Type | Typical MTBF | Typical MTTR | Typical OEE | PM Compliance Target |
|---|---|---|---|---|
| Blast Furnace | 12-24 months (campaign) | 24-72 hours | 85-90% | 95%+ |
| Continuous Caster | 500-1,500 hours | 6-24 hours | 70-80% | 90%+ |
| Rolling Mill | 500-1,000 hours | 4-12 hours | 65-75% | 85%+ |
| Crane Systems | 2,000-4,000 hours | 2-6 hours | 75-85% | 80%+ |
| Conveyor Systems | 1,000-2,500 hours | 2-8 hours | 70-80% | 85%+ |
ROI of Reliability KPI Scorecard Implementation
Plants with structured reliability KPI tracking achieve 25-40% higher availability than plants without systematic performance monitoring
Targeted reliability improvement based on KPI data reduces unplanned downtime by identifying and addressing underperforming assets
Reliability improvement reduces emergency repairs and optimizes maintenance resource allocation
Reliability KPI scorecard implementation typically pays for itself within 3-6 months through reduced downtime and improved maintenance efficiency
Frequently Asked Questions
What is a reliability KPI scorecard for steel plants?+
How do I calculate MTBF and MTTR for steel plant equipment?+
What is a good OEE target for steel plant equipment?+
How often should reliability KPIs be reviewed?+
Your Reliability Performance Is Already in Your Data — Find It Before It Finds Your Production Schedule
Every work order, downtime event, and repair your steel plant has ever recorded contains the data needed to build a comprehensive reliability scorecard. Oxmaint's KPI module analyzes your maintenance data against steel plant benchmarks, calculates MTBF, MTTR, OEE, and key metrics automatically, and surfaces the performance insights that drive reliability improvement. No manual calculations. No spreadsheet tracking. Import your data, build your scorecard, and start improving reliability in your first 30 days.