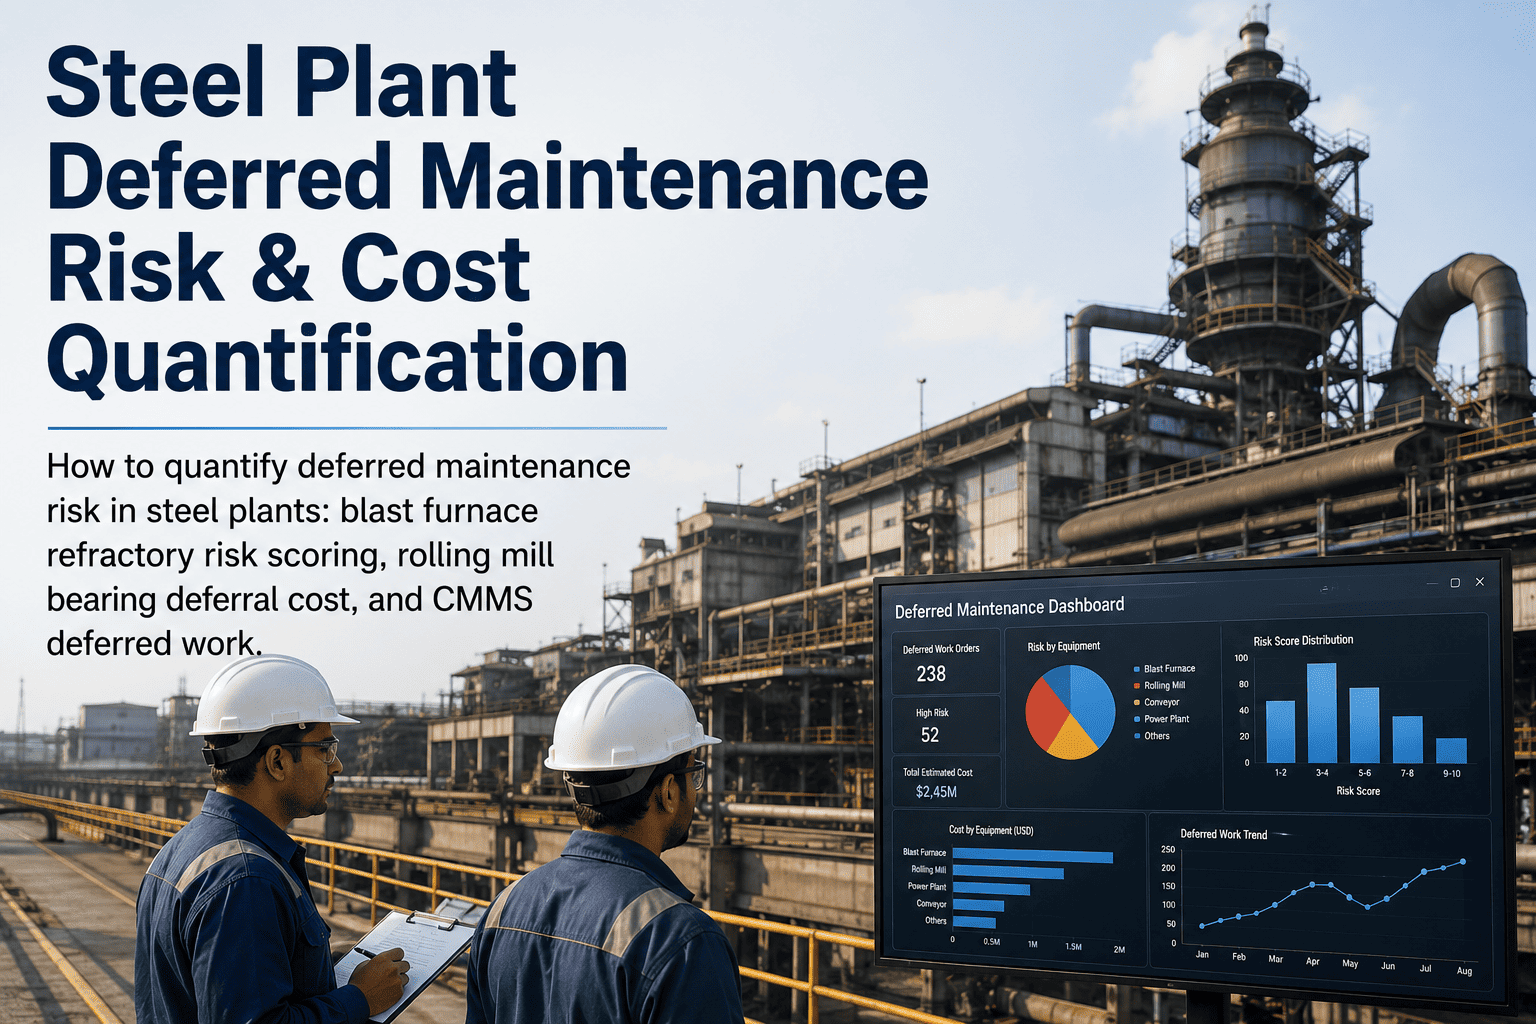
Deferred maintenance in a steel plant is rarely a single missed work order — it is a compounding backlog that builds quietly across blast furnaces, rolling mills, cranes, and utilities until a critical asset fails mid-campaign. A typical integrated mill carries between 8,000 and 14,000 open deferred work orders valued at $18M–$60M, yet most reliability teams cannot rank which deferrals threaten production next quarter. Quantifying that risk — by refractory wear state, bearing vibration trend, and CMMS aging buckets — turns an invisible liability into a defensible capital request. Start Start Free Trial to convert your backlog into a prioritized, costed risk register before the next outage decides for you.
Your deferred maintenance backlog has a price. Do you know what it is?
Every deferred work order on a blast furnace, rolling mill, or EAF carries a hidden risk premium — lost campaign days, emergency refractory spend, and unplanned downtime that costs 3–5x planned repair. Quantify it before a single failure forces the answer.
Why backlogs compound silently in steel operations
In an integrated steel plant, deferred maintenance accumulates at the intersection of campaign scheduling, capital constraints, and shift coverage — and it almost never self-corrects.
Campaign-driven deferment
Blast furnaces run 8–15 years between relines. Non-critical refractory, coiling, and utility repairs get pushed to the next blowdown — and quietly grow 12–18% per year as wear accelerates.
Aging CMMS work orders
Plants averaging 10K+ open work orders see 30% sit past 90 days. Each aged order raises failure probability and emergency-labor premium, especially on rolling-mill bearings and hydraulic packs.
Cost escalation curve
A deferred $12K bearing inspection becomes a $48K emergency changeout at 2 a.m. — plus 6–14 hours of lost production at $180K–$420K per hour on a hot strip mill.
From CMMS backlog to a costed risk register
Quantifying deferred maintenance risk means converting each open work order into three measurable dimensions: failure probability, production impact, and escalation cost.
Blast furnace refractory risk scoring
Model remaining refractory thickness by zone (bosh, belly, stack) using laser profiling, thermocouple trends, and shell-temperature deltas. Each zone receives a 1–5 risk score; zones above 3 trigger mandatory inclusion in the next reline scope — deferring them raises campaign-failure probability by 22–40%.
Rolling mill bearing deferral cost
Track RMS velocity, envelope acceleration, and temperature on stand bearings. A bearing past its L10 life with rising high-frequency impact signatures carries a 14% monthly failure probability — multiplied by 8–22 hours of unplanned downtime at $180K–$420K/hr on a hot strip mill.
CMMS deferred work aging buckets
Segment open work orders into 0–30, 31–90, 91–180, and 180+ day buckets. Orders past 180 days carry 4.6× the failure probability of fresh ones. Score each by criticality code (A/B/C) and current asset health index for a defensible prioritized list.
Utility & auxiliary system exposure
Cooling water pumps, hydraulic power units, and gas-cleaning plants rarely fail gracefully. A deferred seal or valve repair can cascade into a 4–12 hour furnace stop, blast stall, or slab-yard bottleneck — quantify these as conditional risk chains, not isolated work orders.
Deferral risk matrix for steel plant assets
Use this matrix to rank deferred work orders by quantified risk cost — the same logic OxMaint applies automatically to your CMMS backlog.
| Asset / System | Deferral Type | Failure Probability (12mo) | Downtime Exposure | Risk Cost (Annualized) |
|---|---|---|---|---|
| Blast furnace bosh refractory | Refractory repair deferred to reline | 18% | 72–240 hr campaign stop | $2.4M–$7.1M |
| Hot strip mill F3 stand bearing | Vibration-flagged bearing deferral | 32% | 8–22 hr unplanned | $1.4M–$3.9M |
| EAF water-cooled panel | Thermography finding deferred | 24% | 6–18 hr melt stop | $860K–$2.6M |
| Slab yard crane (charging) | Gearbox inspection past due | 12% | 12–48 hr bottleneck | $420K–$1.7M |
| Gas cleaning plant ID fan | Bearing lubrication deferral | 15% | 4–14 hr furnace back-draft | $310K–$1.1M |
A 180-asset plant turns $42K of deferrals into $3.8M of risk
Consider a mid-sized mini-mill running 180 critical assets. Its CMMS shows 2,400 open work orders; 312 are past 90 days with a combined planned cost of $42,000. The instinct is to defer further — the math says otherwise.
Once we scored our backlog by risk cost, the board approved $4.2M in catch-up maintenance in a single capital cycle — because the alternative was a $14M unplanned furnace stop.
How OxMaint turns deferrals into prioritized, costed action
Three computational methods work together to convert a raw CMMS backlog into a defensible risk register that plant managers, finance, and operations all trust.
Probability-of-failure modeling
Combines age-based Weibull curves with real-time condition indicators (vibration RMS, oil debris, thermography) to produce monthly P(failure) per asset — refreshed every shift.
Production impact mapping
Each asset is linked to a production line and bottleneck rate. Failure scenarios auto-calculate downstream tonnage loss, energy waste, and customer order penalty exposure.
Emergency cost escalation
Applies industry-validated escalation factors (2.8–5.1×) based on repair timing, labor availability, and spare-parts lead time — surfacing the true cost of "we'll fix it later."
Stop guessing. Start quantifying your steel plant maintenance risk.
See your deferred backlog scored, costed, and prioritized by risk in under 14 days — backed by ISO 55000-aligned methodology.
Steel plant deferred maintenance risk — answered
How is deferred maintenance risk different from routine maintenance backlog?
A backlog is a list of open work orders; deferred maintenance risk quantifies the financial and operational exposure of each deferral. It factors failure probability, production downtime cost, and emergency repair premium — so a $12K bearing deferral with $3.8M of downstream risk ranks higher than a $40K cosmetic repair. You can Start Free Trial to see your backlog auto-scored this way.
What data does OxMaint need to quantify blast furnace refractory risk?
The model ingests laser-thickness profiling runs, thermocouple temperature trends, shell-temperature deltas, and historical reline scope. Combined with campaign age and production rate, it produces a zone-level 1–5 risk score that flags which deferrals are safe until next reline and which threaten campaign continuity.
Can the framework handle both integrated mills and mini-mills (EAF)?
Yes. The risk quantification logic is asset-agnostic — it applies equally to blast furnaces, EAFs, rolling mills, casters, and utilities. Mini-mills typically see faster deferral cycles (EAF campaigns are shorter) and benefit from monthly risk re-scoring, while integrated mills benefit from annual campaign-aligned scoring.
How quickly can we see a quantified risk register from our existing CMMS?
Most plants see a first-pass risk register within 10–14 days of connecting their CMMS export. The system maps work orders to assets, applies condition data where available, and produces a prioritized list with annualized risk cost per deferral. Full integration with vibration and oil data typically completes in 30–45 days.
What ROI can a steel plant expect from quantifying deferred maintenance?
Plants that move from reactive to risk-prioritized deferral management typically cut unplanned downtime by 18–32% in the first year and reduce emergency repair spend by 22–40%. For a 2MTPA mill, that translates to $4M–$11M in avoided production loss — usually a 6–9 month payback on the platform. Book a Demo for a plant-specific estimate.
Turn your deferred maintenance backlog into a costed risk register
Join steel reliability teams using OxMaint to prioritize deferrals by real financial exposure — not gut feel or FIFO.
Free 14-day trial · No credit card