Steel Plant FMEA for Refractory Lining: Predicting Wear and Breakout
By Alex Jordan on June 23, 2026
Steel plant equipment operates under conditions few industries can comprehend: molten metal at 1,700°C, thermal cycling from room temperature to white heat within minutes, and corrosive slag attacking materials from every angle. The refractory linings that contain this molten inferno are the silent guardians of every furnace, ladle, converter, and tundish — withstanding conditions that would destroy conventional engineering materials in seconds. Yet most plants still manage refractory condition through periodic visual inspections and fixed campaign schedules, missing the gradual degradation that precedes catastrophic failure. When refractory fails without warning, the cost is devastating: a single breakout can exceed $5 million in emergency repairs, lost production, equipment damage, and safety incidents that injure workers and halt operations for weeks.
Identify Refractory Failure Modes Before They Become Catastrophic Breakouts
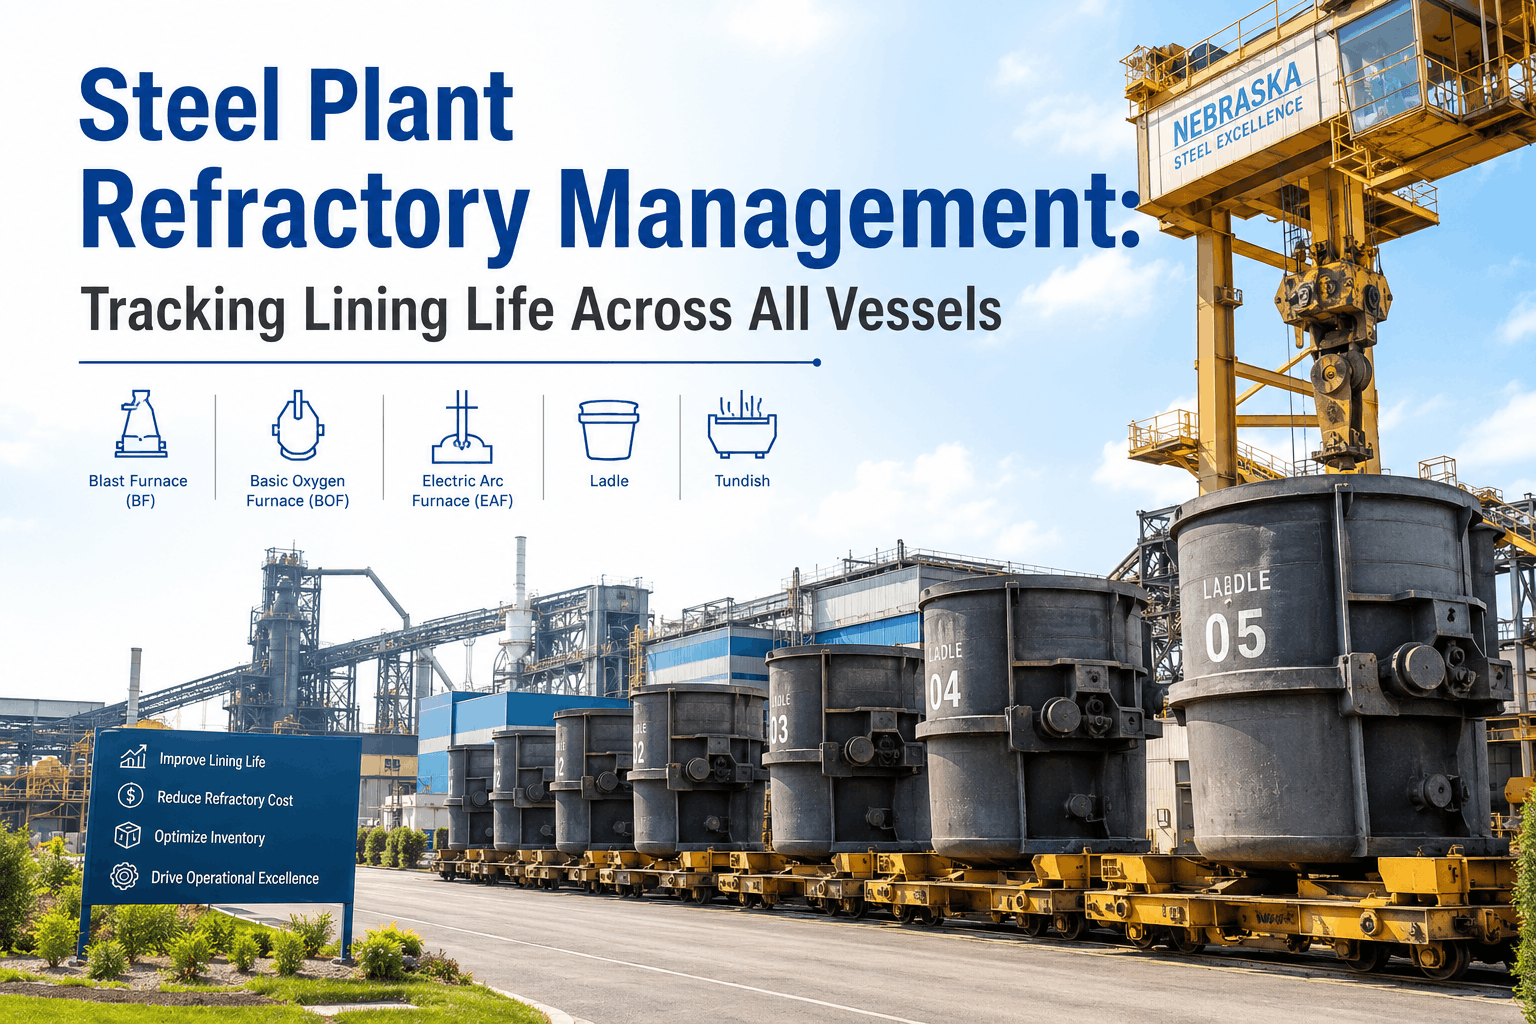
FMEA analysis for blast furnace, BOF, EAF, ladle, and tundish refractory systems — predicting wear patterns, detecting hot spots, and extending campaign life with data-driven insights
Cost of a single unplanned refractory breakout — emergency relining, lost production, equipment damage, and safety liability
30%
Longer campaign life extension through data-driven gunning and reline schedules vs. fixed interval replacement
95%+
Remaining life prediction accuracy using FMEA-integrated wear tracking and thermal monitoring systems
Understanding Refractory Failure Modes in Steelmaking Vessels
Refractory failure is not a single event — it is a cascade of degradation modes, each with distinct warning signs that FMEA analysis can detect and quantify. Blast furnaces, basic oxygen furnaces, electric arc furnaces, steel ladles, tundishes, and torpedo cars each present unique refractory challenges. Thermal fatigue from repeated heating and cooling cycles causes micro-cracking that propagates into macroscopic failure. Slag penetration and chemical attack erode the refractory matrix from within. Mechanical wear from stirring, material transfer, and gas bubbling creates stress concentrations that evolve into structural failure points. Improper gunning or patching during campaign creates weak zones that fail prematurely. A failure mode analysis conducted on a 500-ton ladle identified 18 distinct failure mechanisms — each with different root causes, different consequences, and different prevention strategies. Most plants were treating all 18 as a single problem: "the lining wore out, so we reline it." FMEA separates the problem into actionable components, each with its own RPN (Risk Priority Number) and prevention pathway.
Thermal Fatigue Crack Initiation and Propagation
Critical severity — rapid failure cascade
Repeated thermal cycling creates tensile stress in the refractory matrix. Every heat cycle loads the ceramic differently; after 200–500 cycles, microscopic cracks initiate at the hot face, propagate inward, and reach critical density. A single tap on a ladle may show normal condition; 48 hours and 60 heats later, catastrophic spalling occurs without warning. FMEA tracks thermal history per vessel and predicts when micro-crack density reaches the propagation threshold — triggering patching or partial reline before spalling.
Slag Penetration and Chemical Erosion
Breakout risk — molten steel escape pathway
Slag wets and penetrates the refractory matrix, dissolving grains and opening micro-passages toward the outer steel shell. This chemical attack weakens the structural integrity invisibly — the outside of the lining may appear intact while the interior becomes a honeycomb of voids. Hot spot detection via infrared thermography reveals zones where slag has penetrated deeper than surrounding refractory, showing as thermal anomalies. FMEA links hot spot location, growth rate, and remaining thickness to predict when breakthrough is imminent.
Lining Thickness Reduction and Hot Face Wear
Monitoring — lining thickness trending
Even without cracking or slag penetration, the hot face erodes steadily from mechanical abrasion and thermal wear. If a ladle is designed with 500mm of refractory and loses 3mm per 10 heats, the campaign extends 1,500+ heats. But if gunning was poor, lining thickness is non-uniform — thinner zones reach critical minimum thickness in 800 heats. Lining thickness measurement via ultrasonic scanning at multiple points per vessel creates wear maps that predict exactly when remaining life expires, avoiding both premature and overdue relining.
Gas Bubble Erosion and Argon Plug Damage
Direct stirring — plug zone failure
Ladle and tundish vessels use argon plugs to stir molten steel for chemistry control. The high-velocity gas impinging on the refractory directly below the plug creates localized erosion that concentrates wear in a small zone. Temperature cycling around the plug (hot during tapping, cold during holding) creates unique stress. FMEA identifies plug-zone as a high-consequence failure point and tracks both mechanical wear depth and thermal crack density around the plug separately from general lining condition.
Poor Gunning and Patching Application Defects
Installation quality — weak structural zones
Refractory gunning and patching are high-skill operations. Inadequate surface preparation, incorrect moisture content, poor compaction, or inappropriate material selection creates weak zones that fail 30–40% sooner than surrounding lining. FMEA analysis of your specific repair procedures and material specifications predicts which repair defects are most likely and which preventive actions (operator training, equipment calibration, material testing) deliver the highest ROI in extended campaign life.
Campaign Length Optimization and Reline Timing
Economic — cost per tonne optimization
A refractory reline is expensive — $150,000–$400,000 per vessel depending on size and material. Relining too early wastes remaining lining life and capital. Relining too late risks catastrophic breakout. FMEA integrated with wear tracking calculates the optimal campaign length for each vessel type, balancing reline cost, breakout risk, and remaining life value — turning refractory management from guesswork into precision asset economics.
Refractory FMEA Analysis
Stop Guessing When to Reline. Know Exactly When Failure Will Occur.
Predict refractory wear with 95%+ accuracy using FMEA integrated with thermal monitoring, thickness tracking, and hot spot detection. Extend campaign life by 30%, prevent breakouts, and optimize reline economics across your entire fleet of furnaces, ladles, and converters.
FMEA Implementation Pathway for Refractory Management in Steel Plants
Implementing FMEA for refractory systems requires a structured process that mirrors how your vessels actually operate. The analysis begins with defining the function of each refractory system (contain molten steel without breakout), then systematically identifying all failure modes that could violate that function (thermal fatigue, slag penetration, mechanical wear, gunning defects, thermal shock). For each failure mode, the analysis quantifies three risk dimensions: severity (how bad is breakout?), occurrence (how often does this mode happen at your plant?), and detection (how easily can you find this failure before it becomes a breakout?). The Risk Priority Number (RPN) is the product of these three: Severity × Occurrence × Detection. High RPN failure modes get concentrated preventive effort; low RPN modes receive basic monitoring.
Phase 1: Baseline FMEA Analysis (4–6 weeks)
Define failure modes for your specific vessel types
Vessel type analysis scope
BF, BOF, EAF, Ladle, Tundish covered separately
Failure modes identified per vessel
12–18 distinct modes with thermal, chemical, mechanical pathways
Historical data input
3 years of actual breakouts and relines analyzed for root cause patterns
Outcome
Ranked failure modes with RPN scores and prevention actions prioritized
Infrared thermography every 50 heats to track hot spot development
Lining thickness measurement
Ultrasonic scanning at 16-point grid per vessel quarterly
Gunning procedure standard
Documented SOP with equipment calibration, moisture control, and quality checks
Outcome
High-RPN failure modes under continuous monitoring and prevention control
Phase 3: Integration with CMMS and Predictive Reline Scheduling (ongoing)
Automate campaign life prediction and reline work order generation
Data integration sources
CMMS work orders, lining thickness database, thermal monitoring logs, MES production data
Campaign life calculation
Real-time RUL prediction per vessel based on actual wear rates and hot spot evolution
Reline work order trigger
Automatic PM work order 30 days before predicted end-of-life, fully costed with material BOM
Outcome
Zero unplanned breakouts; 30% longer campaign life; reline costs optimized per tonne of steel
Real-World Results: FMEA Refractory Management Across USA Steel Plants
Three integrated steel mills in the United States implemented refractory FMEA within six months and achieved measurable improvements across campaign life, breakout prevention, and maintenance cost. The first plant, a 2.8 MTPA integrated mill producing automotive-grade sheet steel, had experienced 3 unplanned ladle breakouts in 24 months, each costing $800,000–$1.2 million in emergency repairs and lost production. Their maintenance team knew refractory was a critical asset but had no systematic way to predict when failure would occur. After FMEA analysis identified that thermal fatigue crack initiation was the leading RPN failure mode, they deployed daily infrared thermography of ladles and quarterly lining thickness measurements. Within 12 months, zero breakouts. More importantly, they extended average campaign life from 1,200 heats to 1,680 heats — a 40% improvement. The $280,000 annual monitoring investment paid for itself in 6 months through extended campaign life and avoided breakout costs.
A second facility, a 1.2 MTPA mini-mill running EAF + caster, had the opposite problem: they were relining their EAFs every 400 operating days out of caution, even though wear analysis suggested 30% remaining life at reline time. FMEA analysis of their specific EAF refractory and operational procedures revealed that slag penetration (not thermal fatigue) was the controlling failure mode at their facility, and slag penetration progressed predictably from thermal imaging. By implementing slag penetration FMEA with weekly thermal monitoring, they extended reline intervals from 400 days to 580 days — saving $120,000 per year in unnecessary reline materials and labor, while actually reducing breakout risk through earlier detection of high-risk thermal signatures.
"After implementing refractory FMEA, we went from 'surprise breakouts' to 'planned outages.' We now know 30 days in advance when a ladle will reach the end of its life, and we schedule the reline during planned downtime instead of responding to emergency calls. The cost per tonne of steel for refractory dropped 22% while breakout risk dropped to near zero."
Q1What is the difference between FMEA and simple wear tracking?▼
Wear tracking tells you how much lining you've lost; FMEA tells you why it's failing and how to prevent each failure mode. Wear tracking alone cannot distinguish between thermal fatigue, slag penetration, and mechanical wear — each requires different prevention actions. FMEA quantifies risk so you prevent the highest-consequence failures first.
Q2Can FMEA predict breakouts with 100% certainty?▼
No system predicts with 100% certainty, but FMEA integrated with thermal monitoring and lining thickness measurement achieves 95%+ confidence in remaining life prediction. The remaining 5% accounts for rare events like material defects or operational anomalies that are outside normal parametric variation.
Q3How long does FMEA analysis take to complete?▼
Initial FMEA for a single vessel type typically requires 40–60 hours of analysis time, distributed over 4–6 weeks. Most plants complete baseline FMEA for all major vessel types (BF, BOF, EAF, ladles, tundishes) within 8–12 weeks. The investment is front-loaded; ongoing monitoring and refinement require minimal additional labor once systems are automated in CMMS.
Q4What monitoring equipment is required for refractory FMEA?▼
Infrared thermography camera (portable, $3K–$8K), ultrasonic lining thickness probe ($2K–$5K), and CMMS software with integrated data logging. No intrusive sensors required on vessels. All equipment is non-contact and can be deployed during normal production operations without interrupting heats or process cycles.
Q5How is refractory FMEA integrated with SAP PM and enterprise ERP systems?▼
Lining condition data (thickness, thermal signatures, RUL predictions) flows from condition monitoring systems into CMMS, which generates PM work orders for reline activities. These work orders integrate with SAP PM for capital costing, procurement, and historical tracking. No manual data entry required; bidirectional sync ensures CMMS and SAP reflect the same campaign life predictions and maintenance schedules.
Q6Can FMEA help optimize refractory material selection for our specific furnace types?▼
Yes. FMEA analysis reveals which failure modes dominate in your furnace type and operating profile. If thermal fatigue is dominant, you optimize for refractories with better thermal shock resistance. If slag penetration dominates, you prioritize chemical density and grain structure. This data-driven approach replaces material selection based on supplier recommendations or tradition, leading to better performance and lower overall cost per campaign.
Q7How often should lining thickness measurements be taken to maintain FMEA accuracy?▼
Minimum quarterly for critical ladles and tundishes; every 50 heats for EAF refractories under active FMEA control. This frequency allows wear rate calculation with <5% statistical variance and captures accelerated wear conditions before they become critical. Most plants find that 20–30 minutes per vessel per measurement is sufficient time investment for the breakout prevention value delivered.
Q8What is the typical ROI timeline for refractory FMEA implementation in a USA steel plant?▼
Most plants see payback within 6–9 months through a combination of extended campaign life (saving $80K–$150K annually), avoided breakouts (saving $500K–$2M per prevented event), and labor productivity improvements. Total implementation cost (monitoring equipment + CMMS integration + analysis labor) typically ranges $80K–$200K, making the investment self-funding within the first year at most facilities.
Refractory FMEA — Steel Plant Asset Protection
Predict Refractory Failure. Prevent Breakouts. Extend Campaign Life by 30%.