Steel Plant Maintenance KPIs: MTBF, MTTR, OEE & Availability

By James smith on March 19, 2026

steel-plant-maintenance-kpis-mtbf-oee

A steel plant maintenance department that does not measure the right things does not improve — it changes. There is an important difference. Changing means adjusting practices in response to the most recent event: a bearing failed, so now we check bearings more often. Improving means moving a measurable indicator in a direction that reflects systematic change in the underlying process: MTBF on rolling mill bearings increased from 2,400 hours to 3,800 hours over 18 months because PM compliance on lubrication tasks went from 61% to 94%. The first produces reactive adaptation. The second produces compounding performance. Start tracking your steel plant KPIs in Oxmaint free — the dashboard is live from day one of deployment.

This guide covers the eight maintenance KPIs that top-quartile steel plants track consistently, what each measures, what the world-class benchmark is for integrated mills and EAF operations, and how Oxmaint calculates each metric automatically from work order and asset data without manual reporting effort. Book a session to review your current KPI baseline against global benchmarks with Oxmaint's steel analytics team.

8
Essential KPIs
Every steel plant should track monthly — from MTBF and OEE to PM compliance and cost per tonne
88%+
Planned ratio benchmark
World-class integrated mills sustain 88–92% planned maintenance ratio — industry average is 58–64%
Zero
Manual compilation
Oxmaint calculates all eight KPIs automatically from work order and asset data — no spreadsheet exports

The Eight KPIs That Define World-Class Steel Maintenance

Each KPI below includes the formula, the world-class benchmark for steel operations, the typical baseline at facilities without structured measurement, and how Oxmaint calculates the metric automatically. The gap between the baseline and benchmark is the measurable value your maintenance program can capture. Sign in to Oxmaint to see your current position on each of these metrics against the global steel benchmark dataset.

MTBF
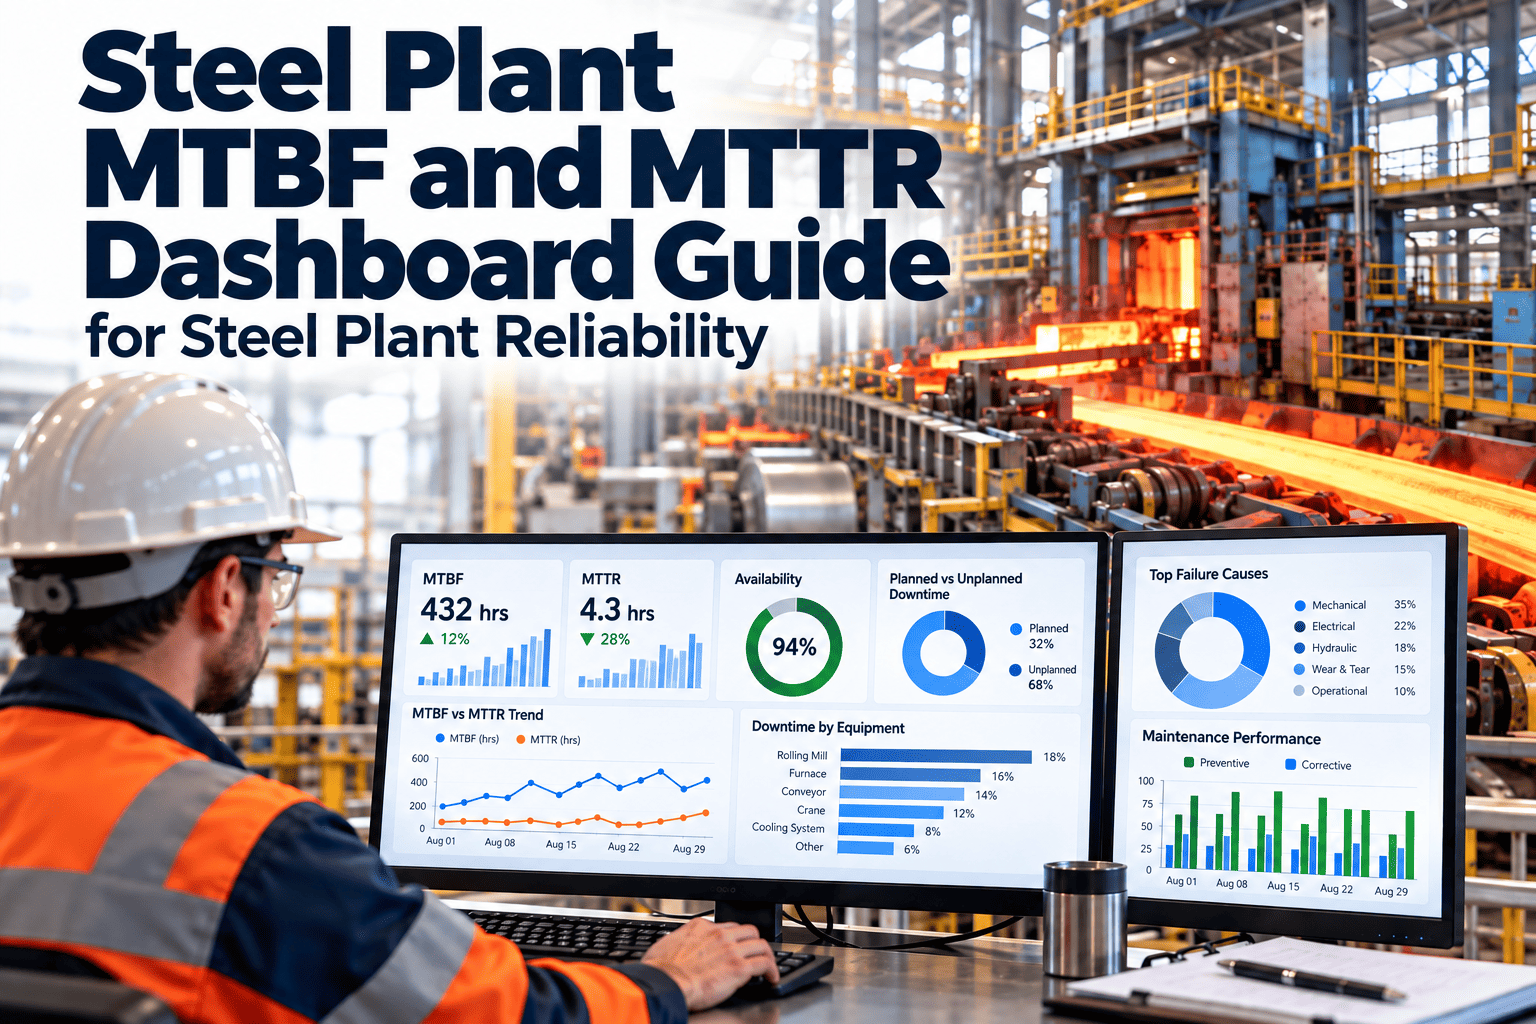
Mean Time Between Failures
Formula
Total operating hours ÷ Number of failures in period
Industry Average
1,800–2,400 hrs

World-Class Target
4,200–6,800 hrs

MTBF measures how long equipment runs on average between unplanned failures. For a rolling mill main drive bearing, the difference between 2,400-hour and 5,600-hour MTBF represents two additional unplanned stops per year — each costing $40,000–$120,000 in emergency repair and production loss.

Oxmaint Calculates Automatically from work order timestamps — failure open date minus previous failure close date per asset. MTBF trend per asset system displayed on reliability dashboard, updated as each work order closes.
MTTR
Mean Time To Repair
Formula
Total repair hours ÷ Number of repairs completed in period
Industry Average
6.8–9.4 hrs

World-Class Target
2.4–3.8 hrs

MTTR measures repair speed — the time from failure detection to restored operation. High MTTR often reflects parts availability problems, unclear repair procedures, or permit and access delays rather than technician skill gaps. Reducing MTTR from 8 hours to 3.5 hours on a continuous caster component recovers 4.5 hours of production per event.

Oxmaint Calculates From work order open timestamp (failure detected) to work order close timestamp (returned to service). Broken down by area, asset class, and failure mode — enabling targeted MTTR improvement by identifying the longest-delay failure types.
OEE
Overall Equipment Effectiveness
Formula
Availability % × Performance % × Quality % = OEE %
Industry Average
58–68%

World-Class Target
82–88%

OEE is the primary production-maintenance integration metric. It makes maintenance impact visible in production terms — moving OEE from 65% to 83% on a hot strip mill producing 1.2 million tonnes per year represents an additional 216,000 tonnes of production capacity without capital investment. Maintenance's contribution to that improvement is through availability — reducing unplanned stops and scheduled maintenance duration.

Oxmaint Calculates Availability component from planned production time minus downtime event records. Oxmaint integrates with MES for performance and quality components, or accepts manual production data entry. OEE displayed per production line per shift with trend charts.
PMC
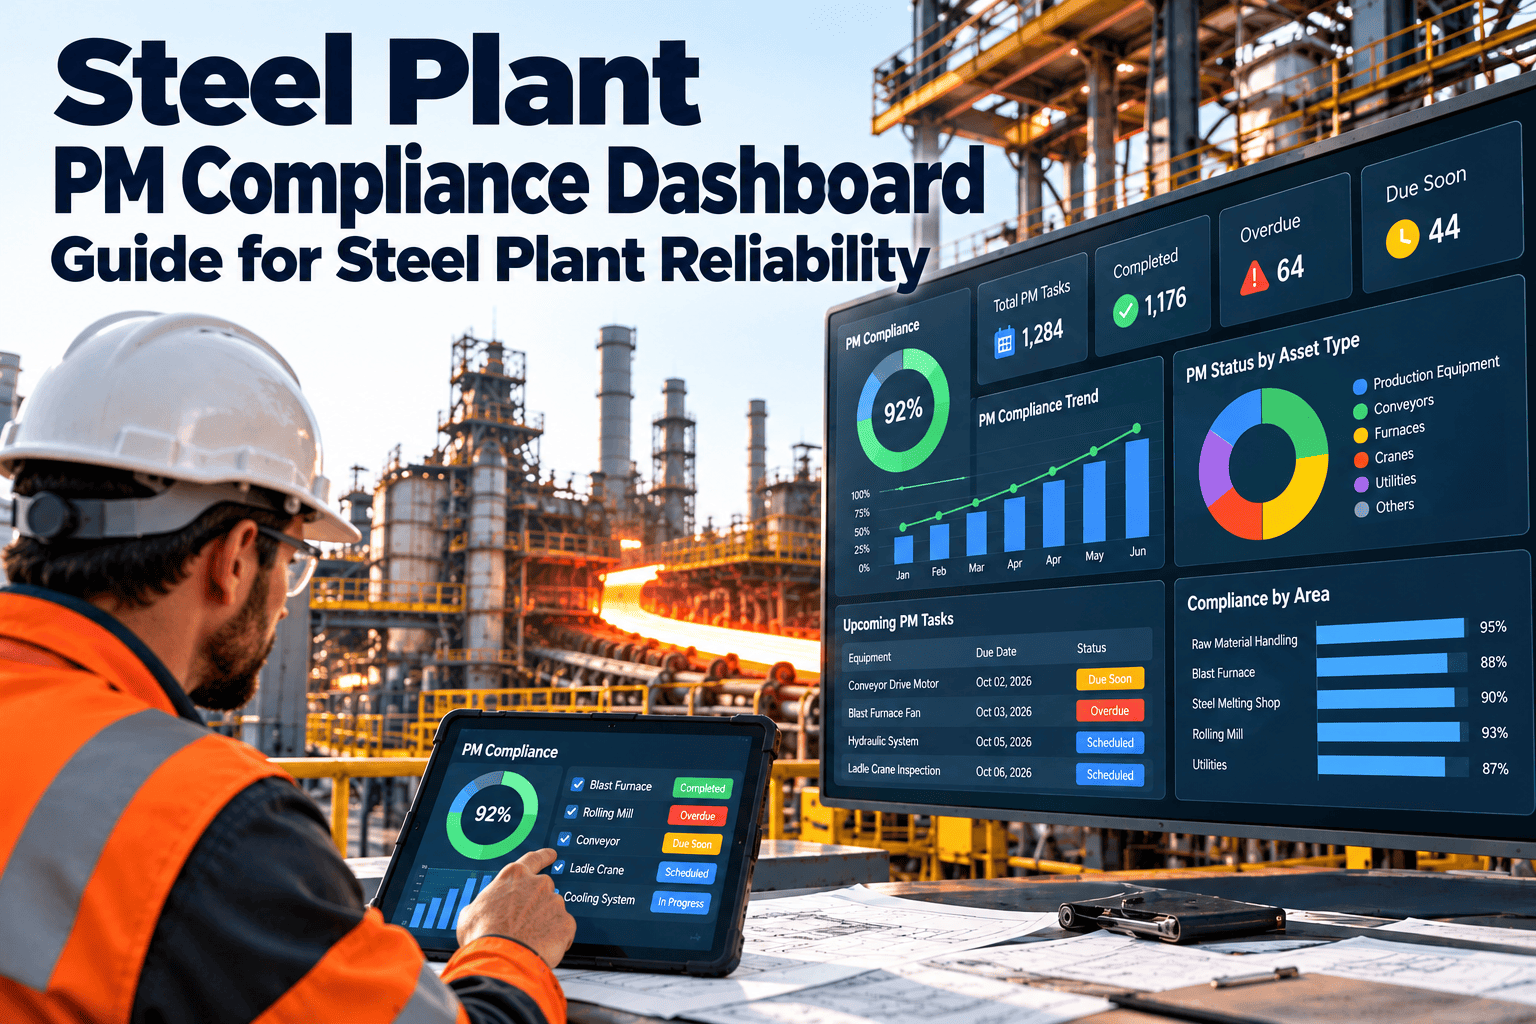
PM Compliance Rate
Formula
PMs completed on schedule ÷ Total PMs due in period × 100
Industry Average
62–74%

World-Class Target
92–96%

PM compliance is the leading indicator of all other maintenance KPIs. MTBF improves because PMs are being done. OEE improves because equipment is maintained to design condition. The 30-point gap between industry average (68%) and world-class (94%) is the single biggest cultural and operational differentiator between top-quartile and average steel maintenance operations.

Oxmaint Calculates In real time — PM compliance updates as each scheduled work order closes or its due date passes without completion. Compliance shown by area, shift, and technician. Deferred PMs tracked separately with deferral reason and cumulative risk score.
PMR
Planned Maintenance Ratio
Formula
Planned work order hours ÷ Total maintenance hours × 100
Industry Average
54–64%

World-Class Target
88–92%

Planned maintenance ratio measures what fraction of your maintenance effort was scheduled in advance versus forced by failure. A facility with 60% planned ratio is spending 40% of its maintenance budget on reactive work that costs 3–5× more per hour than planned work. Moving from 60% to 88% planned ratio on a typical 50-person maintenance team reduces total labor cost by $280,000–$480,000 annually without any headcount change.

Oxmaint Calculates From work order type classification — each work order is tagged as planned, condition-based, or reactive at creation. Planned ratio trends by month show the impact of PM program improvements and are the primary KPI displayed on the maintenance leadership dashboard.
AVL
Equipment Availability
Formula
(Total operating time − Downtime) ÷ Total operating time × 100
Industry Average
82–88%

World-Class Target
94–97%

Availability is tracked separately from OEE to isolate the maintenance contribution from speed and quality losses. For a continuous caster, each 1-point improvement in availability at 180 tonnes per hour production rate and $420 per tonne slab price represents $756,000 of additional annual output. Availability is the maintenance KPI that boards and operations directors understand immediately.

Oxmaint Calculates From downtime event records — each downtime entry captures start time, end time, cause code, and asset affected. Availability is calculated per asset, per production line, and per area, with drill-down to the specific failure modes consuming the most availability hours.
CPT
Maintenance Cost Per Tonne
Formula
Total maintenance cost (period) ÷ Production tonnes (same period)
Industry Average
$22–$34/tonne

World-Class Target
$12–$18/tonne

Cost per tonne is the maintenance efficiency metric that connects maintenance performance directly to steel product economics. At $28/tonne vs. $15/tonne on 2 million tonnes of annual production, the gap is $26 million per year. This KPI normalises maintenance cost to production volume — it exposes when a maintenance cost reduction is actually accompanied by production improvement, or when apparent cost reduction is just deferred maintenance accumulating as reliability risk.

Oxmaint Calculates By summing all work order costs (labor, parts, contractors) in the period and dividing by production tonnes from the MES integration or manual entry. Displayed with rolling 12-month trend and comparison against AIST global benchmark range for your facility type.
WTM
Wrench Time (Technician Utilisation)
Formula
Active repair hours ÷ Total available technician hours × 100
Industry Average
24–28%

World-Class Target
50–58%

Wrench time — the fraction of a technician's shift spent performing actual repair work — is the most undertracked KPI in steel plant maintenance. At 26% industry average, a 50-person maintenance team is producing the equivalent of 13 people's productive output. Doubling wrench time to 52% through digital work orders, pre-kitted parts, and mobile permit management is operationally equivalent to hiring 13 additional technicians with no incremental labor cost.

Oxmaint Calculates From work order active time tracking on the mobile app — technicians log travel, waiting, and active repair stages. Aggregate wrench time is reported by team and shift. The gap between available hours and active hours identifies the highest-value waste categories to target first.
All eight KPIs are live in Oxmaint from day one — no configuration required beyond deploying your asset register and starting work orders. The dashboard compares your facility against the global steel benchmark dataset automatically.

Reactive vs. World-Class: Where Your Operation Likely Sits Today

Before a CMMS is deployed, steel plant maintenance KPIs are rarely measured with precision — planned ratio is estimated at 70% when it is actually 56%, PM compliance is assumed at 80% when it is actually 61%. The following comparison shows the full KPI profile of a reactive-dominant steel operation versus a world-class operation, and what the economic gap between them represents in concrete terms for a typical 2 MTPA facility. Sign in to Oxmaint to generate your actual KPI baseline report within the first week of deployment.

KPI Reactive Operation Industry Average World-Class Target Economic Gap at 2 MTPA
MTBF (rolling mill drives) 1,200–1,800 hrs 2,400 hrs 5,600 hrs 4–6 additional unplanned stops/year × $80K avg = $320K–$480K
MTTR (critical assets) 9–14 hrs 7.2 hrs 3.2 hrs 4+ hrs per event × 20 events/year × $90K/hr = $7.2M
OEE (hot strip mill) 52–60% 65% 85% 20 OEE points × 1.2M t capacity × $420/t margin = $100M+
PM Compliance 40–55% 68% 94% Primary driver of MTBF gap — compliance improvement pays for CMMS within 90 days
Planned Maintenance Ratio 30–48% 60% 90% 40-point improvement × $480K reactive premium × 40% = $192K/year direct saving
Maintenance Cost per Tonne $38–$52/t $28/t $15/t $13/t gap × 2M tonnes = $26M annual maintenance efficiency opportunity

Swipe horizontally on smaller screens · Economic gaps are indicative at 2 MTPA integrated mill scale. Actual values depend on product mix, energy costs, and order book.

Frequently Asked Questions

How quickly can Oxmaint establish a KPI baseline when there is no existing structured data?
Oxmaint begins generating KPI data from the moment the first work order is created. The first meaningful baseline — planned maintenance ratio, PM compliance rate, and average MTTR — is typically available within 30 days of deployment on the top-200 critical assets. MTBF requires 60–90 days of operation to calculate reliably for assets with infrequent failure modes. Cost per tonne requires the MES integration or manual production data entry to be active. Most facilities have a meaningful 5-of-8 KPI baseline within the first 45 days, which is sufficient to establish the starting point for improvement tracking. Start Oxmaint free and your KPI dashboard begins building from day one.
What is the most important single KPI to improve first in a steel plant with no existing KPI program?
PM compliance. It is the leading indicator for all other maintenance KPIs, it is the fastest to improve (results visible within 60–90 days), and it is the one metric that most clearly shows whether the maintenance program is proactive or reactive. A plant moving PM compliance from 62% to 88% within 90 days will see MTBF beginning to improve at 6 months, planned maintenance ratio improving at 3 months, and MTTR improving at 4 months. Every other KPI follows PM compliance as a lagging indicator. Book a session to review your current PM compliance baseline and identify the highest-value improvement actions.
Should KPIs be tracked at plant level or broken down by production area?
Both — but area-level tracking is significantly more actionable. A plant-level planned ratio of 75% can hide the fact that the blast furnace area is at 88% while the utility systems are at 52%. The improvement actions for each area are completely different. Oxmaint displays every KPI at plant, area, asset system, and individual asset level simultaneously, allowing maintenance directors to see the aggregate number that management wants while drilling into the area-level data that tells them where to focus improvement effort. The area comparison view often produces the most productive conversations with operations, because it shows the rolling mill team their performance relative to the casting team using the same metrics and methodology.
How does Oxmaint handle KPI reporting for management — does it produce the right format for a board-level maintenance review?
Yes. Oxmaint's executive KPI report presents the eight core metrics in a single-page format designed for operations and maintenance leadership reviews — trend charts showing 12-month trajectory, benchmark comparison against global steel industry data, and a focused exception summary highlighting the 3 metrics furthest from target with the highest economic impact. The report exports to PDF in one click and is designed to be the primary input to a monthly maintenance leadership meeting, replacing the 3-hour manual spreadsheet compilation that most facilities currently use to produce the same information. Sign in to Oxmaint to see the executive KPI report template configured for your facility type.

Start Tracking All Eight KPIs From Day One

Oxmaint calculates MTBF, MTTR, OEE, PM compliance, planned ratio, availability, cost per tonne, and wrench time automatically from your work order and asset data — no spreadsheet exports, no manual compilation, no waiting for month-end to see where you stand.

Share This Story, Choose Your Platform!