Most steel plants can say how many preventive maintenance tasks were scheduled last month. Far fewer can say which departments fell behind, which asset classes were skipped or whether the missed tasks were on critical equipment. A PM compliance dashboard closes that gap. It turns raw work order data into a picture that reliability engineers, maintenance managers and plant leaders can act on, and it works best when the data comes from a single system such as Oxmaint maintenance software.
What PM compliance actually measures
PM compliance is the share of scheduled preventive tasks that were completed within an agreed window. The definition sounds simple, but results depend on choices the plant has to make.
- Decide the window. Many plants allow a grace period, such as a percentage of the interval, before a task counts as late.
- Decide what counts as complete. A task closed without findings, readings or sign-off should not count.
- Decide what counts as due. Deferred tasks that were formally approved should be shown, not hidden.
- Apply the same rules to every department, so comparisons are fair.
Compliance, adherence and completion are different measures
Dashboards often mix these terms. Separating them prevents arguments in review meetings.
| Measure | Question it answers | Typical use |
|---|---|---|
| PM compliance | Were due tasks done inside the window? | Headline health of the PM programme |
| Schedule adherence | Were tasks done on the planned day and shift? | Planner and supervisor performance |
| PM completion | Were tasks done at all, even late? | Backlog and catch-up planning |
| Overdue age | How long have open tasks been past due? | Risk from long-neglected equipment |
| PM effectiveness | Did the task prevent failures or find defects? | Task content review |
Why steel plants need more than one overall number
A single plant-wide percentage hides the problem. A blast furnace pump and a canteen fan can both sit inside the same average.
Continuous processes
Furnaces, casters and rolling mills cannot always stop for PMs. Tasks depend on outage windows, so compliance must be read against the shutdown calendar.
Harsh conditions
Heat, dust, scale and water raise wear rates. Missed tasks on such equipment cost more than the same miss in a mild area.
Many trades and areas
Mechanical, electrical, instrumentation and utilities teams have different loads and different backlogs. One average blurs all of them.
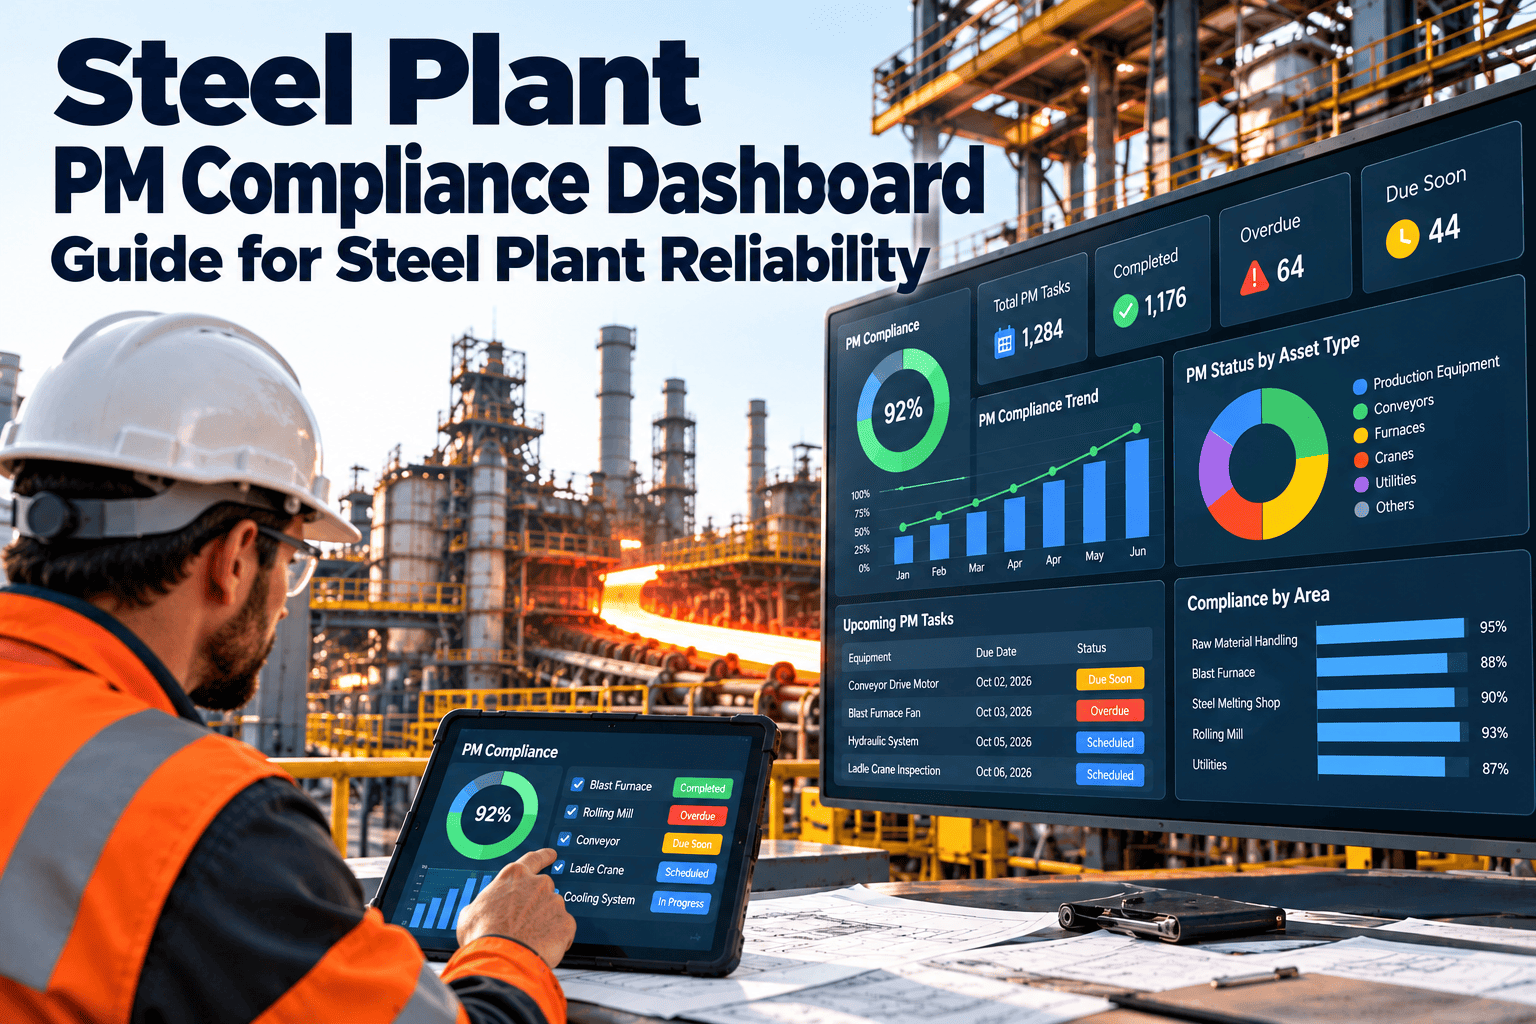
The views every PM compliance dashboard should include
By department or trade
Shows where labour is short or where planning is weak. Use trends over several months, not one bad week.
By asset class
Compare pumps, motors, gearboxes, conveyors, cranes, valves, electrical rooms and so on, to find neglected equipment types.
By criticality
Split results into critical, important and general assets. Compliance on critical equipment should be reviewed first.
Overdue aging
Group open tasks into age bands, such as up to a week, up to a month and older than a month.
By plant area or production line
Helps production managers see maintenance risk in their own area, in their own terms.
A criticality and compliance matrix
Combine criticality with compliance to decide where leadership attention should go.
Put all of your PM data on one live dashboard
Use Oxmaint to schedule preventive work, record completion and view compliance by department, asset class and criticality in one place.
Reading a low score: common root causes
A poor number is a prompt to investigate, not to blame. Check these causes before judging a team.
| Pattern on the dashboard | Likely cause | What to check |
|---|---|---|
| Low across one department only | Staffing gap or unplanned work crowding out PMs | Labour hours available against PM load |
| Low on one asset class | Poor access, missing parts or unclear task steps | Job plans, spares and isolations |
| Low on production-critical lines | No shutdown window given for the task | Outage calendar and task grouping |
| Sharp drop after a breakdown period | Reactive work displaced planned work | Backlog trend and emergency work share |
| Score high but failures continue | Tasks closed without real inspection | Completion quality and PM task content |
| Seasonal dips | Contractor availability or annual shutdown clashes | Resource plan by month |
Guarding against inflated compliance
Compliance can look good while maintenance quality is poor. Build safeguards into the dashboard.
Weak practice
- Closing tasks in bulk at month end
- Counting a task done with no readings
- Rescheduling overdue tasks to reset the clock
- Excluding difficult assets from the report
Stronger practice
- Require checklists, readings or photos for closure
- Keep original due dates when work is rescheduled
- Report deferred tasks with an approval reason
- Audit a sample of closed PMs each month
Connecting PM compliance to reliability results
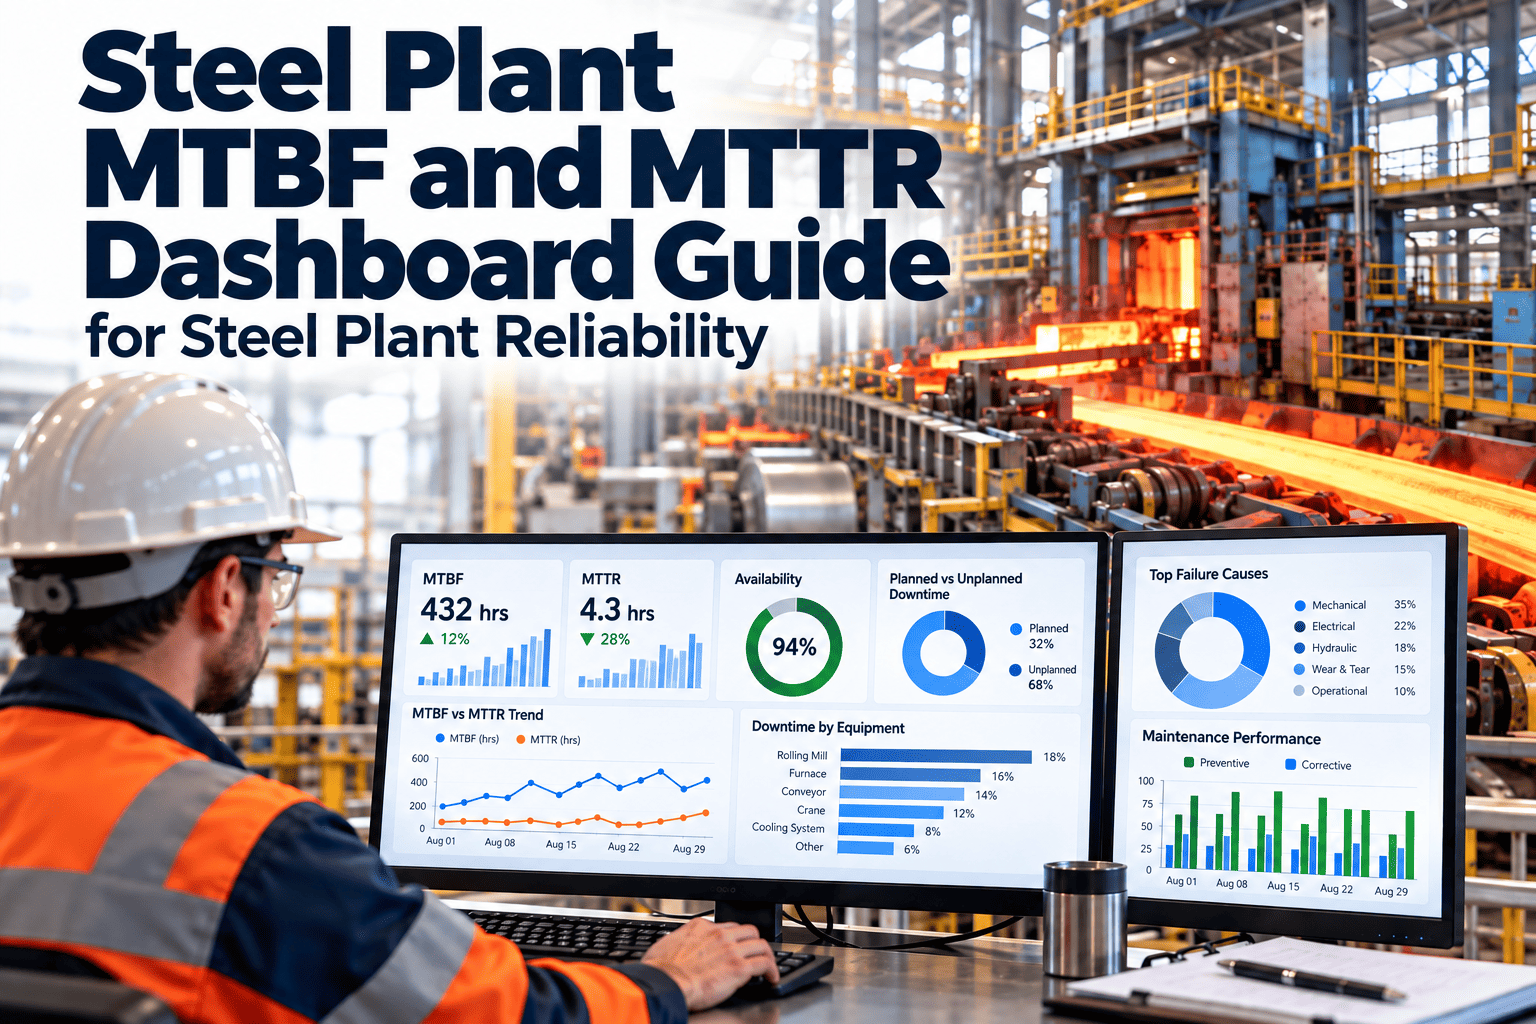
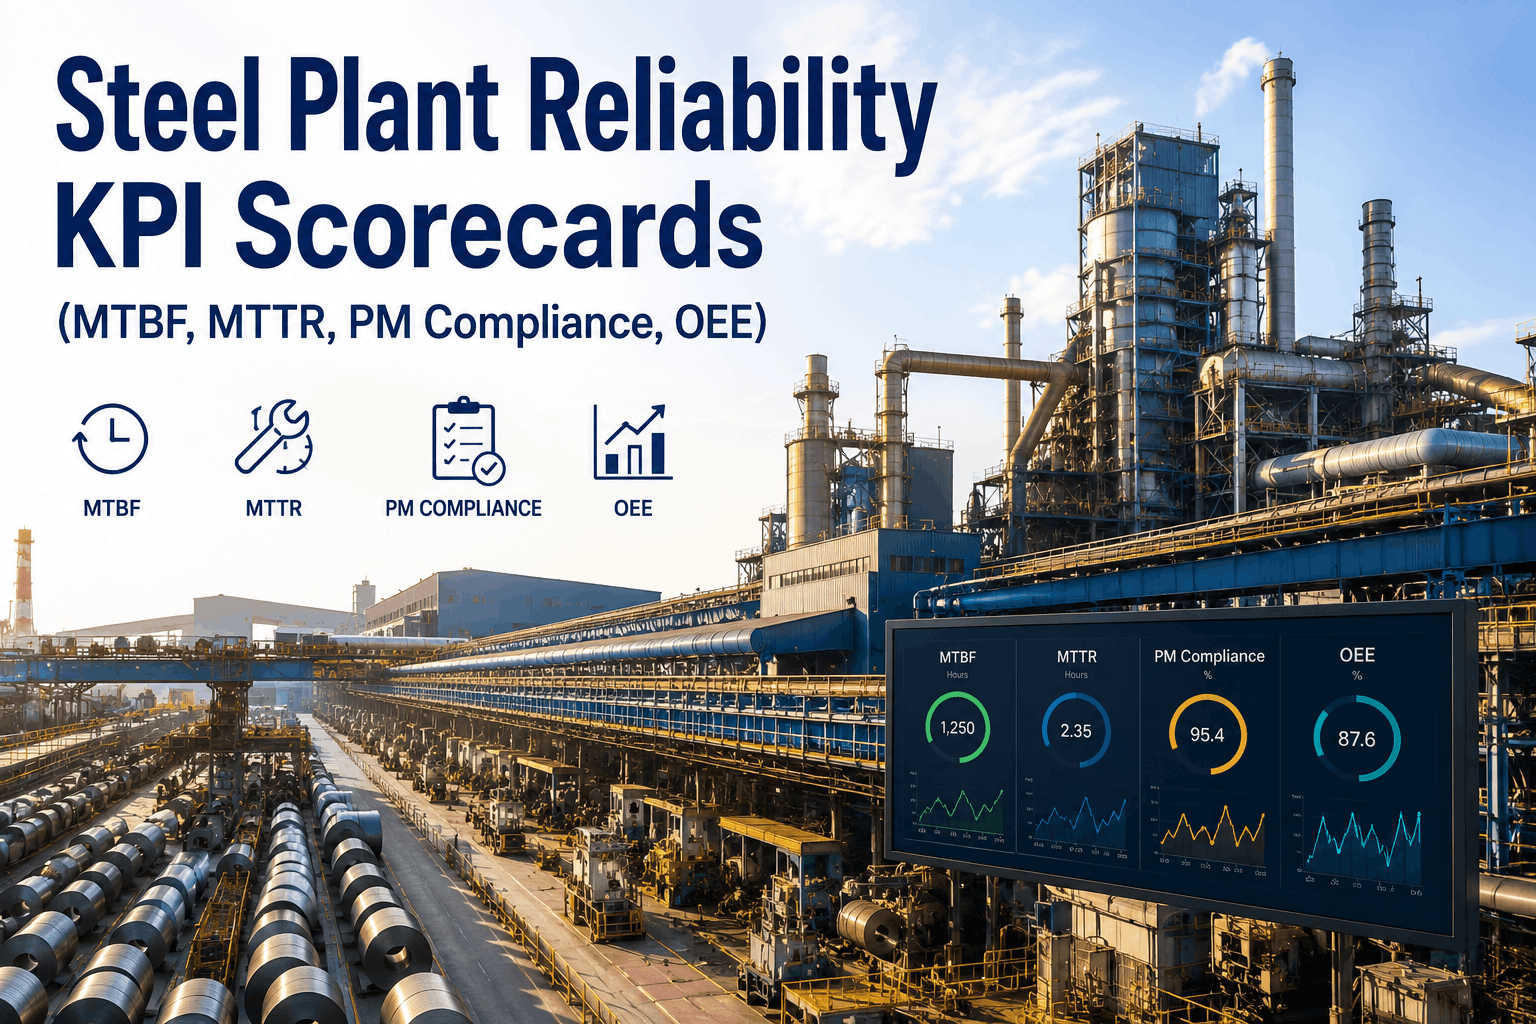
Compliance is a lead indicator. Its value appears when you connect it with outcomes such as MTBF, MTTR and breakdown counts.
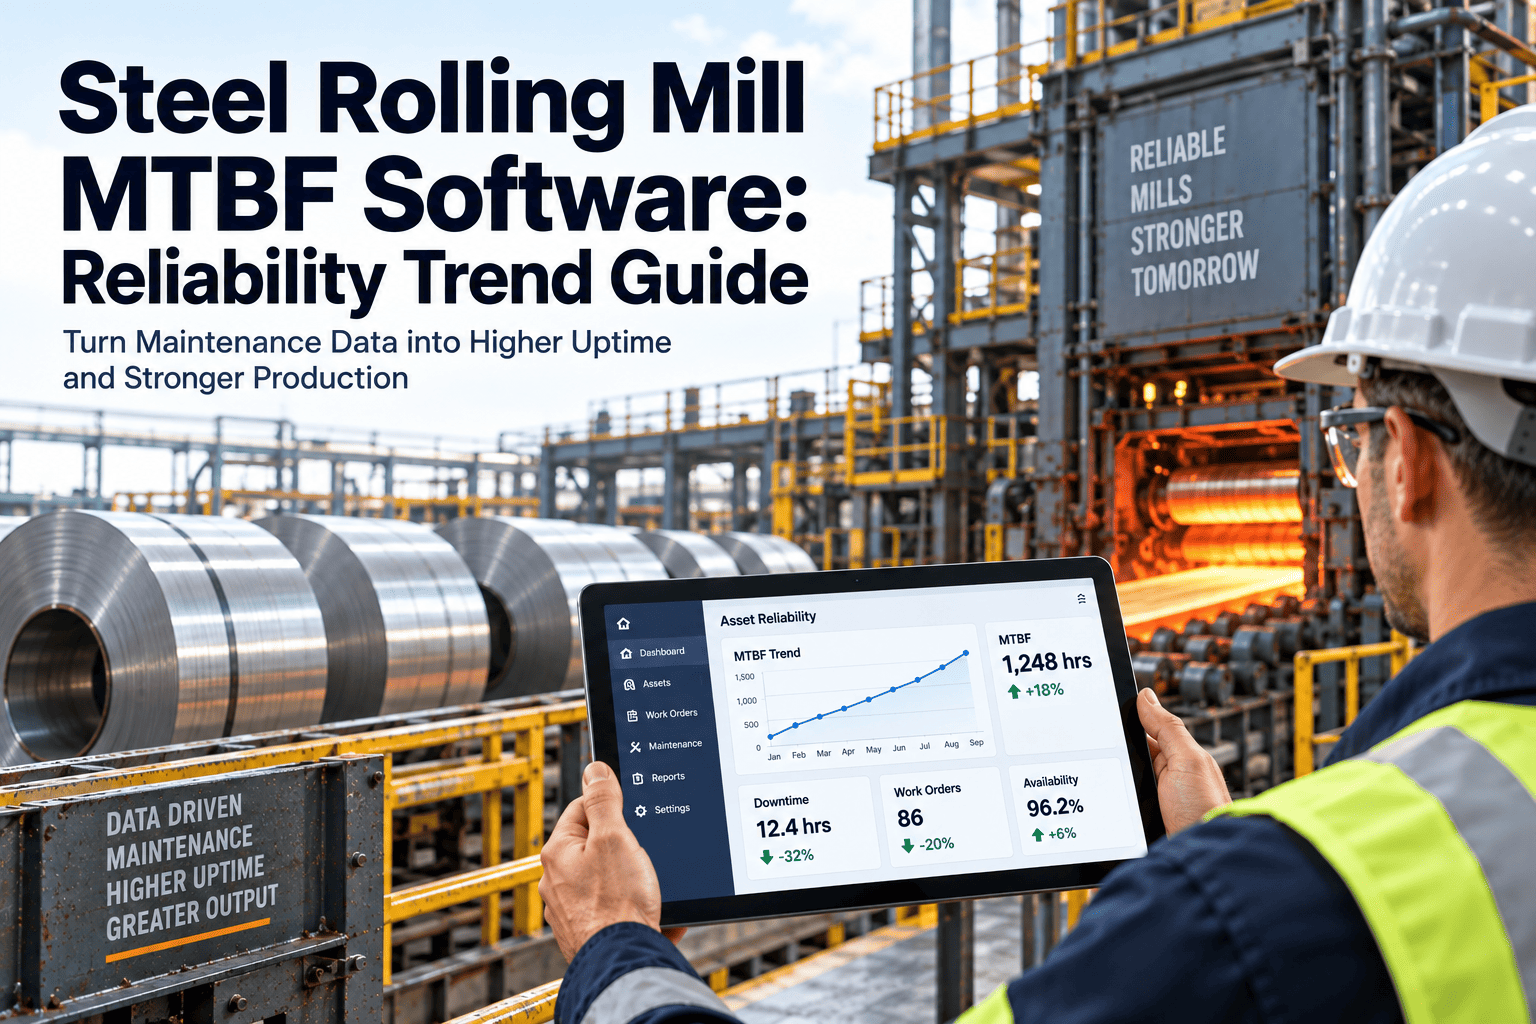
MTBF
Check whether asset classes with better compliance show longer time between failures, over a long enough period.
MTTR
Good job plans and parts kits from the PM programme should also shorten repair time when failures do occur.
Planned share of work
Track the balance of planned and reactive hours. A rising planned share usually follows steady compliance.
If compliance rises and failures do not fall, review the task content. The PM may be checking the wrong things, or at the wrong interval.
Data foundations that make the dashboard trustworthy
A dashboard is only as reliable as the records behind it. Fix these basics before arguing about the percentages.
Clean asset register
Every PM must link to a real asset with a class, location and criticality rating. Orphan tasks cannot be grouped or ranked.
Consistent department ownership
Each task needs one responsible trade or team, so results are not split or double counted.
Clear interval and due-date logic
Decide whether the next due date follows the previous due date or the actual completion date, and use one rule everywhere.
Meaningful closure fields
Require a completion date, technician, findings and follow-up work request where a defect was found.
Overdue aging: seeing risk build up
Percent compliance shows a snapshot. Aging bands show how long risk has been accumulating.
Example layout for an asset class report
This layout shows the columns most reliability teams find useful. The values are for you to fill from your own data.
| Asset class | PMs due | Completed on time | Overdue | Critical assets affected | Follow-up defects raised |
|---|---|---|---|---|---|
| Pumps | From work orders | From work orders | From work orders | Count | Count |
| Motors and drives | From work orders | From work orders | From work orders | Count | Count |
| Conveyors | From work orders | From work orders | From work orders | Count | Count |
| Cranes and hoists | From work orders | From work orders | From work orders | Count | Count |
| Electrical rooms | From work orders | From work orders | From work orders | Count | Count |
Planning PMs around shutdowns and production windows
Many steel plant PMs cannot be done while the line runs. Compliance improves when tasks are grouped for the window in which they can actually be done.
- Tag each PM as online, offline or shutdown-only, so the dashboard separates tasks that can be done any day from those that need a stop.
- Group shutdown-only tasks into packages ahead of each planned outage and track package completion.
- Share the compliance view with production planning so short stops can be used for PM work.
- Report shutdown-only tasks separately, so a missed outage does not make the whole department look poor.
- Review deferred packages before the next outage and rank them by criticality.
Turning dashboard findings into decisions
Questions to ask
- Which critical assets are overdue, and for how long?
- Is the gap caused by labour, parts, access or planning?
- Which PM tasks have never found a defect?
- Which departments carry the most reactive work?
Decisions that follow
- Move labour or contractors to the largest critical gap
- Stock the parts that block repeat PMs
- Rewrite or retire low-value tasks
- Book shutdown packages for tasks that cannot run online
Common mistakes when building a PM compliance dashboard
Too many charts
A crowded screen hides the signal. Start with five views, then add more only when someone asks a question the dashboard cannot answer.
No owner for each metric
Every view needs a named person who explains changes and agrees actions at the review meeting.
Comparing unlike areas
A continuous line and a workshop have different constraints. Compare each with its own history and target.
Rolling out the dashboard in stages
Agree definitions
Write down the compliance formula, grace window, closure rules and criticality classes, and get sign-off from maintenance and operations.
Clean and load the data
Fix asset classes, departments and PM schedules, then run the first reports side by side with the old spreadsheet.
Start regular reviews
Hold the weekly and monthly meetings, record actions and track whether they close.
Link to reliability outcomes
Add MTBF, MTTR and reactive work share, and use them to adjust task content and intervals.
Reporting PM compliance to plant leadership
Leaders need a short view that ties maintenance discipline to production risk.
- Lead with critical asset compliance and the number of critical overdue tasks.
- Show the trend for at least six months, so one poor month is not read as a collapse.
- Explain the top two causes of shortfall in plain language, and the action already agreed.
- Flag any decision needed, such as extra labour, contractor support or a shutdown slot.
- Keep the detailed views available for drill-down when questions arise.
Safety and statutory PMs deserve their own view
Some preventive tasks protect people and satisfy inspection duties. Their compliance should never be hidden inside a general average.
- Tag lifting equipment, pressure equipment, fire protection, gas detection and electrical safety tasks as a separate group.
- Show overdue statutory tasks at the top of the dashboard, with the due date and the responsible person.
- Keep certificates, test results and inspector notes attached to the completed work order.
- Report zero tolerance items separately from general PMs, and review them in every weekly meeting.
Setting targets that make sense
- Set separate targets by criticality, with the strictest for equipment that can stop production.
- Base targets on what the plant can resource, then raise them as planning improves.
- Review the number of PM tasks. A schedule larger than the crew can complete will never reach a fair target.
- Remove tasks that have no failure mode behind them, and add tasks that address repeat failures.
- Recheck intervals against failure history, so effort follows risk.
- Publish the targets to every supervisor, so the team knows what good looks like before the month starts.
- Adjust targets after each major outage, when the workload and the backlog have both changed.
- Celebrate improvement on critical assets first, since that is where the reliability benefit is largest.
A monthly review rhythm
How Oxmaint supports PM compliance tracking
Scheduling
Create time-based and meter-based preventive schedules and generate work orders automatically.
Execution records
Technicians complete checklists on mobile, add photos and readings, and close tasks with sign-off.
Dashboards and reports
Filter compliance by department, asset class, criticality and time period, and export for review meetings.
Frequently asked questions
What is a good PM compliance target?
It depends on criticality and resources. Set stricter targets for critical assets and raise them over time.
Should deferred PMs count as missed?
Show them separately with an approval reason. That keeps the score honest and the reasons visible.
Can we build this without special software?
Spreadsheets can work at small scale. For live views, start in Oxmaint to keep data in one place.
How often should the dashboard be reviewed?
Supervisors weekly, managers monthly, and leadership quarterly.
Can we see a steel plant example?
Yes. Book a demo and we will set up the views with your asset structure.
Know where your preventive maintenance stands, every week
Move from monthly spreadsheets to a live compliance view. Build your steel plant PM dashboard in Oxmaint or talk it through with the team.