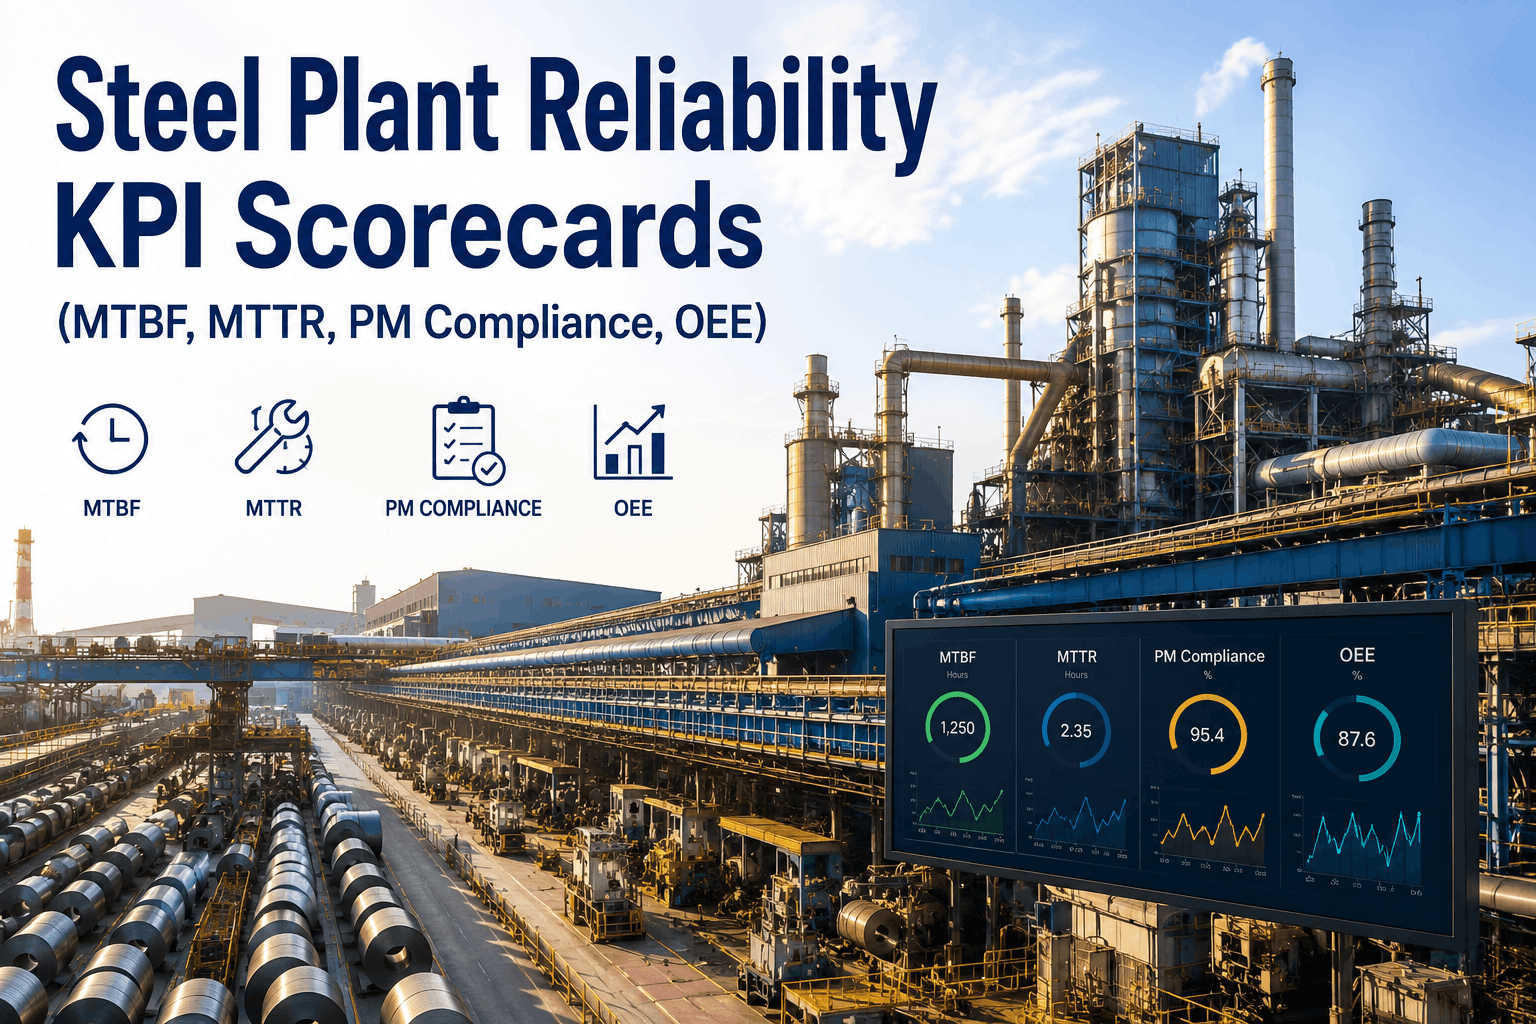
Unplanned downtime costs integrated steel mills $8,000–$50,000 per hour depending on equipment criticality — yet 79% of mills lack real-time reliability KPI visibility, tracking MTBF (Mean Time Between Failures), MTTR (Mean Time To Repair), and PM compliance on disconnected spreadsheets or not at all. When a hot rolling mill stand fails unexpectedly, production halts across the entire campaign, cascading unplanned maintenance across dependent equipment. Without a reliability KPI scorecard, maintenance teams react blindly to crises instead of preventing failures through systematic condition monitoring. OxMaint's free steel plant reliability KPI scorecard template automates MTBF and MTTR calculation, tracks planned maintenance compliance rates, measures overall equipment effectiveness (OEE), and links reliability metrics directly to work order data in your CMMS — enabling predictive insights that prevent catastrophic failures months in advance. Download now and transform reliability from a monthly report surprise into a continuous operational discipline — whether you're tracking blast furnace availability, rolling mill uptime, or facility-wide equipment health across your entire steel production complex.
Real-Time Reliability Scorecards for Steel Mills
OxMaint's free template includes MTBF/MTTR auto-calculation, OEE dashboards, PM compliance tracking, planned vs. reactive ratio metrics, and CMMS-driven KPI scorecards — ready to transform reliability data into predictive maintenance action within minutes.
Why Steel Mills Can't Afford Blind Reliability Management
Steel mill equipment runs continuously under extreme thermal, mechanical, and cyclic stress. A blast furnace operates 24/7 for 5–10 year campaigns; cooling system failure costs $50,000+ per hour in production losses plus potential refractory damage. Hot rolling mills transition between high-speed rolling (400+ rpm) and rapid speed changes; bearing wear accelerates exponentially without predictive monitoring. Continuous casting systems demand split-second thermal control precision; temperature sensor failure triggers refractory damage, equipment restart delays (4–8 hours), and contaminated steel product write-offs. Yet most mills operate in reactive mode: maintenance responds to failures as they occur, with no early warning system to prevent cascading damage. When equipment fails unpredictably, maintenance crews scramble with emergency repair planning, delayed parts procurement, and prolonged facility downtime. A reliability KPI scorecard changes this dynamic fundamentally. By tracking MTBF (Mean Time Between Failures), MTTR (Mean Time To Repair), PM compliance rates, and OEE (Overall Equipment Effectiveness) in real-time, maintenance teams identify failure patterns months before catastrophic breakdown occurs. Equipment approaching end-of-life signals degradation through declining MTBF trends — enabling planned replacement before emergency failure. Chronic maintenance bottlenecks appear in elevated MTTR data — triggering spare parts pre-positioning or backup contractor arrangements. PM compliance deficits directly correlate with increased failure rates — justifying maintenance staffing or outsourcing investment. Reliability KPI scorecards provide the data foundation that shifts mills from reactive crisis management to predictive, planned maintenance discipline.
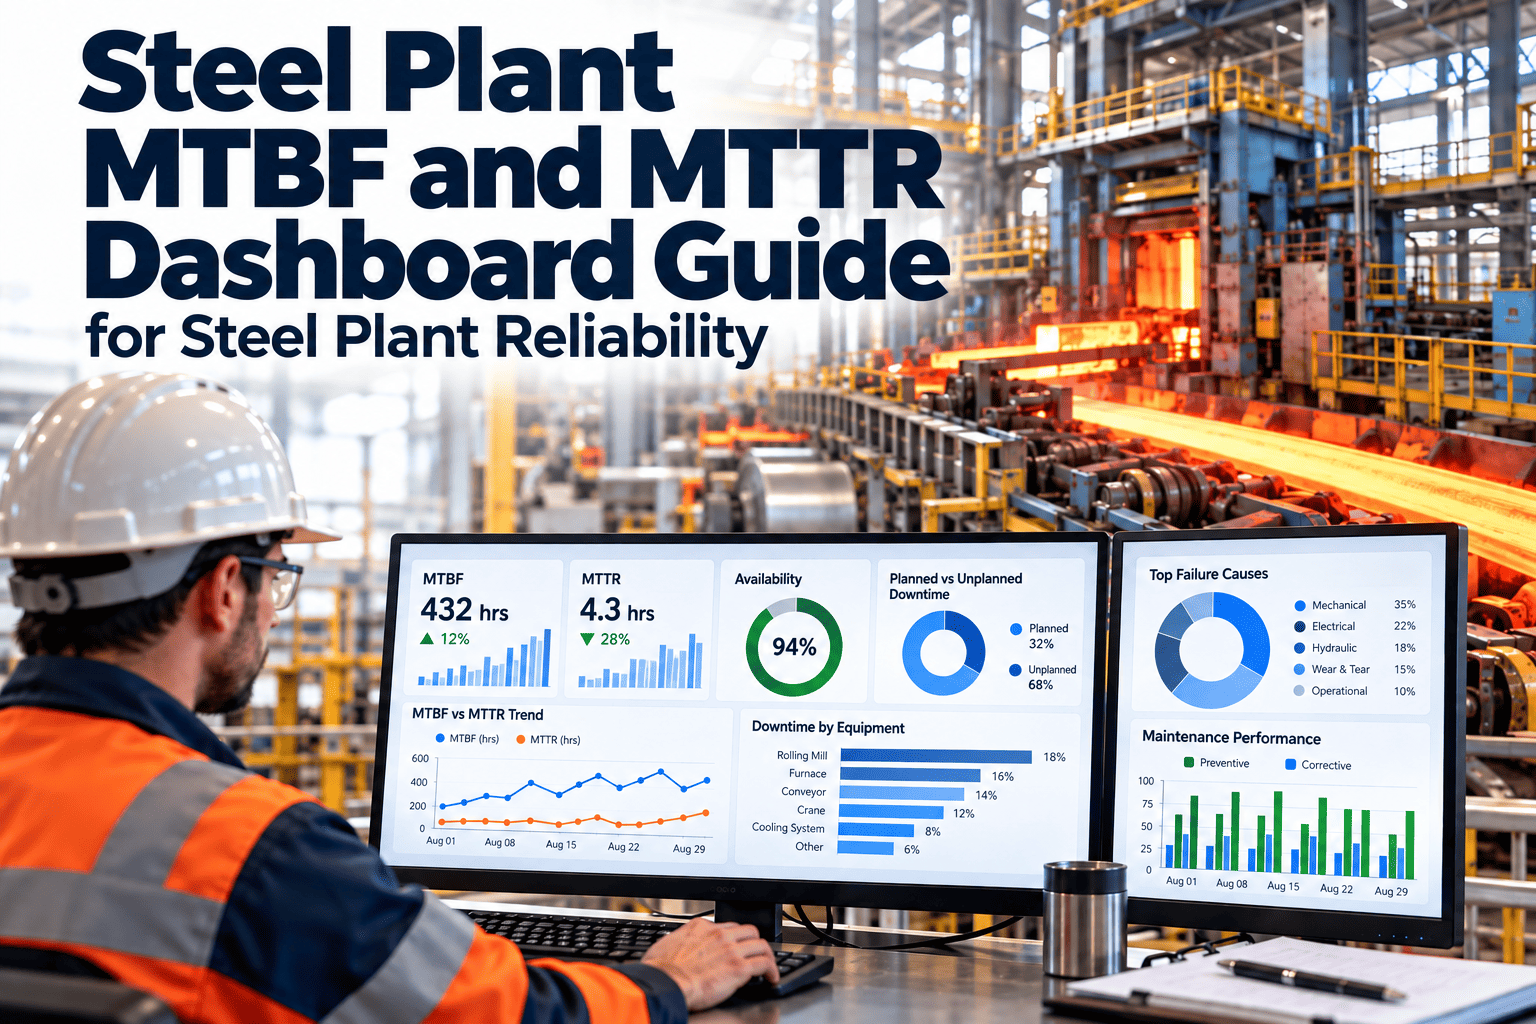
OxMaint automatically calculates Mean Time Between Failures (hours/days between breakdown events) and Mean Time To Repair (average hours to restore equipment to service) from work order data. Equipment health is visible immediately — no manual spreadsheet compilation or interpretation delays.
OEE combines availability (uptime %), performance (actual vs. ideal speed/capacity), and quality (defect-free production %) into single metric. OxMaint aggregates OEE across equipment hierarchy: line OEE, process area OEE, and facility OEE — enabling multi-level performance visibility.
OxMaint separates planned maintenance (PM, PdM) from reactive (corrective) work orders. Industry target is 80% planned / 20% reactive; leading mills exceed 85% planned. OxMaint flags facilities trending toward reactive-heavy workloads — signaling need for increased PM investment.
Track completion rates for scheduled preventive maintenance: oil sampling, bearing inspections, alignment checks, thermal imaging audits. OxMaint alerts on skipped or delayed PM work orders — preventing compliance gaps that directly correlate with increased failure rates and safety incidents.
Monitor MTBF trends month-over-month: degrading MTBF signals approaching end-of-life or chronic maintenance issues. OxMaint auto-detects failure pattern changes, alerting engineers when equipment reliability deteriorates — enabling proactive replacement or intensive maintenance before catastrophic failure.
Compare reliability KPIs across all equipment: gearboxes, motors, bearings, hydraulic systems, control systems. OxMaint identifies worst-performing asset classes — directing capital and maintenance resources toward highest-impact reliability improvements.
Industry-Benchmark Reliability Metrics for Steel Mill Equipment
Steel mills benchmark reliability against three standards: MTBF (hours between unplanned failures), MTTR (hours to repair), and PM compliance rates. Equipment class, age, and maintenance discipline heavily influence these metrics. Leading mills achieve MTBF targets 2–3x higher than struggling facilities operating similar equipment — demonstrating that reliability is fundamentally a discipline and execution problem, not an equipment limitation. Your reliability scorecard must compare your equipment against industry benchmarks and your own internal historical baselines — enabling evidence-based justification for maintenance investment and equipment replacement decisions.
| Equipment Class | Typical Steel Mill Application | Industry Avg MTBF (hours) | Best-in-Class MTBF (hours) | Avg MTTR (hours) | PM Compliance Target |
|---|---|---|---|---|---|
| Blast Furnace Cooling Systems | Water loops, copper tube bundles, heat exchangers | 4,000–8,000 hours (5–11 months) | 12,000–16,000 hours (16–22 months) | 2–4 hours (critical priority) | 95–98% scheduled inspection completion |
| Rolling Mill Motor Drives | Hot/cold stand motors, gearbox couplings, bearings | 8,000–12,000 hours | 18,000–24,000 hours (3+ years) | 4–8 hours (standby equipment available) | 90–95% PM completion (vibration, temperature monitoring) |
| Continuous Casting Mold and Spray System | Oscillation systems, spray water circuits, temperature controls | 6,000–10,000 hours | 14,000–18,000 hours | 3–6 hours (campaign impact critical) | 98%+ thermal imaging, nozzle inspections, clog prevention |
| Sintering Plant Equipment | Sinter strand drive, cooler, discharge, material handling | 5,000–9,000 hours | 12,000–16,000 hours | 2–6 hours (dust/corrosion environment) | 90–95% (high dust ingress requires frequent inspection) |
| Pelletizing Equipment | Disc pelletizer, balling drum, classifier, cooler | 6,000–10,000 hours | 16,000–20,000 hours | 3–8 hours | 85–90% (lower criticality than BF/casting) |
| Hydraulic Power Units | Material handling, press systems, gate controls | 8,000–15,000 hours | 20,000–30,000 hours | 2–4 hours (oil sampling, filter change) | 90%+ (oil sampling compliance critical) |
Building Your Steel Plant Reliability KPI Scorecard in OxMaint
Equipment Criticality Classification and MTBF Baselines
Classify equipment by criticality (Tier 1: blast furnace, rolling mills; Tier 2: auxiliary systems; Tier 3: non-critical support). Define baseline MTBF targets based on industry benchmarks and your historical data. OxMaint alerts when actual MTBF falls below targets — triggering maintenance intervention before failure cascades.
MTBF and MTTR Calculation Logic and Work Order Integration
OxMaint automatically calculates MTBF from work order downtime records and MTTR from repair completion times. Define calculation parameters: include/exclude planned shutdowns, count partial vs. full equipment failures, separate critical vs. minor repairs. Automated calculation prevents manual interpretation errors.
OEE Component Tracking: Availability, Performance, Quality
Break OEE into three components: availability (uptime %), performance (actual vs. nameplate capacity), quality (defect-free product %). OxMaint aggregates metrics at equipment level, process area level, and facility level. Root cause analysis targets the OEE component with greatest loss.
PM Schedule Adherence and Compliance Tracking
Define PM schedules (oil sampling intervals, bearing inspections, alignment checks, thermal imaging). OxMaint tracks completion rates and flags overdue work. PM compliance directly correlates with MTBF: 95%+ compliance = healthy MTBF; 80% compliance = deteriorating MTBF. Real-time alerts prevent compliance gaps.
Planned vs. Reactive Maintenance Ratio and Work Order Type Classification
Classify all work orders: PM (planned preventive), PdM (predictive), and CM (corrective/reactive). OxMaint calculates planned ratio (should target 80%+). Trending toward reactive-heavy workload signals maintenance program failure — justifying increased PM investment or equipment replacement.
Scorecard Dashboard Publishing and Trend Analysis
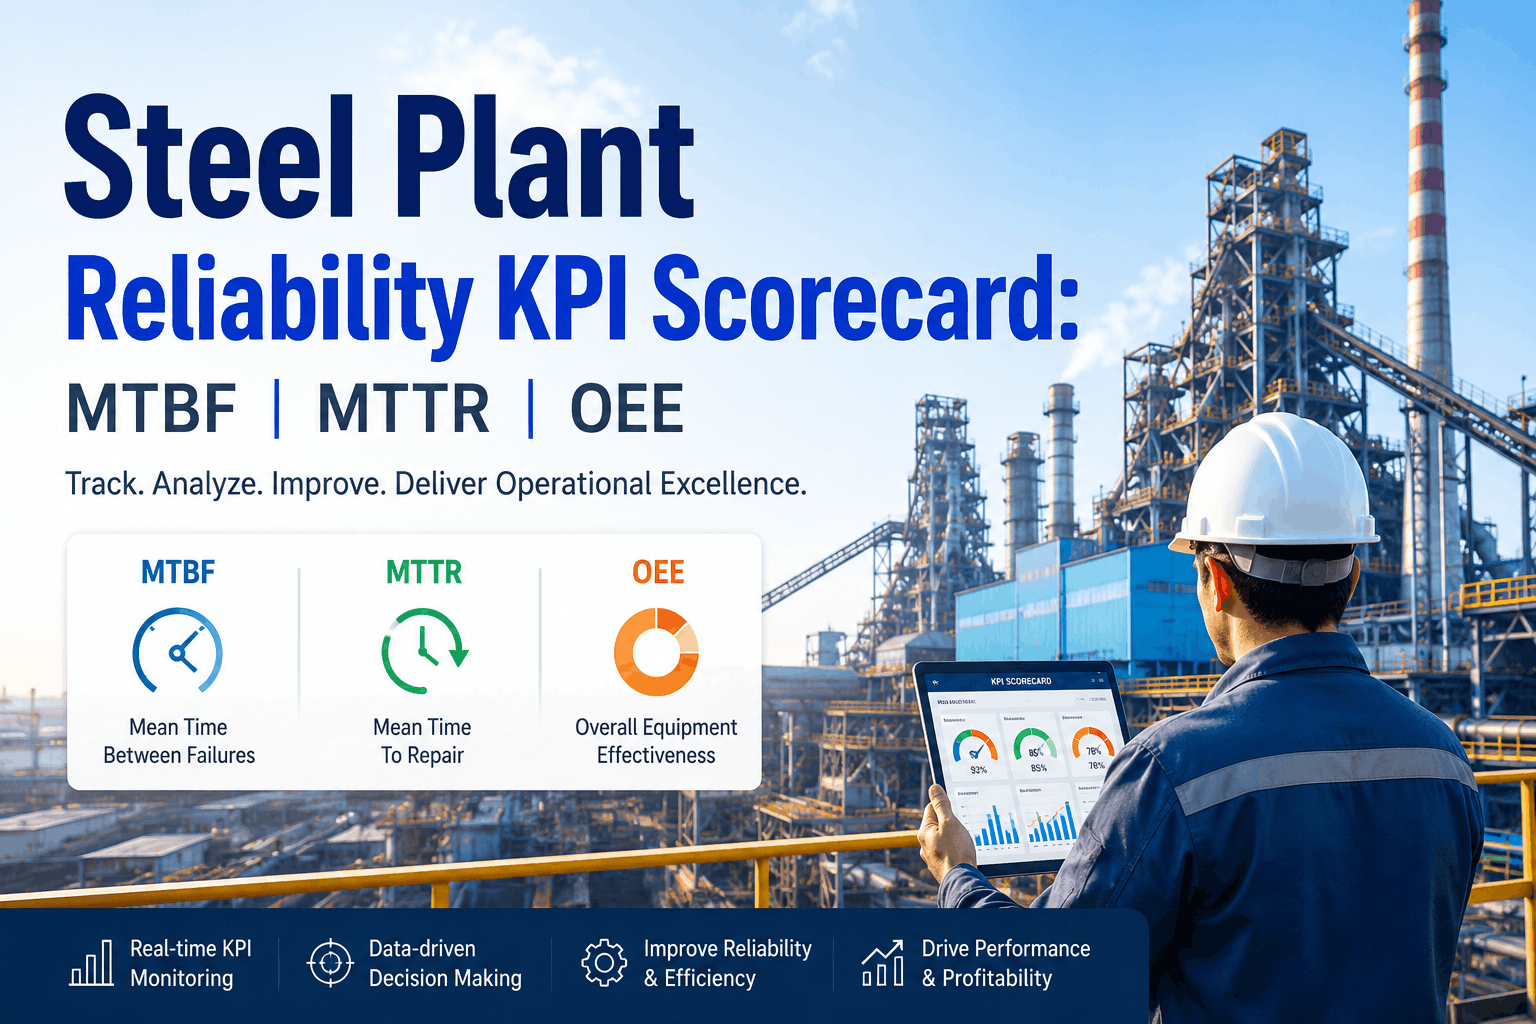
Create real-time scorecards visible to operations, maintenance, and engineering teams. Display MTBF, MTTR, OEE, PM compliance, and planned/reactive ratio trends. OxMaint flags equipment with declining trends — enabling proactive intervention before failure metrics deteriorate further.
Steel Mill Reliability Best Practices from Industry Leaders
Reliability KPI Impact on Steel Mill Economics and Production Continuity
What's Included in OxMaint's Steel Plant Reliability KPI Scorecard Template
OxMaint automatically calculates Mean Time Between Failures and Mean Time To Repair from work order data. Monthly trend analysis reveals equipment health patterns: improving MTBF signals effective maintenance; declining MTBF signals deteriorating equipment. No manual spreadsheet compilation required.
OEE combines availability (uptime %), performance (actual vs. nameplate speed/capacity), and quality (defect-free production %) into unified metric. OxMaint aggregates OEE across equipment hierarchy and identifies where losses originate. Enables root cause-driven improvement targeting.
OxMaint separates PM (planned preventive), PdM (predictive), and CM (corrective) work orders. Industry target is 80–90% planned; below 70% signals reactive-heavy maintenance and poor reliability. Real-time PM compliance tracking prevents scheduling gaps that correlate with increased failure rates.
Board-ready scorecards display MTBF, MTTR, OEE, planned ratio, and PM compliance metrics with historical trending. Color-coded status (green/yellow/red) enables immediate assessment of reliability health. OxMaint exports monthly scorecard reports for stakeholder communication.
OxMaint auto-triggers alerts when MTBF drops below target or PM compliance falls below threshold. Alerts route to maintenance manager, operations supervisor, and engineering team — enabling rapid response before failure metrics deteriorate further or unplanned downtime cascades.
Customer Success: How Steel Mills Transformed Reliability Using Real-Time Scorecards
"Reliability Scorecard Prevented $8M in Hot Mill Cascading Failure"
"We installed OxMaint's reliability scorecard and immediately identified two rolling mill stands with declining MTBF trends (down 40% over 6 months). Traditional monthly reports had obscured the trend. We conducted intensive vibration analysis and discovered advanced bearing wear — we replaced bearings before catastrophic failure. A month later, a similar stand at our competitor failed, causing $18 million in cascading damage across their rolling campaign. Our early intervention saved $8+ million. We now monitor MTBF trends daily and act within hours when decline is detected. Reliability scorecard discipline has reduced our unplanned downtime 65%, improved equipment MTBF by 3x, and shifted our maintenance ratio from 55% planned to 88% planned within two years." — Maintenance Director, Integrated North American Steel Mill
Steel Plant Reliability Management: FAQ for Maintenance and Operations Teams
What is the difference between MTBF and MTTR in steel mill reliability measurement?
MTBF (Mean Time Between Failures) measures hours of operation between unplanned failures — higher is better and signals reliable equipment (target 10,000+ hours for critical mill equipment). MTTR (Mean Time To Repair) measures average hours to restore equipment to service after failure — lower is better and signals quick repair capability (target 4–8 hours depending on equipment criticality).
How does OEE (Overall Equipment Effectiveness) differ from MTBF for assessing equipment health?
MTBF tracks unplanned failures only; OEE measures total productivity loss including uptime loss (failures), speed loss (running below nameplate capacity), and quality loss (defects). Equipment can have good MTBF but poor OEE if running consistently below speed or producing defects. Both metrics together paint complete reliability picture.
What PM compliance rate is required to maintain healthy MTBF in steel mill equipment?
Industry data shows 90%+ PM compliance maintains stable MTBF; 80–90% compliance shows rising failure rates; below 80% indicates failure rate acceleration is imminent. Even one skipped PM interval on critical equipment (oil sampling, bearing inspection) can trigger catastrophic failure within weeks. OxMaint alerts immediately on PM compliance gaps.
How should we calculate MTBF for equipment with multiple failure modes or partial failures?
Count only unplanned downtime events that halt production or require emergency repair; exclude scheduled shutdowns and minor adjustments. OxMaint allows flexibility: separate calculation logic for equipment with multiple failure modes, partial failures (running in degraded mode), or cascading failures. Consistency is more important than absolute perfection.
What reliability KPIs indicate equipment approaching end-of-life requiring replacement?
Watch for: MTBF declining 30%+ year-over-year despite increased PM investment, MTTR increasing due to parts unavailability or specialist scarcity, OEE below 60% despite perfect uptime, or planned/reactive ratio trending below 60%. These patterns signal equipment maintenance ROI is deteriorating — replacement economics become favorable.
How does blast furnace cooling system reliability impact overall mill production reliability?
Blast furnace cooling failure is unrecoverable within hours — forcing furnace shutdown and 2–4 week restart sequence. OxMaint prioritizes BF cooling MTBF monitoring: target 12,000+ hours; monitor oil cleanliness, water flow, tube temperatures biweekly; track every minor repair. BF cooling is highest-priority reliability focus in any integrated mill.
Can we use reliability KPI scorecards to justify maintenance staffing or outsourcing investment?
Yes — declining PM compliance rates, rising MTTR, and elevated planned maintenance backlog directly justify maintenance staffing increases. OxMaint quantifies backlog hours and MTTR impact: if MTTR averages 8 hours and backlog totals 800 hours, that's 100 hours of lost availability annually — economic case for staffing or contractor support.
How should reliability KPIs guide capital investment in equipment upgrades or replacement?
Use MTBF decline, rising MTTR, and OEE degradation as objective triggers for capital planning. Equipment with MTBF below historical baseline and rising failure rate cost warrants replacement consideration. OxMaint calculates: reliability-driven downtime cost vs. new equipment capex vs. extended life through intensive maintenance — enabling data-driven capital allocation.
Reliability Scorecard Template: Download and Activate Real-Time Monitoring Today
Our free steel plant reliability KPI scorecard template provides MTBF and MTTR auto-calculation, OEE dashboards, PM compliance tracking, and planned/reactive ratio analysis — all integrated with CMMS work order data. Connect your equipment hierarchy, define reliability targets based on industry benchmarks, and activate daily monitoring. Within 48 hours, your teams have transparent visibility into equipment health, failure trend detection, and predictive maintenance triggers. No spreadsheet delays. No monthly report surprises. Reliability becomes continuous operational discipline.
Get Your Free Reliability KPI Scorecard Template Today
Stop reacting to equipment failures. OxMaint's template transforms reliability from monthly report surprise into continuous predictive monitoring — free to download and customize for your specific equipment and operational needs.

.png)