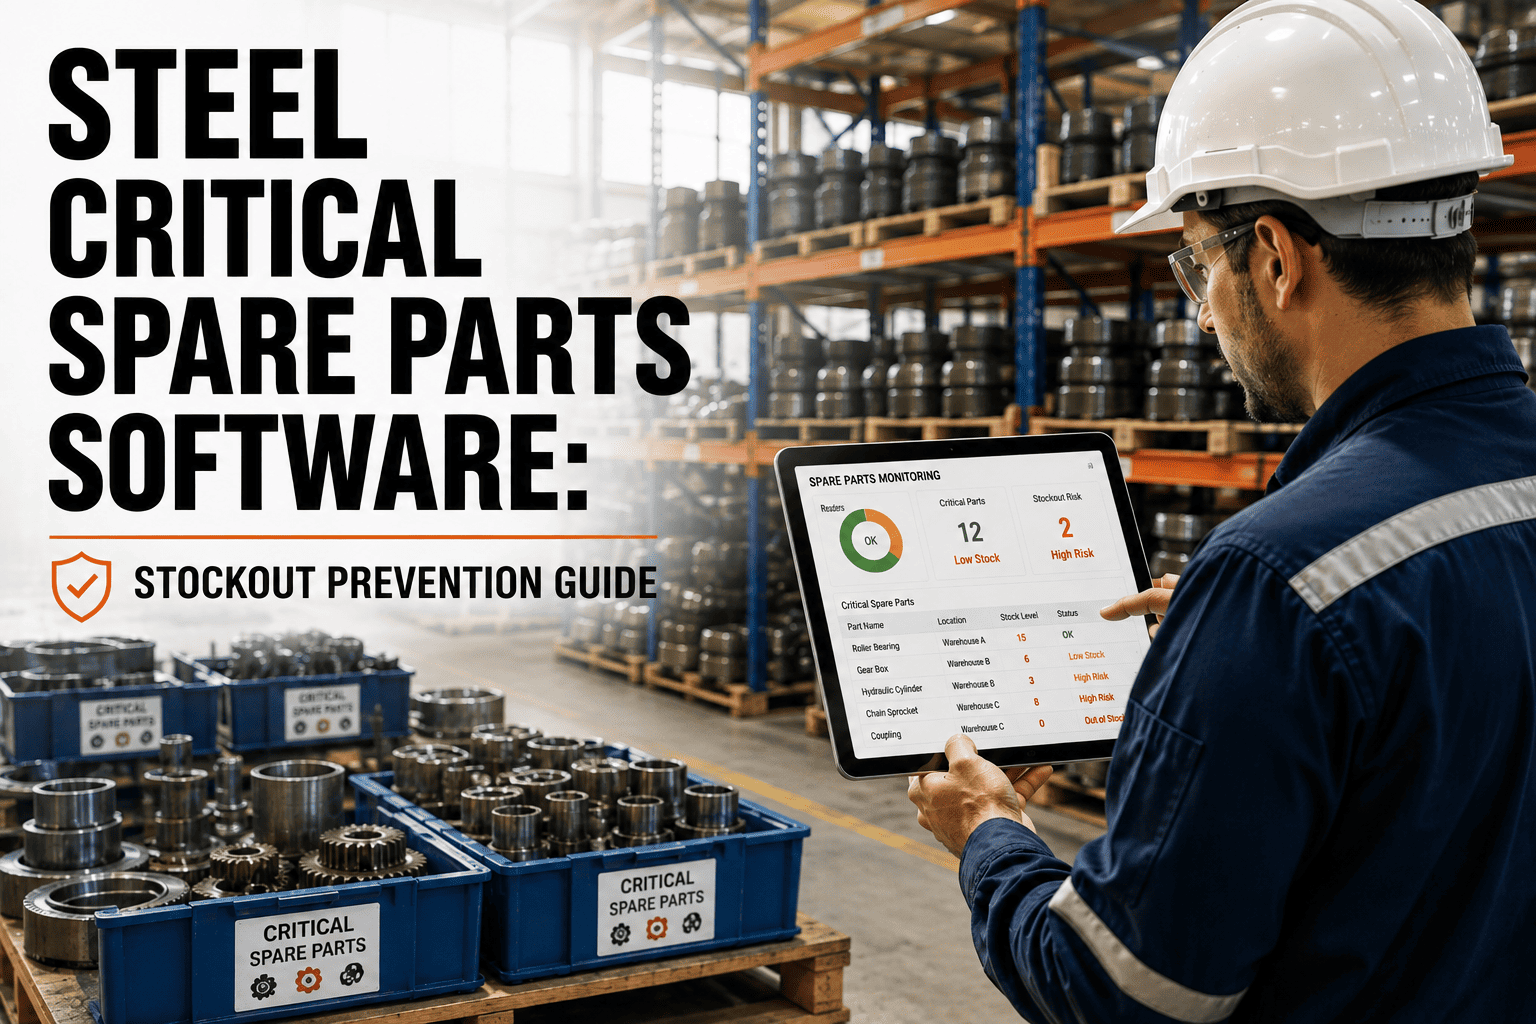
A single missing bearing, servo valve or gearbox pinion can hold a rolling mill or continuous caster idle for days, while a warehouse full of slow-moving stock ties up working capital. Steel plants live between those two risks every day. Spare parts demand for critical equipment is irregular, driven by wear, campaigns and failures rather than steady consumption, so ordinary reorder rules often miss it. A structured approach built on criticality, demand patterns and maintenance plans, supported by Oxmaint maintenance management software, gives planners a defensible way to decide what to stock and when.
Why Critical Spares Are Hard to Forecast
Most MRO stock behaves differently from production materials. Demand arrives in bursts, often zero for months and then several units at once during a shutdown.
- Production stops while parts are expedited
- Premium freight and emergency supplier pricing
- Cannibalising parts from other equipment
- Rushed repairs that shorten component life
- Safety exposure from temporary workarounds
- Capital locked in parts that never move
- Storage, handling and insurance overhead
- Obsolescence when equipment is upgraded
- Shelf-life issues for seals, lubricants and electronics
- Duplicate stock under different part numbers
What Makes Steel Plants Special
- Long lead times for large forgings, castings, gearboxes and motors, sometimes measured in months.
- Severe operating conditions, including heat, scale, water, dust and shock loads, which shorten component life unpredictably.
- Many parts are specific to one line, so there is little statistical history to learn from.
- Campaign-based consumption in areas such as rolls, refractories and mould components, where demand follows production volume.
Start With Classification, Not Forecasts
Forecasting effort should be proportional to consequence. A three-way classification gives each part a policy before any statistics are applied.
| Classification | Question It Answers | How It Is Used |
|---|---|---|
| Criticality (vital, essential, desirable) | What happens to production or safety if this part is missing? | Sets target service level and whether insurance stock is justified |
| Annual consumption value (ABC) | How much money moves through this item? | Focuses review effort and purchasing attention |
| Demand variability (XYZ) | How regular and predictable is usage? | Selects the forecasting method |
| Lead time and supply risk | How long to replace it, and how many sources exist? | Drives safety stock and contract strategy |
| Repairability | Can it be refurbished and returned to stock? | Separates rotable spares from consumables |
Where Demand Comes From in a Steel Plant
Understanding the demand driver matters more than the choice of algorithm. Different part families behave in different ways.
| Part Family | Typical Equipment | Main Demand Driver | Planning Approach |
|---|---|---|---|
| Work rolls, backup rolls, chocks | Hot and cold rolling mills | Tonnage rolled and campaign length | Production-linked consumption plan |
| Mould tubes, segment rolls, bearings | Continuous caster | Heats cast and inspection findings | Interval plus condition review |
| Electrodes, refractory, water-cooled panels | Electric arc furnace, ladle furnace | Heat count and power-on time | Usage rate per heat |
| Gearboxes, couplings, spindles | Mill drives, cranes | Fatigue and shock load, rare failure | Insurance or rotable pool |
| Servo valves, hydraulic cylinders, seals | Mill hydraulics, caster | Contamination and wear | PM-driven plus condition data |
| Motors, drives, fans | Auxiliaries, ID fans | Random failure, overhaul schedule | Reliability-based sparing |
| Belts, idlers, wear plates | Raw material handling | Throughput and abrasion | Regular time-series forecast |
Choosing a Forecasting Method That Fits the Demand
No single method works across the store. Match the approach to the pattern, and keep it simple enough for planners to explain.
From Forecast to Reorder Point
A forecast only becomes useful when it sets a stocking level. The core logic is the same across methods.
Lead Time Against Consequence
Turning Maintenance Findings Into Parts Demand
The best early signal for parts demand sits in maintenance, not in purchasing history. Inspection findings and condition trends reveal what will be needed before it is requested.
Data Quality Checklist Before You Forecast
Forecasting poor data produces confident but wrong answers. Check these items first.
How Oxmaint Supports the Spare Parts Workflow
Oxmaint connects spare parts to the maintenance activity that consumes them, which is the foundation of any credible demand forecast.
Measures That Show Whether Stocking Is Working
Common Mistakes to Avoid
- Applying one safety stock percentage to every part regardless of consequence.
- Smoothing planned shutdown demand as if it were random usage.
- Ignoring repair and refurbishment loops, which reduces the need for new purchases.
- Deleting slow movers without checking whether they are insurance spares.
- Treating the forecast as fixed instead of reviewing it after each shutdown.
Rotable Spares and Repair Loops
Many of the most expensive steel plant spares are not consumed. Gearboxes, hydraulic cylinders, spindles, motors and roll chocks are removed, refurbished and returned to stock, so the real question is how many units the loop needs.
- Size the rotable pool from the number of installed units, the failure or overhaul rate and the repair turnaround time.
- Track each serialised unit with its history, location, condition and refurbishment cost.
- Compare repair cost with replacement cost and lead time before approving each repair.
- Record which repair shop handled each unit so quality and turnaround can be compared.
Signs the Rotable Pool Is Wrong
- Units wait in repair shops while the line runs without a standby.
- Several refurbished units sit idle for years with no assigned installation.
- Repair history is held by the supplier, not by the plant.
Shutdown Planning and Kitting
Planned outages generate the largest single burst of demand. Parts that arrive late or in the wrong quantity extend the stop, and every extra hour costs production.
Supplier and Contract Strategies for Long Lead Items
Not every risk has to be solved with stock on your own shelf. Supply arrangements can shorten effective lead time and reduce capital tied up in inventory.
- Framework agreements with agreed pricing and delivery commitments for critical, repeat purchases.
- Vendor-managed or consignment stock for common items, where the supplier holds the inventory on site.
- Pooling arrangements with sister plants or OEMs for very expensive insurance spares.
- Qualified alternative suppliers for obsolete or single-source parts, validated before an emergency.
- Reverse engineering or re-manufacture of discontinued components, with engineering approval.
Managing Obsolescence
- Flag parts whose manufacturer has announced end of life, and decide whether to buy a last-time stock.
- Link spares to equipment replacement plans so stock is not bought for assets about to be retired.
- Review dormant items annually with engineering before writing them off or selling them.
Reviewing the Forecast After Every Shutdown
Forecasting is a loop. Each outage and each breakdown produces evidence about what was actually needed, and that evidence should change the numbers.
- Compare forecast and actual usage for the parts planned into the shutdown, and note the causes of any gap.
- Update lead times with actual supplier delivery performance, not purchase order promises.
- Add newly discovered failure modes and the parts they require to the relevant equipment records.
- Re-rate criticality when equipment changes, such as a new mill stand or an additional standby unit.
- Record every stockout, with its cause, whether a stocking rule, a data error or a supplier failure.
Questions to Ask About Any Critical Spare
- If this part fails tomorrow, how many hours or days will the line be down?
- Is there an installed standby, a refurbished unit or a compatible part elsewhere in the plant?
- Who can supply it fastest, and has that supplier delivered on time before?
- Does the part have a shelf life, storage condition or calibration requirement?
- Would a condition alert give enough warning to order it, or must it already be on the shelf?
- Is the equipment due for replacement or upgrade in the next few years?