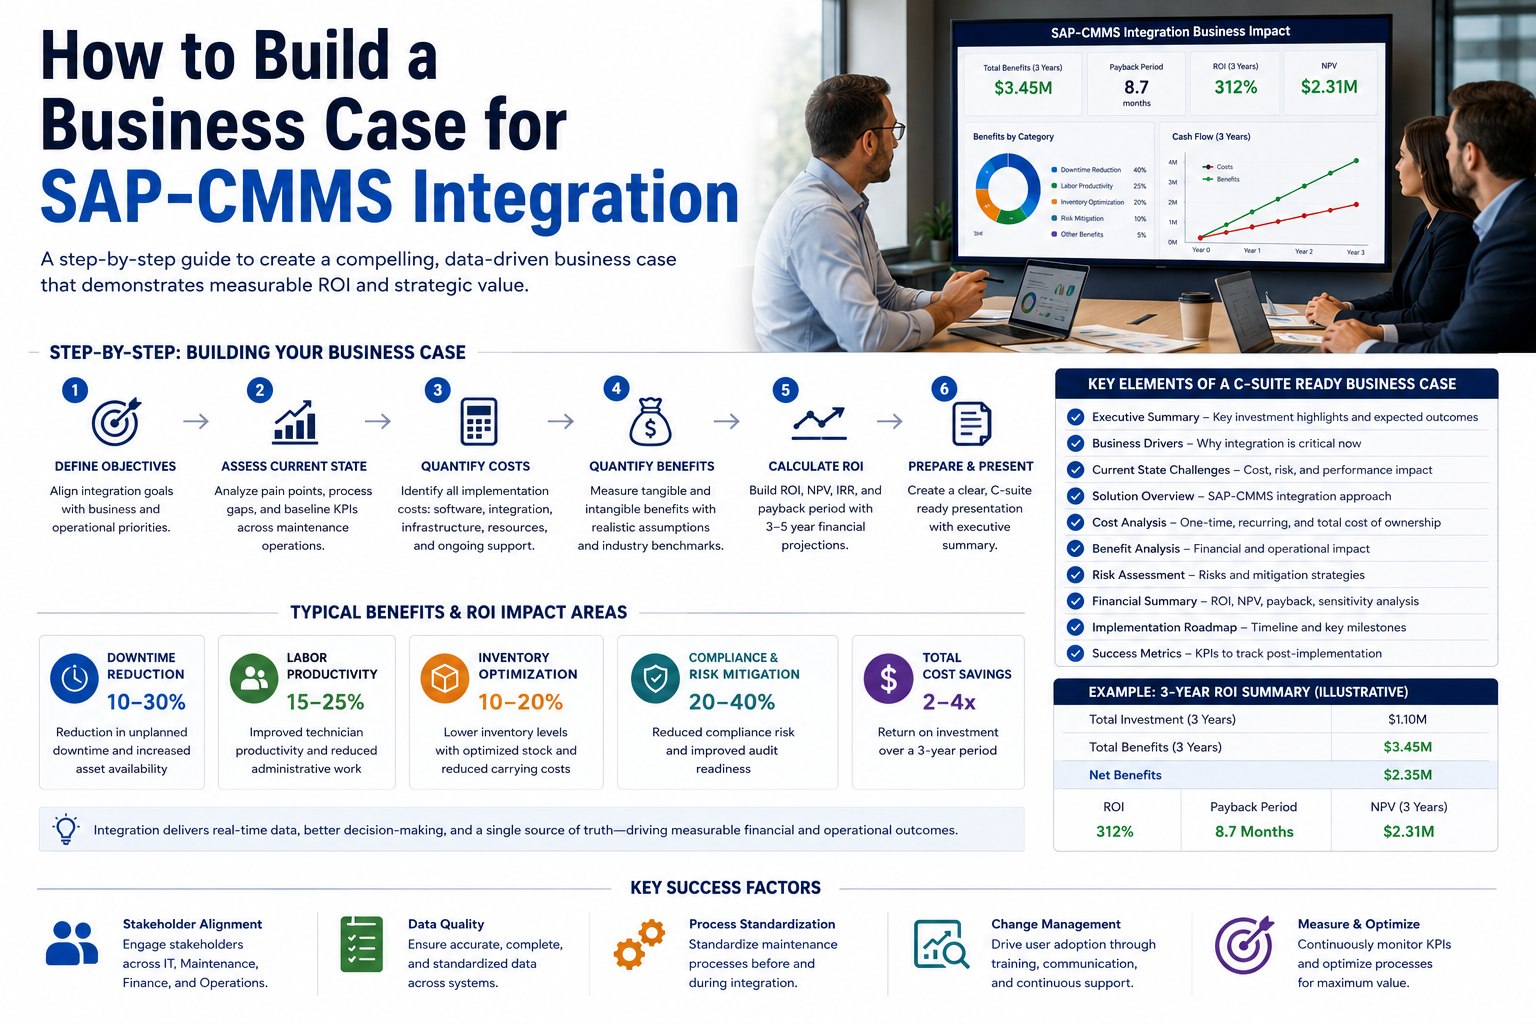
How to Build a Business Case for SAP-CMMS Integration
The maintenance team knows the SAP-CMMS integration will pay back. The CFO needs proof. The gap between operational conviction and financial defensibility is where most business cases die—usually in the third executive review meeting where someone asks "but how did you actually calculate that benefit number?" This article walks through the eight benefit pillars, the investment categories, the payback math, and the risk adjustments that turn a vague maintenance proposal into a defensible C-suite document. Book a free demo to see business cases built on real customer data.
BUSINESS CASE REALITY
Why "Trust Us, It's Worth It" Fails Every CFO Review
$1.9M-$10.6M
Typical Annual Value Range
8
Quantifiable Value Pillars
12-24 mo
Typical Payback Window
3-5x
5-Year ROI Multiple
Why Most Maintenance Business Cases Fail at the CFO Level
Maintenance leaders build business cases the way they explain operational problems: descriptively. "Downtime is bad. The integration will reduce it. The savings will be significant." That language reads as advocacy to a CFO, not analysis. The third meeting question—"how exactly did you calculate that?"—exposes the gap. Without a defensible methodology behind each number, the business case becomes opinion rather than evidence, and finance teams rightly push back.
The pattern that wins approval inverts the structure. Instead of leading with conclusion ("this will save millions"), strong business cases lead with methodology ("here's how each benefit is calculated, here's the source data, here are the conservative assumptions, here are the risk adjustments"). The same total ends up on the page—but the path to it is auditable. Maintenance leaders ready to build a defensible business case can Sign up free to begin business case quantification.
The 8-Pillar SAP-CMMS Business Case Value Architecture
The architecture below covers the eight quantifiable benefit pillars every defensible SAP-CMMS integration business case includes. Each pillar shows the typical annual value range, the calculation methodology, and the assumption every CFO will probe. Mid-size manufacturing operations typically realize benefits within these ranges; large operations exceed them, smaller operations land near the floor.
8 PILLARS · ANNUAL VALUE RANGES · DEFENSIBLE METHODOLOGY
SAP-CMMS Business Case Value Architecture
Total Annual Value Range: $1.9M – $10.6M for mid-size manufacturer
PHASE A · Direct Cost Savings
PHASE B · Operational Efficiency
PHASE C · Strategic Value
01
Downtime Reduction ANCHOR · LARGEST
Direct
$500K – $3M
annual value
Drivers: Unplanned downtime hours · cost per downtime hour · 30-50% reduction from predictive maintenance integration
Methodology: Baseline current downtime, apply 25-40% reduction (industry-standard from predictive integration), multiply by hourly downtime cost. Assumption: Conservative 25% improvement at low end.
02
Labor Productivity Gain
Direct
HIGH CONFIDENCE
$200K – $800K
annual value
Drivers: Wrench-time gain from mobile access · administrative time reduction · planner productivity from integrated data
Methodology: Technician FTE count × loaded cost per FTE × 20-30% productivity gain. Assumption: 20% wrench-time improvement is industry benchmark for mobile integration.
Methodology: Asset replacement value × 20% life extension × annual depreciation. Assumption: 20% asset life extension; discount to present value for multi-year benefit.
3Direct Cost Savings
3Operational Efficiency
2Strategic Value
$10.6MHigh-End Total
The eight-pillar architecture gives executive reviewers what they need: every claim traces to a calculation, every calculation traces to baseline data, every assumption is explicit and defensible. The total emerges from the pillars rather than being asserted at the top. Maintenance leaders ready to apply the methodology to their own organization can Sign up free to quantify your 8 pillars against your data.
SEE IT IN PRACTICE
Walk Through a Real Customer Business Case
30-minute walkthrough of the full 8-pillar methodology applied to anonymized customer data—showing how each number was calculated and validated with finance.
A credible business case shows both sides honestly. Investment categories below represent the typical cost structure for SAP-CMMS integration at a mid-size manufacturing operation. Padding any of these to be conservative is acceptable; underestimating any of them destroys credibility when actual costs land.
Software Licensing
$80K-$300K
annual subscription
Per-user or per-asset licensing depending on platform model
Implementation Services
$200K-$800K
one-time
Integration design, configuration, data migration, testing, deployment
Internal Labor
$150K-$400K
one-time + ongoing
Project management, business analysis, SME time, change management
Training & Support
$50K-$150K
annual ongoing
User training, change management, ongoing support, governance
The Payback Math: 5-Year Cumulative Value
Benefits don't realize at full value in Year 1—the integration ramps up, users adapt, and operational maturity builds over time. The 5-year cumulative view below shows the realistic value buildup that credible business cases present.
REALISTIC 5-YEAR VALUE REALIZATION
Cumulative Net Value Buildup by Year
Year 1 (Ramp-Up)
Investment
30% Value
Cost > Benefit
Year 2 (Acceleration)
Ongoing
80% Value
Payback
Year 3 (Full Realization)
Ongoing
100% Value
+1.5x ROI
Year 4 (Optimization)
Ongoing
100%+ Value
+3x ROI
Year 5 (Strategic Lift)
Ongoing
100%+ Value
+5x ROI
12-24 mo
Payback period for mid-size manufacturing operations
3-5x
Cumulative 5-year ROI multiple on initial investment
The Year 1 investment exceeds benefits—every credible business case shows this honestly. Payback typically lands in Year 2; cumulative ROI compounds from Year 3 onward. Operations leaders ready to model their own 5-year payback can Sign up free to build your 5-year payback model.
Risk Adjustments Every CFO Will Demand
The fastest way to lose CFO credibility is presenting unadjusted gross benefits as if they were certain. The fastest way to win it is preemptively applying the risk adjustments the CFO would have demanded—and showing the math both ways.
Adoption Risk: −20%
Users may not adopt at full rate. Haircut productivity and adoption-dependent benefits by 20% in conservative case.
Timeline Risk: +25% delay
Implementation may overrun. Push benefit realization out 3-6 months in conservative case to account for delays.
Realization Haircut: −30%
Apply across all benefit categories. Even after pillar-specific adjustments, an overall 30% reduction reflects execution uncertainty.
Strategic Benefits: 50% credit
Probabilistic benefits (risk mitigation, asset life) often credited at 50% to acknowledge their uncertain nature.
Present both versions: gross benefits as the operational expectation, risk-adjusted net as the financial commitment. The gap between them educates leadership on where execution discipline matters most. Operations leaders ready to build the risk-adjusted view can Book a free demo to walk through risk-adjusted scenarios.
Expert Perspective on Defensible Business Cases
"
The business cases I've seen sail through CFO review share a property that surprises maintenance leaders: they often show smaller total benefits than the cases that get rejected. That sounds counterintuitive until you watch the review meeting. The rejected case shows a $15M benefit number that nobody can trace to a calculation; the approved case shows an $8M risk-adjusted net that traces clearly through every step. The CFO doesn't care which number is larger—they care which number they can defend to the audit committee. Build the business case the CFO would have built if they ran maintenance. The total will be smaller. The approval rate will be far higher. And the actual delivered value will exceed what the rejected case promised because the discipline carries through into execution.
01
Smaller Numbers Win More Often
Conservative defensible totals beat ambitious unsubstantiated totals every time at the CFO level. Discipline beats advocacy.
02
Methodology Is the Real Product
The CFO is buying the methodology, not the number. A clear methodology earns approval; a vague conclusion earns delay.
03
Pre-Apply Risk Adjustments
Apply the risk adjustments the CFO would demand before they have to demand them. It signals you understand financial discipline.
90-Day Business Case Build Sequence
The 90-day build below produces a CFO-ready business case from a standing start. Each phase has a specific deliverable that builds the next.
90-DAY BUSINESS CASE BUILD
From Baseline Data to C-Suite Presentation
DAYS 1–25
01
Baseline Current State
Quantify downtime hours, MRO inventory, contractor spend, labor costs, incident history. Establish the data the pillars will be calculated against.
DAYS 26–50
02
Quantify Each Pillar
Apply methodology to each of the 8 pillars using your baseline data. Document assumptions explicitly. Sanity-check against industry benchmarks.
DAYS 51–75
03
Investment & Risk Adjustment
Build investment side with vendor quotes and internal cost estimates. Apply risk adjustments. Calculate gross and risk-adjusted versions.
DAYS 76–90
04
CFO Partner Validation
Walk through methodology with finance partner before formal review. Refine based on feedback. Build C-suite presentation deck with appendix.
BUILD YOUR CASE
Turn Operational Conviction Into Financial Defensibility
Eight pillars quantified. Investment honestly stated. Risk adjustments preemptively applied. The methodology that turns CFO skepticism into approval.
What's the typical payback period for SAP-CMMS integration?
Mid-size manufacturing operations typically see payback in 12-24 months, with the variance driven by current maintenance maturity, integration scope, and adoption speed. Organizations starting from low maturity (paper-based or basic CMMS) see faster payback because the improvement delta is larger. Organizations already running modern CMMS see longer payback because they're improving an already-functioning baseline. Single-plant operations payback faster than multi-plant networks because deployment costs are concentrated. Aggressive timelines below 12 months are achievable but require strong existing maintenance discipline and clear focus on the highest-ROI pillars first.
How conservative should our benefit assumptions be?
Conservative enough that you're confident defending the methodology, not so conservative that the business case becomes unattractive. The pattern that works: use industry-benchmark percentages for each pillar's improvement rate (e.g., 25% downtime reduction is conservative; 50% is aggressive), then apply an overall 30% risk-adjusted haircut on top. Present both gross and risk-adjusted versions to leadership. The CFO will respect the risk-adjusted version as the commitment number while understanding the gross version is the operational target. Underestimating across the board produces an unattractive case; overestimating produces a credibility crisis when reality diverges.
What do CFOs typically push back on most?
Three categories generate the most pushback: probabilistic benefits (risk mitigation, asset life extension) because the math involves estimating probability; productivity benefits because they assume freed time gets converted to value rather than absorbed as slack; and energy benefits because they require attributing savings to maintenance versus other factors. Pre-address each by showing your methodology, citing industry benchmarks, applying conservative assumptions, and clearly labeling probabilistic benefits as expected value rather than certain outcomes. The CFO appreciates the transparency far more than they appreciate larger but vaguer numbers.
Should we include intangible benefits like employee satisfaction?
Mention them but don't quantify them in the financial business case. Intangible benefits (employee satisfaction, brand perception, organizational learning) are real but resist defensible quantification. Listing them as "additional benefits not included in financial calculation" preserves credibility while acknowledging them. The CFO already discounts intangible claims; explicit honesty about not quantifying them earns more credibility than attempting to assign dollar values that won't survive scrutiny. The quantified eight pillars are sufficient to justify the investment; intangibles are supporting context, not load-bearing arguments.
How do we get the CFO involved early in the business case?
Approach the finance team during the methodology phase, not the presentation phase. A typical approach: "I'm building the business case for our SAP-CMMS integration. Before I finalize the numbers, I'd like to walk through the methodology with you to make sure it meets your standards." This positions finance as a partner rather than a gatekeeper. The finance partner will steer you toward assumptions and presentation choices that will survive C-suite review. Their fingerprints on the methodology become a strong endorsement when the formal review happens. The cost is a few hours of partnership time; the benefit is dramatically higher approval probability.