sap-integration-roi-calculator-template-maintenance

SAP–CMMS Integration ROI Calculator & Payback Template


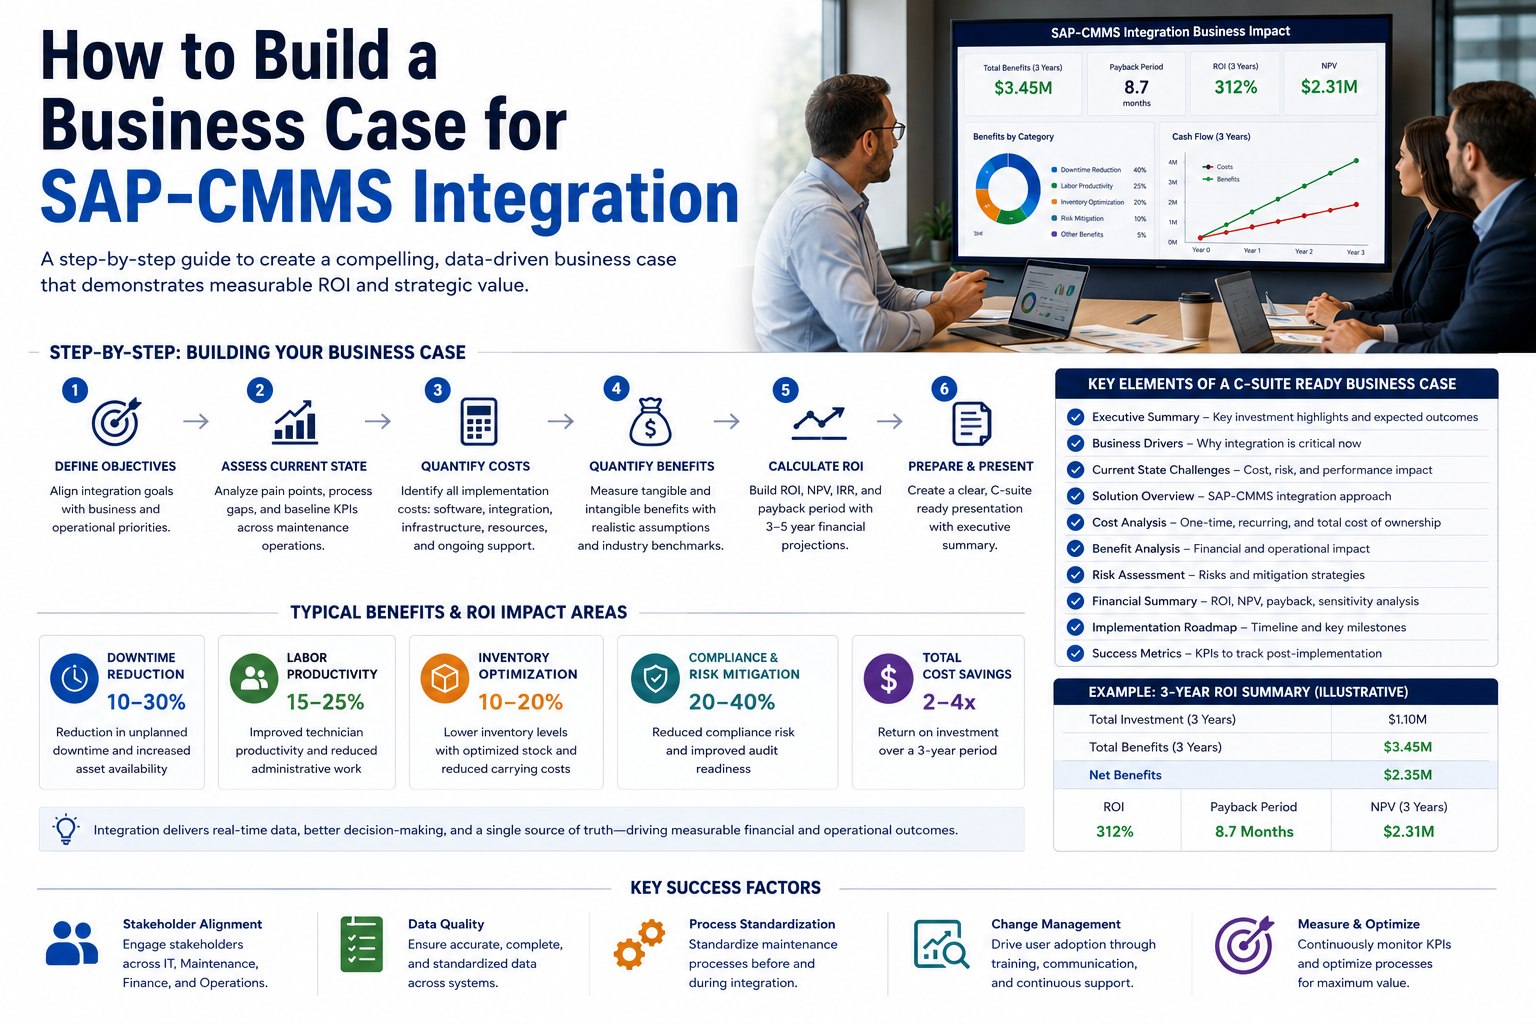
Every SAP-CMMS integration business case faces the same skepticism: "Where do these numbers actually come from?" Finance teams want bulletproof assumptions. Operations leaders want realistic projections. And vendors want to show favorable scenarios. The result is too often a spreadsheet that pleases nobody and convinces few. A rigorous ROI model strips out optimism and isolates the four value drivers that consistently deliver measurable returns: downtime reduction, labor productivity, inventory optimization, and asset life extension. Book a free demo to walk through this calculator with your operational numbers.

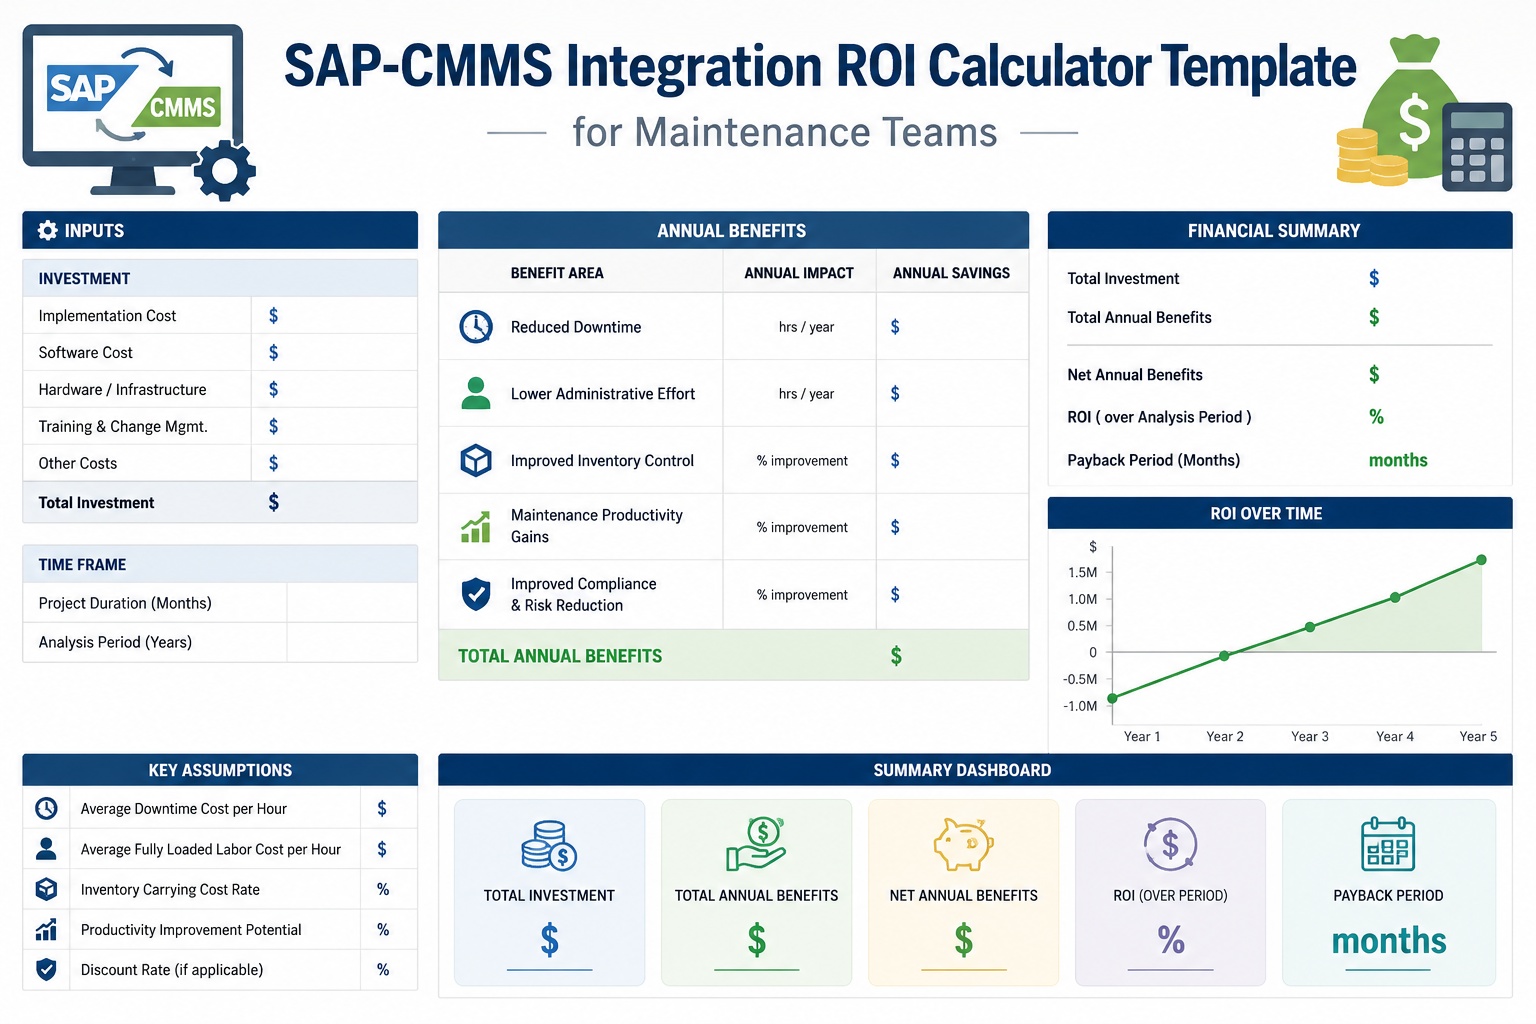
SAP-CMMS Integration ROI Calculator
Sample Mid-Size Operation
Your Inputs
Annual Downtime420 hrs
Cost per Hour$4,800
Maintenance Techs24
Spare Parts Inventory$2.4M
Implementation Cost$370K
Calculate
Annual Value
Downtime Reduction$284K
Labor Productivity$156K
Inventory Optimization$89K
Total Annual Value$529K
Payback
8.4mo
3-Yr ROI
487%

Why Most SAP-CMMS ROI Calculations Don't Hold Up Under Scrutiny

The first ROI model your CFO challenges is almost always wrong—and the second one too. Vendor-provided calculators tend to inflate savings using best-case scenarios from reference customers. DIY spreadsheets often miss entire value categories like inventory carrying costs or insurance premiums. According to Aberdeen Group's 2025 maintenance technology research, more than half of CMMS business cases fail their first finance review—not because the technology doesn't deliver, but because the calculation methodology doesn't withstand scrutiny. A defensible ROI model needs documented assumptions, conservative baseline data, and clear audit trails on every input.

54%
of CMMS business cases get rejected on first finance review for weak assumptions
3.8x
higher approval rate when ROI model uses operational baseline data vs vendor benchmarks
$2.1M
average gap between vendor-claimed and finance-approved 3-year savings

The template above isn't a marketing calculator—it's structured around the same line items finance teams audit during procurement review. Sign up free to access the ROI calculator template with your finance team's preferred input format.

The Four Value Drivers Every ROI Model Must Capture

Most ROI calculators get stuck on downtime savings—which is real, but represents only one of four distinct value streams. Operations that account for all four typically show 40-60% higher total returns than single-driver calculations. More importantly, four-driver models survive finance scrutiny because each value stream can be independently validated against historical data. The breakdown below shows typical contribution percentages from a $2M annual maintenance budget operation.

Four Value Drivers · Typical Contribution Breakdown
01
Downtime Reduction
42%
Predictive PM and faster MTTR cut unplanned downtime by 25-40% on average
02
Labor Productivity
28%
Mobile work orders, automated dispatch, and SAP sync free 15-25% of technician hours
03
Inventory Optimization
18%
Smart reorder points and parts visibility reduce carrying costs by 10-15%
04
Asset Life Extension
12%
Right-time maintenance extends critical asset life by 20-30% before replacement

Calculating Downtime Reduction Value

Downtime reduction is the largest single value driver in most calculations, but also the easiest to overstate. The conservative methodology starts with actual unplanned downtime hours from the last 12 months (not best-quarter data), multiplies by the contribution-margin cost per hour (not revenue per hour), then applies a realistic reduction percentage based on industry benchmarks for your starting maturity level. Operations starting from mostly reactive maintenance see 25-35% downtime reduction in year one. Operations already running structured preventive programs see 10-15% additional reduction from predictive analytics.

Formula 1
Downtime Reduction Value
Annual Value = Unplanned Downtime Hours × Contribution Margin per Hour × Reduction %
Sample Calculation
420 hours × $4,800/hr × 28% reduction = $564,480/yr
Use contribution margin (revenue minus variable costs), not full revenue, to avoid overstating downtime cost

Calculating Labor Productivity Savings

Labor productivity gains come from three sources: reduced wrench-time-to-search ratio when technicians have mobile access to procedures and parts data, eliminated double-data-entry between SAP and CMMS, and reduced administrative overhead from automated work order routing. The conservative calculation captures only directly recoverable hours—the time that gets reallocated to additional maintenance work rather than disappearing into general efficiency claims that finance teams correctly distrust.

Formula 2
Labor Productivity Savings
Annual Value = # Technicians × Annual Hours × Productivity Gain % × Fully-Loaded Rate
Sample Calculation
24 techs × 1,920 hrs × 18% gain × $52/hr loaded = $431,257/yr
Apply only the portion of recovered hours that get redeployed to productive maintenance work, not idle time

For operations modeling labor savings against shift schedules and overtime patterns, the calculator template handles seasonal variation and skill-level differences. Sign up free to model labor savings with your actual technician utilization data.

Calculating Inventory Optimization Returns

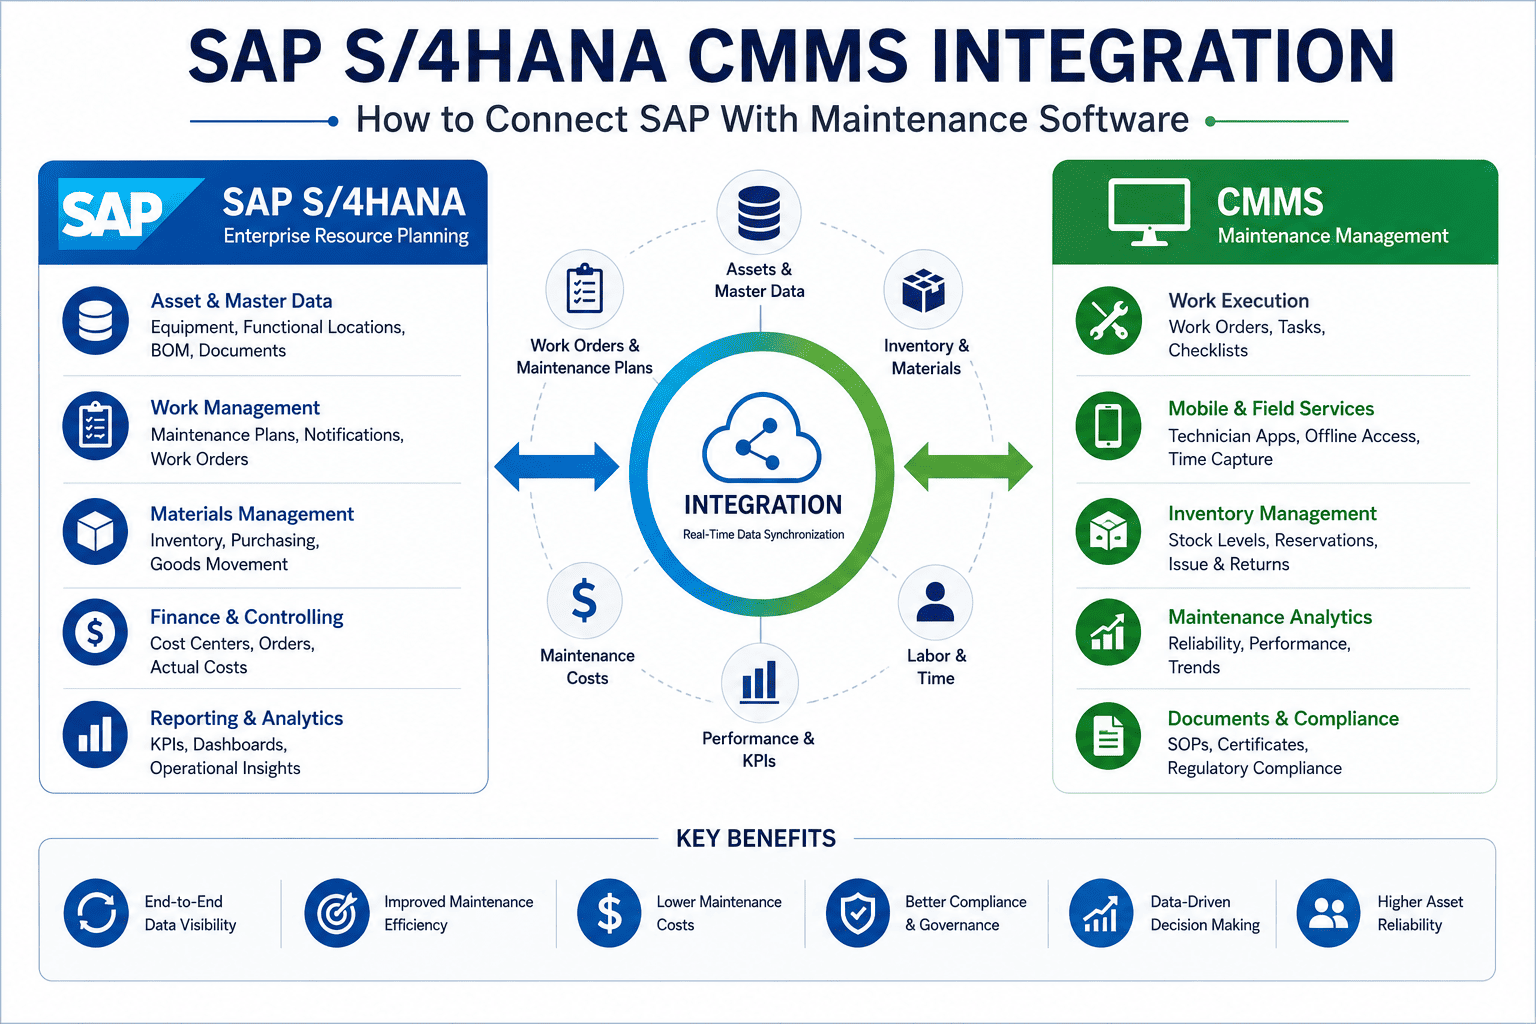
Inventory optimization is the most underrated value driver in CMMS business cases—and often the easiest to validate against historical data. SAP-integrated CMMS platforms reduce inventory carrying costs through three mechanisms: better demand visibility for reorder timing, parts standardization across plants, and elimination of duplicate stock pockets across departments. Manufacturing operations typically carry 10-25% more spare parts inventory than optimal because their MRP and maintenance systems don't share consumption data effectively. Closing that gap delivers immediate balance sheet impact plus ongoing carrying cost reduction.

Formula 3
Inventory Optimization Value
Annual Value = Total Spare Parts Inventory × Reduction % × Carrying Cost Rate
Sample Calculation
$2,400,000 × 15% reduction × 25% carrying = $90,000/yr
Carrying cost typically runs 20-30% annually including storage, obsolescence, capital cost, and insurance
Run This Calculator With Your Numbers
Stop building business cases in spreadsheets that finance rejects. Walk through this ROI template live with one of our specialists—we'll plug in your actual operational data and show defensible numbers in 30 minutes.

Putting It Together: Payback Period and 3-Year ROI

Once individual value drivers are calculated, the final outputs that matter to executives are payback period and multi-year ROI. Conservative business cases use straight-line payback (total investment divided by annual benefits) rather than discounted cash flow methods—finance teams can apply their own discount rates afterward. The scenarios below show typical payback periods and 3-year ROI percentages across operation sizes, based on the four-driver calculations from this template.

Payback Period & 3-Year ROI by Operation Size
Operation SizeAnnual ValueImplementationPayback3-Year ROI
Single Plant (50-150 assets)$185K$95K6.2 months484%
Mid-Size (3 plants, 500 assets)$529K$370K8.4 months329%
Multi-Site (8 plants, 1,500 assets)$1.42M$890K7.5 months378%
Enterprise (15+ plants)$3.8M$2.1M6.6 months443%

The pattern is consistent: well-executed SAP-CMMS integrations pay back inside 12 months and deliver 3-year ROI above 300% across operation sizes. Sign up free to generate your specific scenario using the full calculator template.

Expert Perspective: Building a Business Case That Survives Finance Review

The CFOs I work with don't reject CMMS business cases because the technology can't deliver. They reject them because the model uses vendor benchmarks instead of operational baselines, claims savings that nobody owns, and hides assumptions in formula fields. The business cases that get funded look boring—conservative reduction percentages, fully-loaded labor rates, documented historical baselines for every number, and a single named accountable for each savings stream. The boring business case wins approval; the exciting business case gets sent back for rework.
Use Operational Baselines
Every input should trace to actual operational data from the last 12 months—not vendor benchmarks or industry averages. Finance can verify operational data; they cannot verify benchmarks.
Name an Accountable Owner
Each value driver needs a named accountable who will track delivery against the business case. Unowned savings claims don't materialize and erode credibility for future projects.
Be Conservative on Year One
Apply 50-60% of theoretical year-one benefits to your model. Adoption curves don't deliver full value immediately, and conservative models build long-term trust with finance.

Teams ready to validate their ROI assumptions against peer operations can request a working session with our financial modeling specialists. Book a free demo to stress-test your business case against successful peer implementations.

Build a Business Case Your CFO Will Actually Approve
Skip months of spreadsheet iteration. Walk through this calculator with an operations specialist, get your numbers, and leave with a finance-ready business case in one session.

Frequently Asked Questions

How accurate are SAP-CMMS integration ROI calculators in practice?
Calculator accuracy depends entirely on input quality. Models using actual operational baselines (last 12 months of downtime, real technician headcount, current spare parts inventory) typically come within 15-20% of delivered results at the 24-month mark. Models using vendor benchmarks or industry averages routinely miss by 40-60% in either direction. The template here uses operational inputs rather than benchmarks specifically to deliver predictions finance teams can verify against historical data and that align with realized outcomes.
What's a realistic payback period for SAP-CMMS integration?
Across mid-size operations (3-8 plants, 500-2000 assets), payback periods cluster between 6-12 months when the four value drivers are properly captured. Smaller single-plant deployments often pay back faster (4-7 months) because implementation costs scale sublinearly. Enterprise multi-site deployments (15+ plants) tend toward 7-9 months despite larger implementation costs because value scales proportionally with the number of connected plants. Payback longer than 18 months typically signals either inflated implementation costs or undersized value capture.
Should soft savings like improved safety or compliance be included?
Include them in the narrative, not the calculation. Soft savings (improved safety incident rates, regulatory compliance reduction, employee satisfaction) are real but difficult to attribute specifically to CMMS integration. Including them in hard-dollar calculations weakens the entire business case because finance teams (correctly) discount unquantifiable claims. Reserve the calculation for the four hard-dollar drivers and discuss soft benefits separately as supporting context rather than inflating the financial model.
How do I justify implementation costs that exceed the calculator estimate?
Implementation cost variances usually come from underestimated integration complexity, change management requirements, or data migration scope. Three responses work in finance review: phase the implementation to align costs with value capture, document specific complexity drivers (multiple SAP instances, custom configurations, regulatory requirements) that justify the variance, or restructure as multi-year deployment with proportional value capture. Hiding cost overruns destroys credibility; transparently addressing them with specific reasons preserves it.
Can the same calculator work for SAP S/4HANA versus ECC environments?
The four-driver methodology applies identically to both S/4HANA and ECC environments, but specific calculation parameters differ. S/4HANA deployments typically show 10-15% higher labor productivity gains due to native OData APIs and embedded analytics. ECC environments may show higher inventory optimization value because legacy MRP integration gaps tend to be larger. The template accommodates both by exposing the underlying parameters rather than hardcoding values—change the productivity gain percentage based on your SAP version and integration architecture.


Share This Story, Choose Your Platform!