How Multi-Site Manufacturers Standardize Maintenance with SAP-CMMS Integration
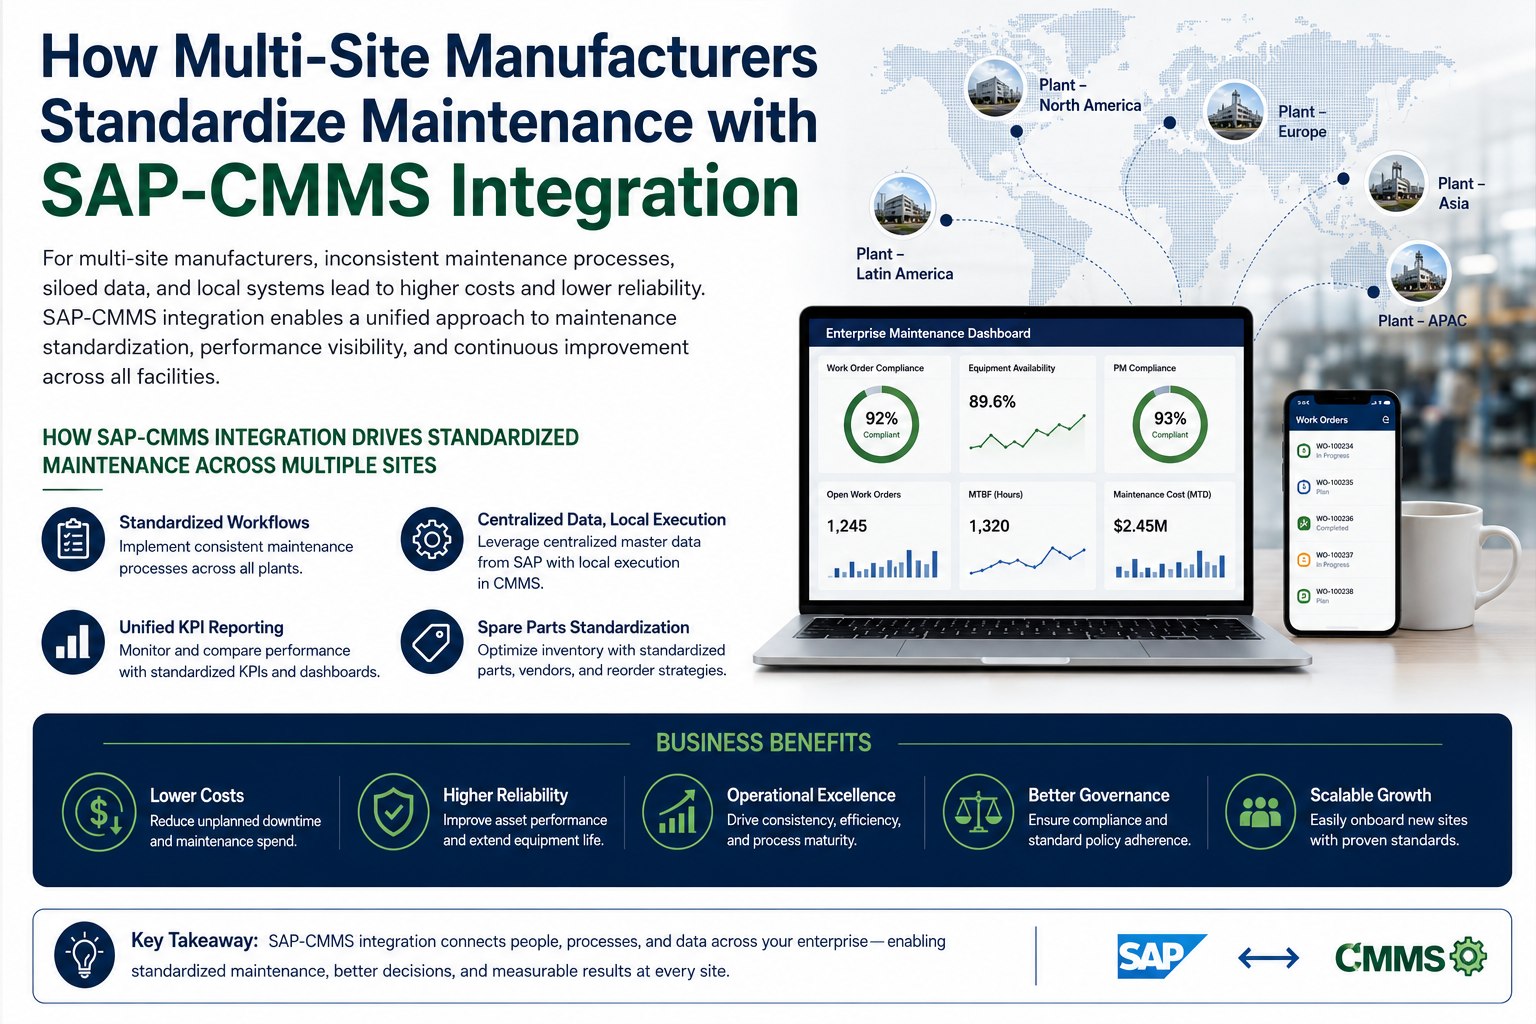
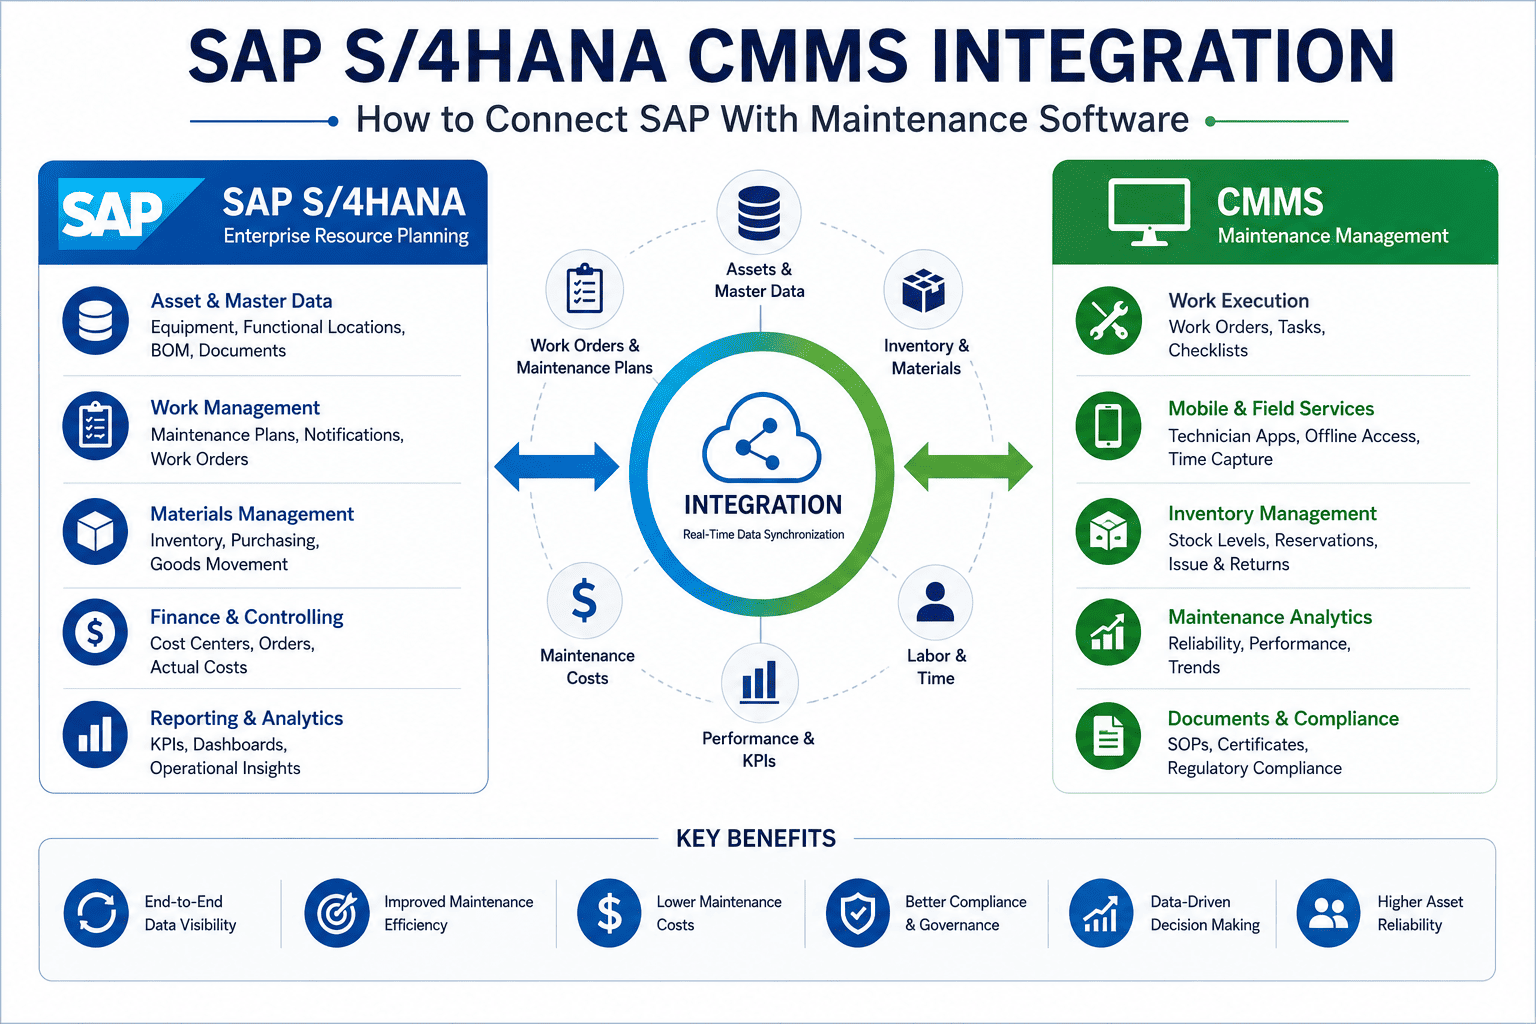
A manufacturer running ten plants doesn't have one maintenance operation—it has ten, each evolved separately with its own work order conventions, equipment classifications, spare parts categorization, and reporting cadences. Standardizing across the network sounds straightforward until you discover Plant A's "Critical" rating means something completely different from Plant B's. Multi-site SAP-CMMS integration is the architecture that closes these gaps without crushing the local autonomy that keeps plants agile. This article covers what to standardize, what to leave local, and how to roll it out. Book a free demo to see multi-site integration.
MULTI-SITE STANDARDIZATION REALITY
Ten Plants, Ten Operations—Until Architecture Connects Them
±35%
Plant Variance Without Standards
±8%
Variance With Integration
8
Dimensions to Categorize
3x
Faster New-Plant Deployment
Why Multi-Site Standardization Is Hard (and Why Most Companies Get It Wrong)
Most multi-site standardization programs fail at the same place: they try to standardize everything. The corporate maintenance team writes detailed procedures, mandates them across the network, and discovers within six months that plants have quietly created workarounds. The standards become shelf-ware. Performance variance returns. The next standardization initiative starts from scratch in three years.
The pattern that actually works inverts the question. Instead of asking "how do we standardize all maintenance?", successful multi-site programs ask "what specifically must be the same across plants, what can be templated, and what must stay local to plant culture and context?" The answer to that three-way question becomes the integration architecture. Maintenance leaders ready to assess standardization opportunity can Sign up free to assess multi-site standardization opportunities.
The Standardization Spectrum: Global, Template, or Local
Every maintenance dimension falls onto a spectrum from fully global to fully local. The three-tier framework below helps you place each one correctly—and stops the mistake of treating all standardization as binary.
GLOBAL
Same across every plant
Master data, KPI formulas, financial mappings. Differences here break enterprise reporting and cross-plant comparisons.
TEMPLATE
Standard pattern with local variation
Work order flow, PM plans, parts categorization. Common skeleton with plant-specific configuration on top.
LOCAL
Full plant autonomy
Daily operational cadence, contractor relationships, communication norms. Plant culture and context drive these choices.
The 8-Dimension Multi-Site Maintenance Standardization Matrix
The matrix below covers the eight maintenance dimensions every multi-site program must categorize. Each row shows the standardization tier and exactly what should be the same across plants versus what each plant should adapt locally. The boundary between standardize and adapt is what determines whether the program produces enterprise visibility or quiet plant rebellion.
8 DIMENSIONS · STANDARDIZE vs ADAPT
Multi-Site Maintenance Standardization Matrix
PHASE A · Always Global
PHASE B · Template + Local
PHASE C · Local Autonomy
01
Asset Master Data & Equipment Hierarchy ANCHOR · GLOBAL
Local contractor relationships · regional supplier networks · language and contracting norms
3Always Global
3Template + Local
2Local Autonomy
01Foundation Anchor
The discipline is preserving both sides. Plants that lose all autonomy stop owning their own performance; plants with no consistent standards stop comparing fairly. The matrix above gives each plant clarity on which decisions are theirs and which decisions belong to the corporate maintenance organization. Maintenance directors ready to apply the matrix to their network can Sign up free to map your plant network against the matrix.
SEE IT IN ACTION
Walk Through Multi-Site Architecture Live
30-minute demo showing the matrix configured across multiple plants—global master data flowing down, performance data flowing up, local autonomy preserved where it matters.
The Multi-Site Rollout Sequence That Actually Works
Big-bang multi-site rollouts fail predictably. The pattern that succeeds is wave-based: start with one pilot plant, validate the architecture, capture lessons, then scale through coordinated waves. The cost of moving slower at the start is far smaller than the cost of recovering from a failed enterprise-wide rollout.
Wave 0 · Pilot
1 plant
12 weeks
Architecture validated. All 8 dimensions configured. Lessons documented.
Wave 1 · First Group
3 plants
8 weeks each
Apply pilot lessons. Build replication playbook. Validate scalability.
Wave 2 · Acceleration
5 plants
6 weeks each
Run two plants in parallel. Playbook proven. Local teams onboarded.
Wave 3 · Network Complete
remaining
4 weeks each
Three plants concurrent. Governance fully operational. Optimization begins.
The wave cadence compresses naturally as the playbook matures. Plant 1 takes 12 weeks; plant 10 takes 4 weeks. The acceleration isn't because the work gets less—it's because the rework gets eliminated. Multi-site leaders ready to scope a wave-based rollout can Sign up free to scope your wave-based rollout plan.
ROI of Disciplined Multi-Site Standardization
Multi-site standardization produces compounding returns: each plant becomes faster to deploy, easier to compare, cheaper to operate, and more valuable to the enterprise. The performance delta below shows the dimensions where the impact is most visible.
FRAGMENTED PLANTS vs INTEGRATED NETWORK
Multi-Site Operating Performance Delta
Time to Deploy New Plant
18 mo
6 wk
−85%
Plant Performance Variance
±35%
±8%
−77%
Inventory Carrying Cost
Baseline
−25%
−25%
Enterprise Reporting Cycle
8 days
Same-day
−87%
Cross-Plant Best Practice Transfer
Never
Continuous
Live
12-18 mo
Typical payback period for 5-10 plant network standardization
$2-5M / yr
Annual recurring benefit per 10-plant network from standardization
The biggest gain isn't any single metric—it's network learning. When ten plants run on consistent architecture, a practice that improves Plant A's MTBF can be tested at Plant B in weeks rather than years. The network becomes a learning system. Operations leaders ready to model network learning value can Book a free demo to model network learning value.
Expert Perspective: What Distinguishes Successful Multi-Site Programs
"
The multi-site standardization programs I've seen succeed share an unusual property: the corporate maintenance team spends more time explaining what they're NOT standardizing than what they are. They make local autonomy explicit—daily operations cadence stays local, contractor relationships stay local, plant culture stays local. By being explicit about what won't change, they remove the existential anxiety plant managers feel when standardization rolls out. The plants resist standardization not because they think the standards are bad but because they fear losing all autonomy. When the boundary is clear, resistance evaporates and the actual standardization work moves quickly. The programs that fail are the ones that vaguely promise to standardize 'everything' and then act surprised when plants quietly preserve their autonomy through workarounds.
01
Explicit About What's Not Standardized
Local autonomy needs to be explicitly preserved, not implicitly assumed. Plants resist when boundaries are vague.
02
Pilot Plant Earns Credibility
A successful pilot is worth more than a thousand-page playbook. Other plants follow leaders, not directives.
03
Network Effects Compound Late
The first few plants show modest gains. Plants 5-10 show outsized gains because cross-plant learning kicks in.
90-Day Multi-Site Standardization Roadmap
The 90-day phase below establishes the architecture, the pilot plant, and the playbook foundation. It produces operational readiness for the wave-based scale that follows.
90-DAY FOUNDATION ROADMAP
From Network Assessment to Pilot Plant Operational
DAYS 1–20
01
Network Assessment & Architecture
Survey all plants on 8 dimensions. Identify pilot plant. Define global standards, template scope, and local autonomy boundaries.
DAYS 21–45
02
Corporate Master Data Harmonization
Build corporate master data dictionary. Harmonize equipment classifications, cost centers, KPI formulas. Sign off with plant leadership.
DAYS 46–70
03
Pilot Plant Configuration
Deploy full architecture at pilot site. Validate all 8 dimensions configured. User training and adoption support. Initial KPI baselines captured.
DAYS 71–90
04
Playbook & Wave 1 Readiness
Document pilot lessons. Build replication playbook. Identify Wave 1 plants. Prepare network governance structure for scale phase.
By day 90, the pilot plant operates the standardized architecture, the playbook captures what worked and what needed adjustment, and Wave 1 plants are ready to begin their own 8-week deployments. The first proven plant becomes the credibility foundation for the rest of the network—what comes next is replication discipline rather than discovery work.
CONNECT YOUR NETWORK
Turn Ten Plants Into One Maintenance Operation
Global standards where they create value. Local autonomy where it preserves agility. Network learning that compounds across the entire footprint.
How many plants is the minimum for needing this architecture?
Multi-site architecture starts paying back at three plants and produces increasing returns through ten or more plants. With two plants, ad-hoc coordination usually works; with three to four plants, the variance starts becoming visible to corporate leadership and the architecture begins paying for itself; from five plants up, the architecture becomes a competitive necessity. Organizations with greenfield expansion plans should establish architecture before reaching three plants—retrofitting standardization is significantly more expensive than building it in from the start.
Should we standardize everything or just some things?
Just some things—but the right ones. The 8-dimension matrix in this article identifies which dimensions must be global (master data, KPI formulas, financial mappings), which should be template-based with local variation (work order flow, PM plans, parts categorization), and which should stay fully local (daily operational cadence, contractor relationships). Trying to standardize everything produces resistance and shelf-ware standards. Standardizing nothing produces fragmentation that compounds over time. The matrix gives you the boundary that creates value without breaking plant autonomy.
How do we handle plants in different countries with different regulations?
Regulatory differences strengthen rather than weaken the case for the standardization matrix. Most regulations apply to specific dimensions (safety protocols, environmental reporting, labor practices) and slot naturally into the appropriate tier: safety standards typically global with local additions, environmental reporting typically template with local regulatory adaptations, labor practices typically local. The matrix accommodates regulatory variation by design—each dimension's tier identifies where global compliance ends and local regulatory adaptation begins. Organizations operating across regulatory regimes find the matrix easier to maintain than ad-hoc compliance management.
What if one plant strongly resists standardization?
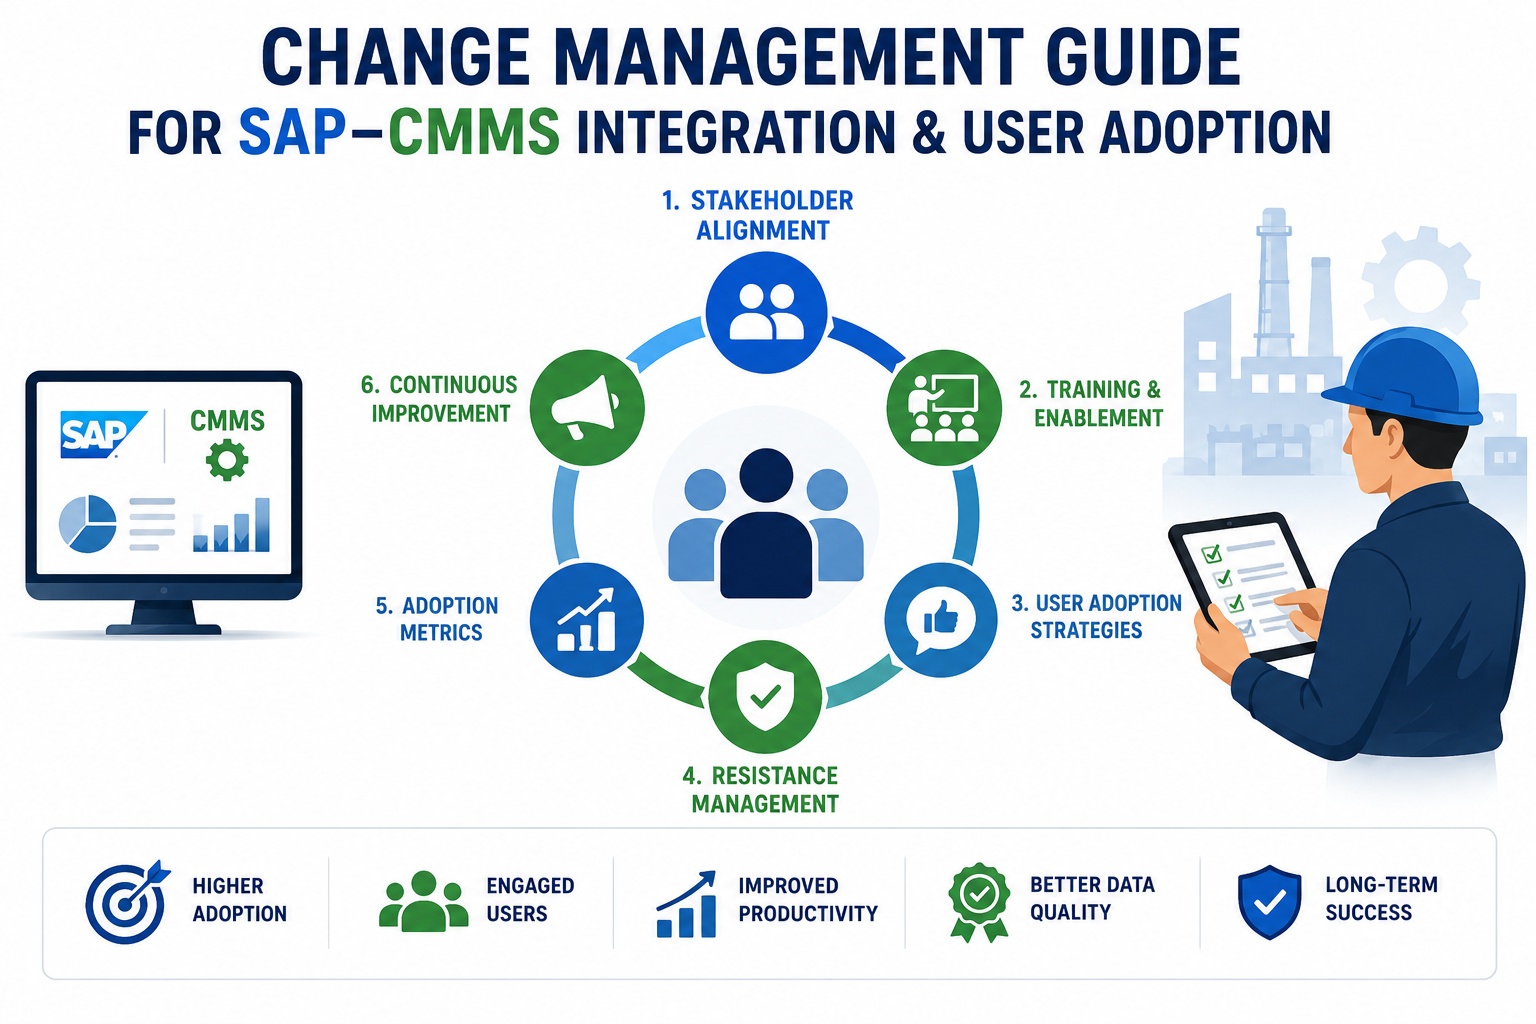
Resistance is almost always a signal that something genuine is at risk. Investigate before negotiating. Often the resisting plant has discovered something that works locally for context-specific reasons—and that local discovery should inform the corporate template rather than being overridden by it. If resistance is purely cultural (familiar process feels safer), the answer is structured change management, pilot evidence from other plants, and explicit preservation of the specific autonomy they value. The plants that resist most before launch frequently become the strongest advocates after their concerns are addressed.
How do we measure success of the standardization program?
Five metrics capture multi-site standardization success: (1) variance reduction across plants for harmonized KPIs, (2) time-to-deploy for new plants, (3) cross-plant best practice transfer rate, (4) corporate reporting cycle compression, (5) plant manager satisfaction with autonomy preservation. The fifth metric is often overlooked but matters enormously—a standardization program that destroys plant autonomy may show good corporate numbers in year one and quiet collapse in year three. All five metrics together tell the honest story of whether the architecture is producing both standardization benefits and preserved local ownership.