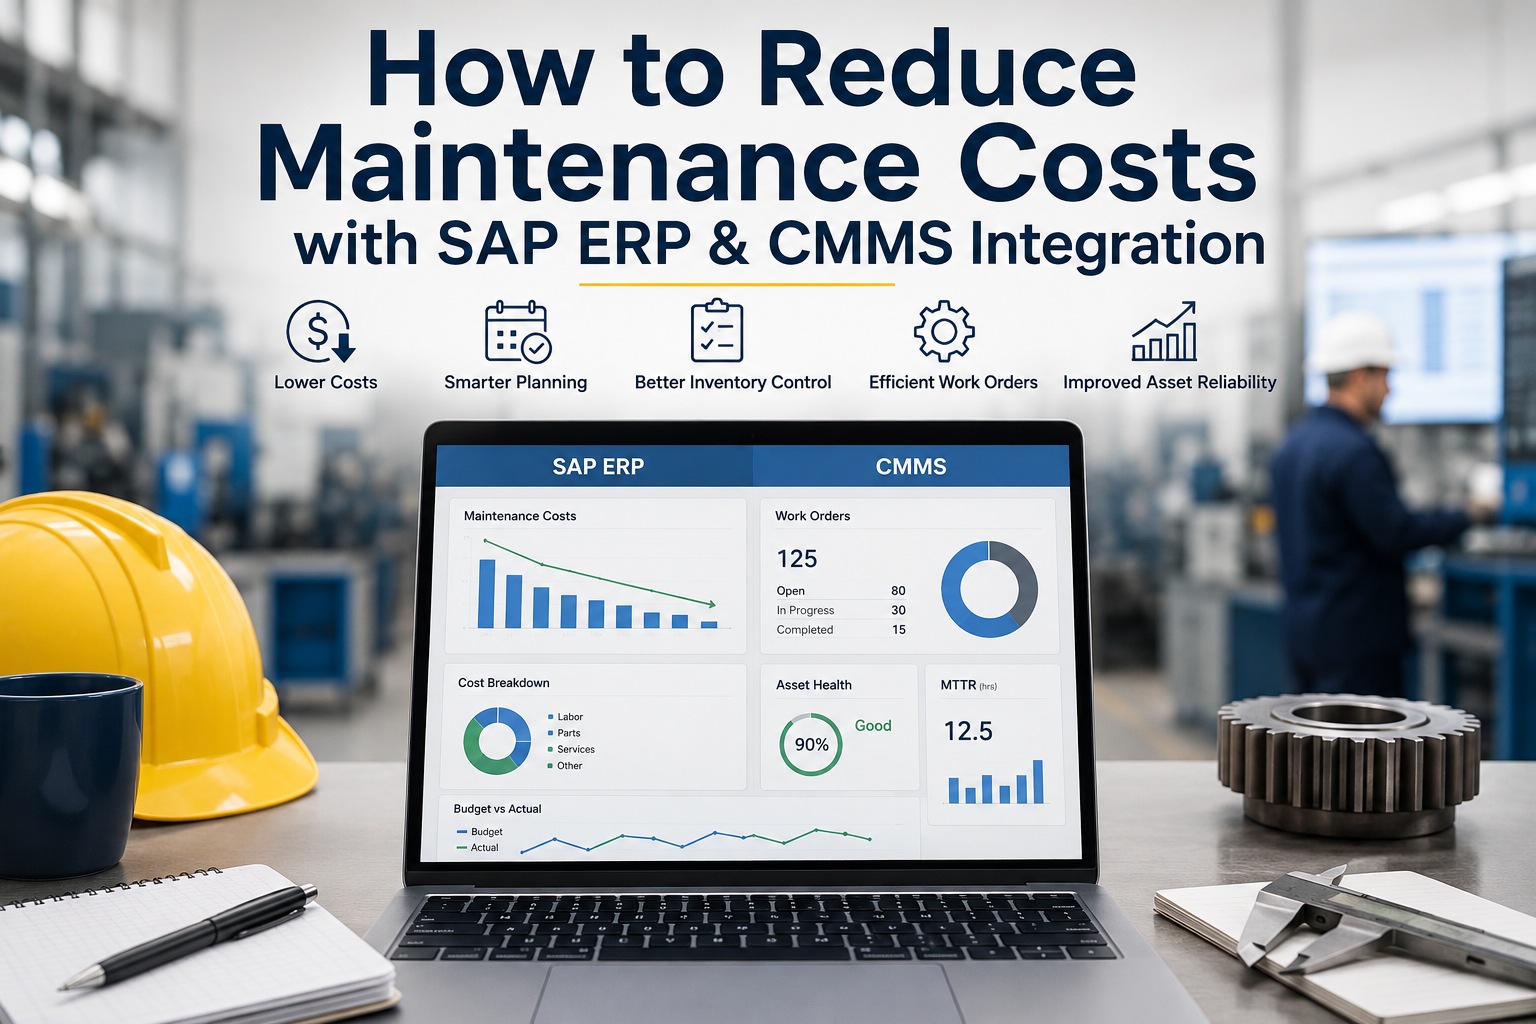
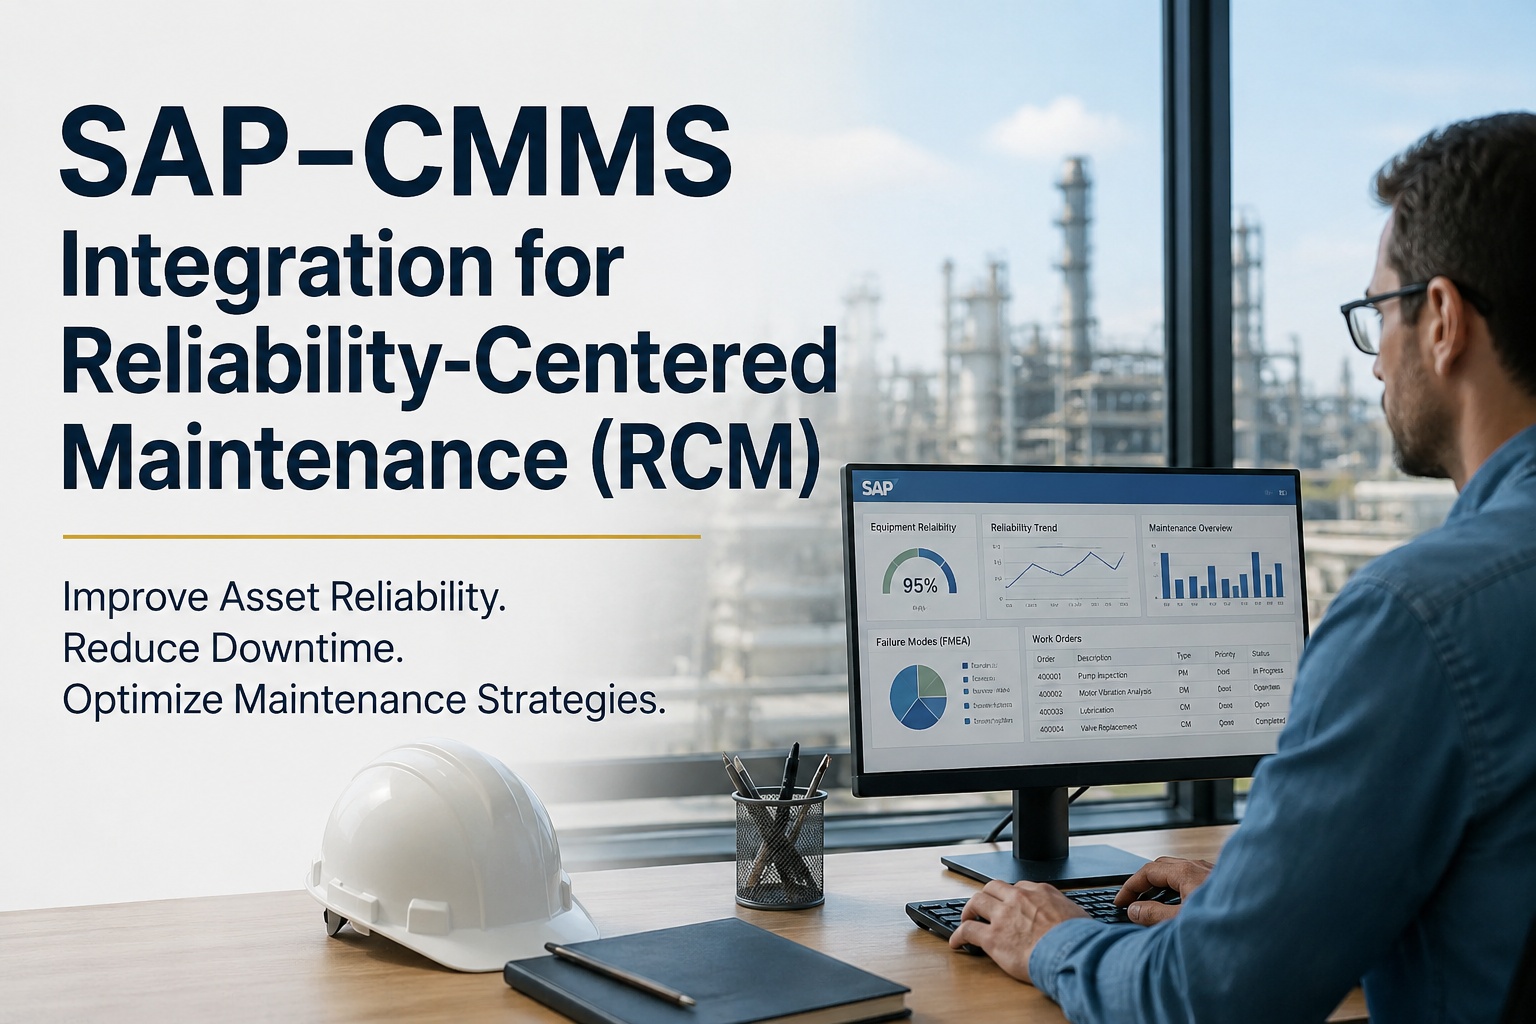
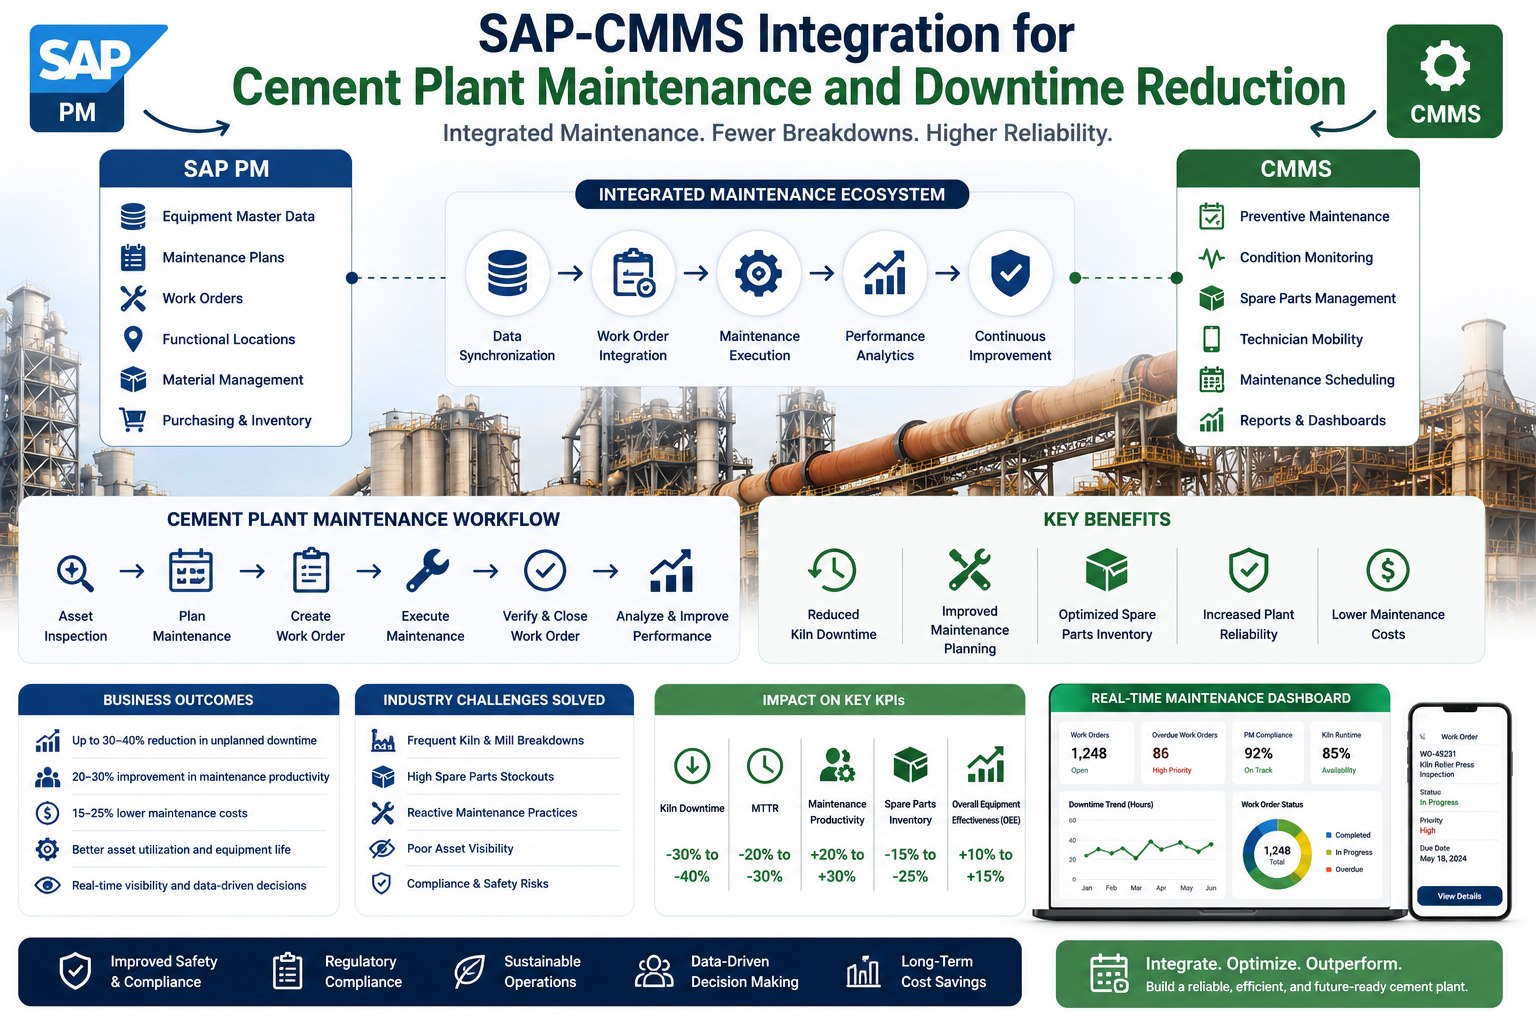
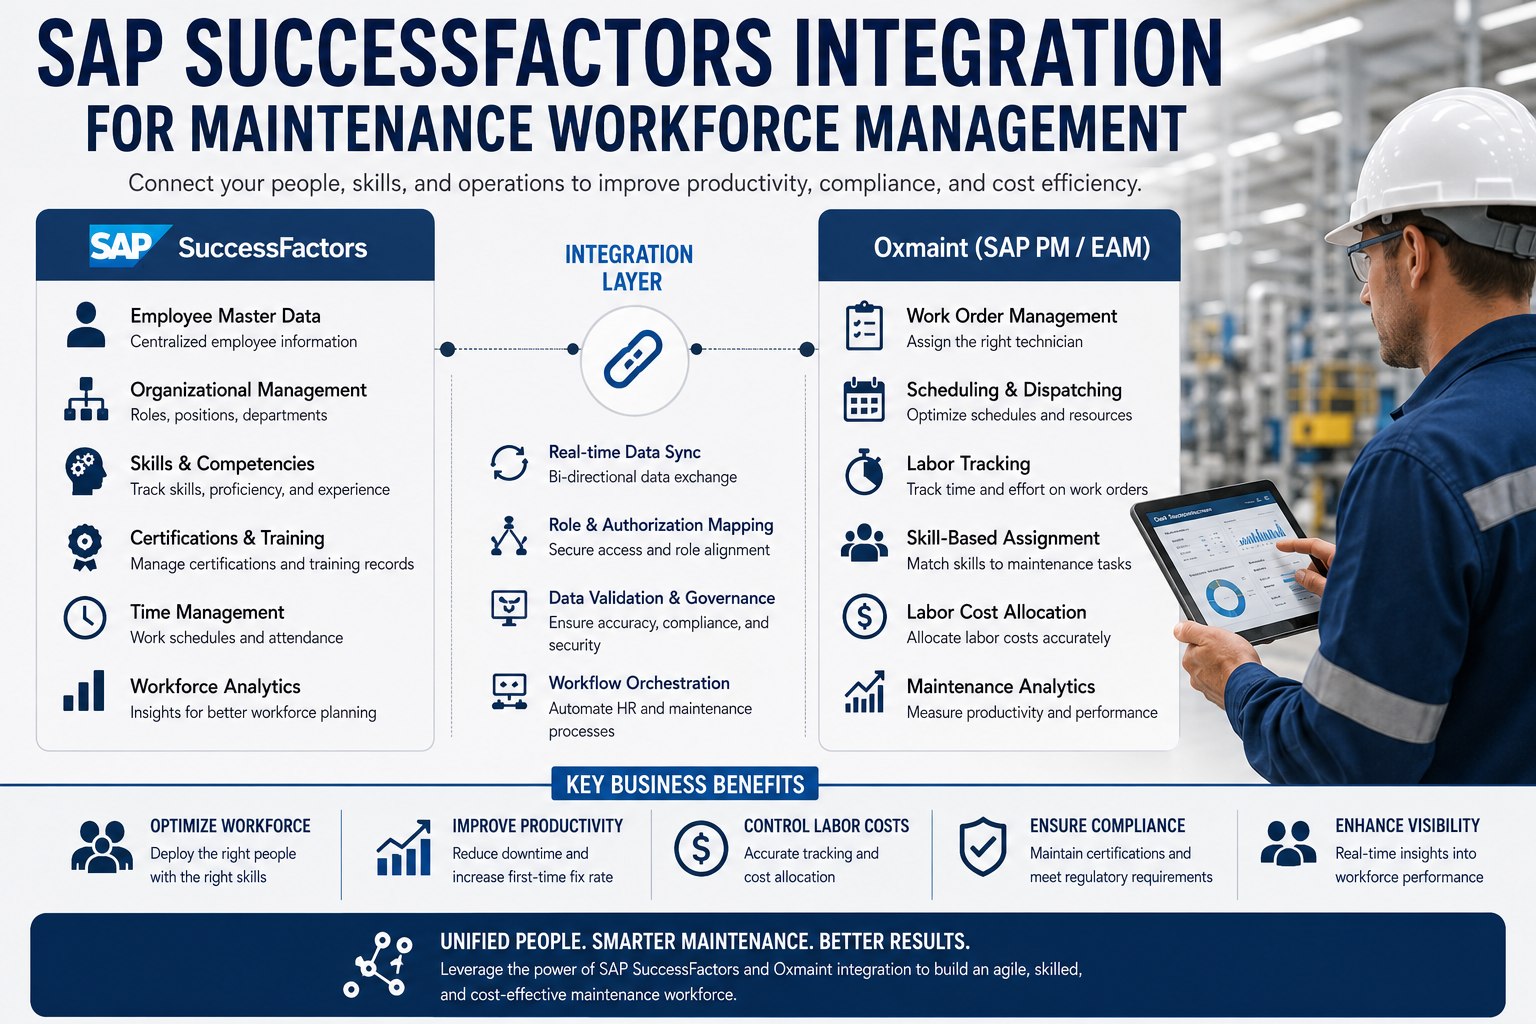
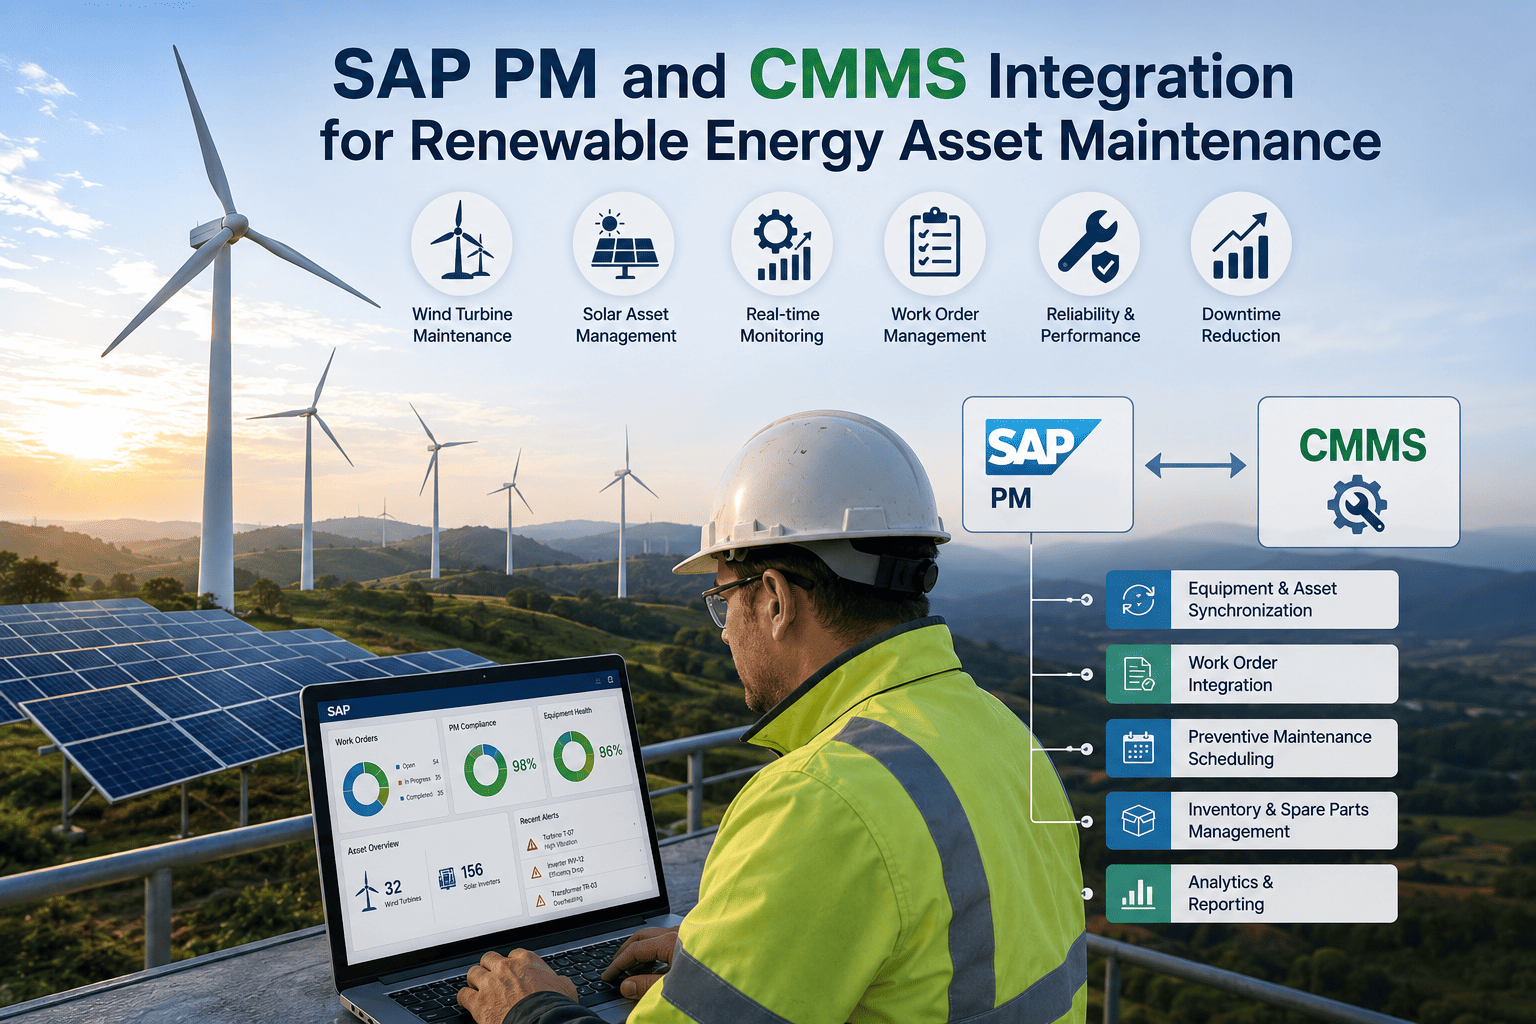
How to Reduce Maintenance Costs with SAP ERP & CMMS Integration
Your maintenance budget is probably 15-40% larger than it needs to be. Not because your team isn't working hard—but because disconnected systems force them to work hard at the wrong things. Hours spent finding parts that should be visible at a glance. Emergency repairs that could have been scheduled weeks earlier. Inventory carrying costs that exist because nobody trusts the master data. SAP ERP and CMMS integration eliminates these structural inefficiencies. Book a free demo to see where integrated maintenance operations cut costs in your operational profile.
Where Integration Cuts Maintenance Cost · Sample $2.4M Operation
Annual cost reduction breakdown by driver—mid-size manufacturing baseline
Traditional cost reduction approaches—hiring freezes, parts inventory cuts, deferred maintenance—often look successful for two quarters and disastrous within twelve months. Cutting inventory creates emergency expedited shipping. Deferring maintenance creates catastrophic failures. Reducing technician headcount creates overtime that exceeds the original labor cost. These approaches fail because they treat symptoms, not structure. McKinsey's 2025 maintenance benchmarking study found that operations achieving sustained cost reduction share a common pattern: they fix structural inefficiencies through integration, not by squeezing inputs that immediately rebound elsewhere.
15-40%
typical structural inefficiency in maintenance budgets at SAP-disconnected operations
46%
average maintenance cost reduction across full SAP-CMMS integration programs
9.2mo
median time to recover integration investment through measured cost reduction
The pattern repeats across industries: cost reductions achieved through integration stick because they remove waste from the system, while reductions achieved through cuts come back as surprises within a year. Sign up free to model these savings against your specific maintenance budget structure.
The Five Cost Drivers SAP-CMMS Integration Actually Reduces
The five categories below account for more than 90% of cost reduction in successful SAP-CMMS integration programs. Notice that "headcount reduction" isn't on the list—integration rarely reduces headcount, but it dramatically improves what existing teams accomplish with the same staffing. Each driver delivers different magnitudes of savings depending on starting maturity, but all five compound when implemented together.
Cost Drivers · Ranked by Typical Savings Contribution
01
Unplanned Downtime Reduction
35%
Predictive PM and faster MTTR cut emergency events 25-40%—largest single source of integration savings
02
Labor Productivity
23%
Mobile workflows, eliminated dual entry, and automated dispatch recover 15-25% of technician hours
03
Inventory Optimization
15%
Smart reorder points and parts visibility reduce carrying costs 10-15% while improving availability
04
Asset Life Extension
10%
Right-time maintenance extends critical asset life 20-30% before capital replacement is needed
05
Energy & Resource Efficiency
8%
Asset health-driven operation cuts energy waste from degraded equipment running outside spec
Cost Driver 1: Unplanned Downtime (35% of Total Savings)
Unplanned downtime is the most expensive line item in any maintenance budget—and the most underestimated. The visible cost is the emergency repair invoice. The hidden costs are larger: lost production margin, expedited parts shipping, overtime labor, quality losses from restart, and damage to adjacent equipment. SAP-CMMS integration attacks downtime through two mechanisms: predictive PM that catches failures during planned windows instead of production runs, and faster MTTR when failures do occur because technicians arrive with the right parts, procedures, and asset history. Operations completing both mechanisms see 25-40% reduction in unplanned downtime events within the first 12 months.
Cost Driver 2: Labor Productivity and Wrench Time
Industry studies consistently find that maintenance technicians spend only 25-35% of their shift on actual wrench-time—the rest disappears into finding parts, looking up procedures, traveling between sites, entering data into multiple systems, and waiting for clarifications. SAP-CMMS integration recovers a meaningful portion of this lost time through mobile work order delivery, embedded procedures with parts pre-staged, automated time confirmations, and elimination of dual data entry between SAP and the CMMS. Recovered hours typically run 15-25% of technician time—and importantly, that recovered time gets redeployed to productive maintenance rather than disappearing into general efficiency.
Most operations underestimate wrench time recovery because they've never measured baseline current state precisely. Sign up free to benchmark your wrench time against integrated peer operations.
Cost Driver 3: Spare Parts Inventory Optimization
Spare parts inventory typically carries 10-25% more stock than optimal because MRP and maintenance systems don't share consumption data effectively. Each department holds buffer stock to protect against the other system's blind spots. SAP-CMMS integration eliminates these buffer pockets through unified demand signals: when a planner schedules a PM in the CMMS, MRP sees the parts requirement immediately. When a technician issues parts on the floor, both systems update simultaneously. The result is 10-15% reduction in carrying costs plus improved parts availability—an unusual combination because traditionally these metrics trade off against each other.
See These Savings Against Your Operation
Generic case studies are interesting. Numbers from your actual operational profile are what matter to your CFO. Walk through this cost reduction analysis with our team using real input data from your maintenance budget.
Building the Cost Reduction Roadmap: 12-Month Phased Approach
Cost reduction doesn't arrive all at once—it builds in waves as integration capabilities come online. The phased roadmap below reflects what successful operations actually do, sequenced so quick wins fund deeper investments. Each phase delivers measurable savings while building toward the next phase's capability requirements. Operations that try to compress this timeline below 6 months consistently report disappointing results because foundation work gets rushed.
12-Month Cost Reduction Roadmap
Phased savings accumulation by quarter
Q1
Foundation
$180K
Mobile work order rollout, SAP master data sync, baseline KPI dashboards · Quick-win savings from labor productivity
Q2
Optimization
$340K
PM compliance programs, inventory reorder optimization, automated work order routing · Inventory and labor savings compound
Continuous improvement cycles, multi-plant benchmarking, asset life extension programs · All five drivers contributing
12-Month Cumulative Savings
$1.1M
Operations following this phased approach typically realize cumulative 3-year savings of $3.5-4.2M against a $370-450K implementation investment. Sign up free to map your specific roadmap with quarterly savings projections.
Expert Perspective: How High-Performance Operations Outperform on Cost
The maintenance operations that consistently outperform on cost share a counterintuitive characteristic: they don't focus on cost reduction. They focus on operational excellence, and cost reduction follows automatically. When you obsess over cutting costs, you create the brittle behaviors that drive future costs up—deferred maintenance, inventory cuts, headcount squeezes. When you obsess over reliability, predictability, and execution discipline, costs come down as a natural consequence. The integration unlocks this because it gives operators the visibility and tools to drive excellence at scale. Cost reduction becomes the outcome of good operations, not the goal.
Pursue Excellence, Not Cuts
Operations targeting reliability and execution discipline see costs decline naturally. Operations targeting cost cuts see brittle behavior emerge and costs rebound.
Compound the Drivers
No single cost driver delivers transformative savings—all five compound together. Operations focused on just downtime or just inventory underdeliver consistently.
Measure Honestly, Quarterly
Track each driver's contribution to savings quarterly with named ownership. Programs without quarterly accountability drift back to baseline within 18 months.
Teams ready to build a cost-reduction business case grounded in their specific operational profile can request a working session with our team. Book a free demo to model your cost reduction against operational baseline data.
Stop Paying for Disconnected Systems
Every month that SAP and your CMMS remain disconnected costs your operation real money. Run the cost reduction analysis against your actual numbers and decide if integration makes sense for the next twelve months.
How long before SAP-CMMS integration actually starts reducing costs?
Quick-win savings from labor productivity typically appear within 90 days of go-live as mobile workflows and dual-entry elimination reach operating teams. Inventory savings show up in months 3-6 as reorder optimization compounds. Downtime savings—the largest category—generally take 9-12 months because they require predictive PM patterns to mature against historical baseline data. Operations expecting transformative cost reduction in the first six months often abandon programs too early; cost reduction follows the operational improvement curve, which takes a full year to mature.
Can SAP-CMMS integration reduce costs without reducing headcount?
Yes, and this is typical rather than exceptional. The cost savings from integration come primarily from doing more with the same team rather than reducing the team. Recovered technician hours get redeployed to additional planned maintenance, reducing the emergency work that drives overtime and contractor costs. Most operations preserve their maintenance headcount while substantially expanding the scope of work the existing team can execute—which is usually the more sustainable outcome anyway given how difficult it is to rebuild maintenance teams after cuts.
Which cost driver should we prioritize first for fastest ROI?
Labor productivity nearly always delivers the fastest measurable ROI because mobile workflow improvements show up in technician time-on-task within weeks of rollout. Inventory optimization follows close behind because reorder pattern improvements compound monthly. Downtime reduction delivers the largest savings but takes longer to materialize since it requires predictive patterns to mature. The optimal sequence is exactly the phased approach above: foundation and labor first, inventory second, predictive capabilities third, continuous improvement fourth.
How do you measure cost reduction in a way finance teams actually trust?
Use operational baselines from the 12 months preceding integration, never industry benchmarks. Track each cost driver separately with named accountable ownership and monthly variance reporting. Finance teams trust comparisons to operations' own historical data far more than vendor case studies or industry averages. The strongest cost reduction reports show actual current-month spend versus baseline-period spend, broken down by the five driver categories, with brief root-cause notes on variance. This format survives the quarterly business review that defends the integration investment.
What's the biggest mistake operations make pursuing cost reduction through integration?
Cutting maintenance budget prematurely based on projected savings. The savings are real but they don't materialize evenly across the year. Operations that cut budget at month 3 based on full annual projections create cash flow stress that derails the integration program itself—reducing the very investment that was supposed to deliver the savings. The disciplined approach reduces budget only after each quarter's savings are measured and validated, locking in 60-70% of measured savings while reinvesting the rest into deepening the integration capability.