sap-cmms-project-plan-template

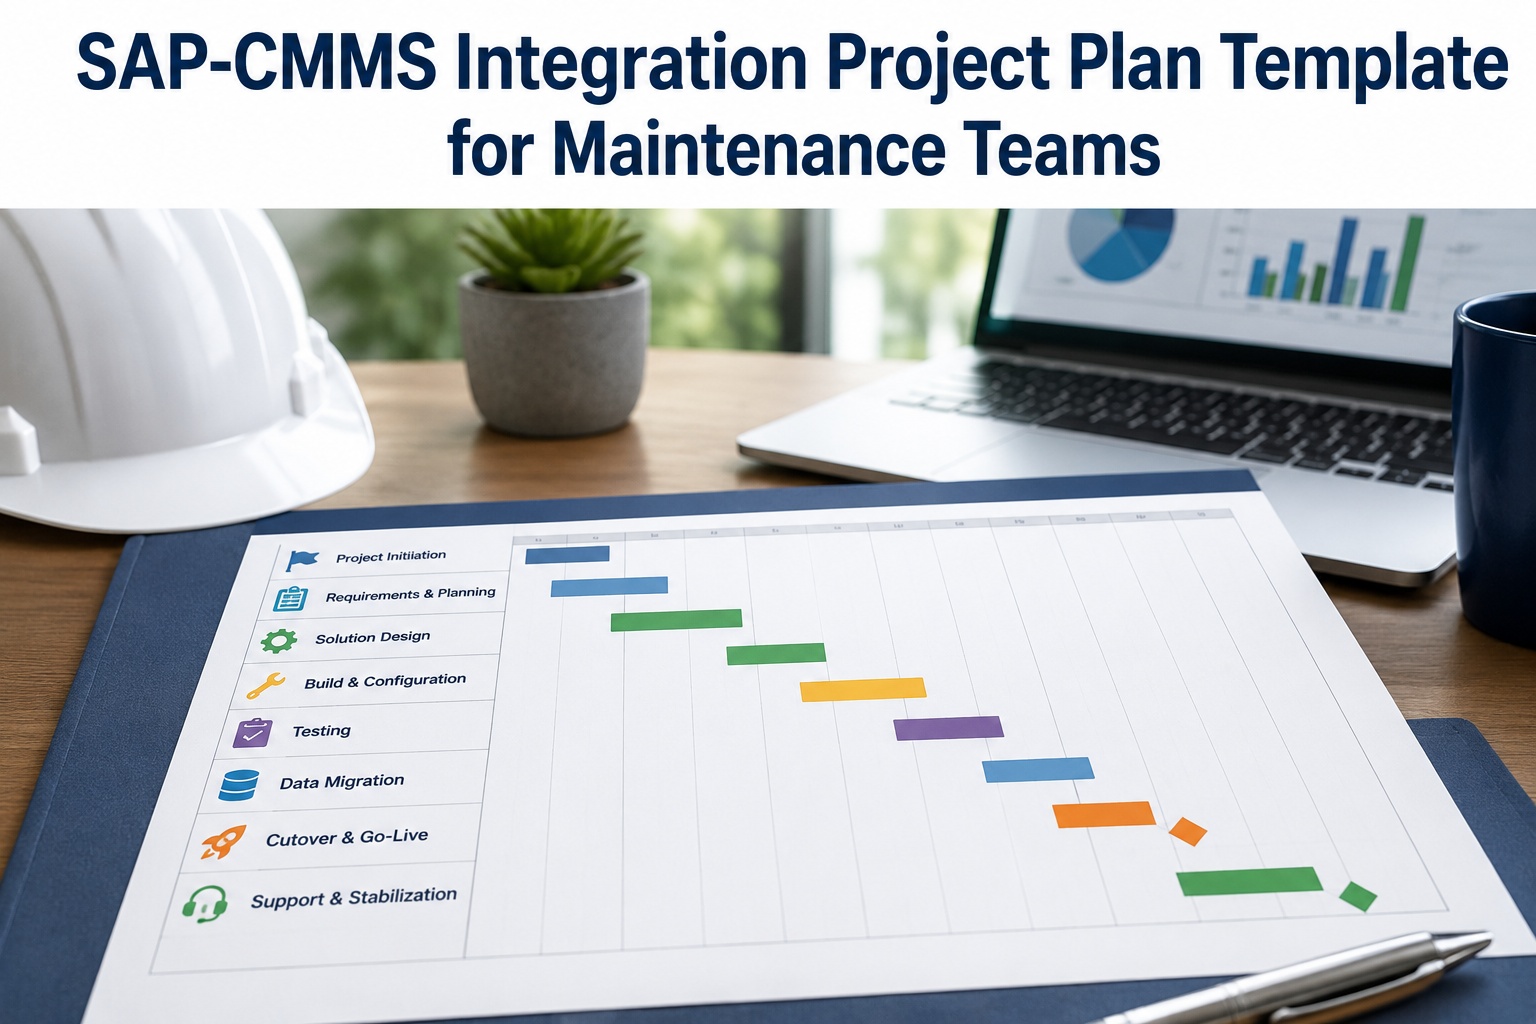
SAP-CMMS Integration Project Plan Template for Maintenance Teams


SAP-CMMS integration projects fail not because they hit unexpected obstacles—they fail because their plans were never structured to anticipate the obstacles that always show up. Discovery is rushed. Design freezes leak. Testing reveals defects that should have been caught in build. Cutover discovers data quality issues that should have been resolved months earlier. Hypercare extends because production doesn't behave like the test environment did. This 52-week, seven-phase project plan template covers what disciplined programs follow from kickoff through optimization. Book a free demo to walk through the template on a current program.

Integration Project Reality
Why Project Plan Discipline Determines Outcomes
7
Sequential phases covering the full integration program from kickoff to BAU transition
Source: This template
52 wks
Typical full-program duration for mid-complexity SAP-CMMS integrations
Source: Industry benchmarks
60-75%
Of SAP integration projects exceed initial budget or schedule due to planning gaps
Source: ERP project research
6
Quality gates separating phases; each gate produces signed evidence before progression
Source: This template

Why Most SAP-CMMS Integrations Underrun Their Plan

The pattern is consistent: a project plan looks reasonable at kickoff, makes optimistic progress through discovery and design, then unravels somewhere between build and cutover when accumulated unresolved decisions catch up with the program. The root cause is almost never technology. It's that the plan was structured around milestones (when things happen) without explicit phase exit criteria (what evidence is required to progress). When the exit criteria are absent or weak, phases close prematurely, defects propagate into later phases, and the cost of remediation grows exponentially with each phase the issue carries.

The discipline that distinguishes successful integration programs is treating each phase as a deliverable production unit with explicit inputs, outputs, owners, and quality gates. The phase doesn't close because the calendar says it should. It closes because the exit criteria evidence is signed off by the named approver, and the next phase has what it needs to begin. Program managers ready to operationalize this discipline on a current project can Sign up free to deploy the phase-gated template on an active integration.

The SAP-CMMS Integration Project Plan Template

The template below shows the seven phases with key deliverables, milestones, owner roles, and exit criteria per phase. The 52-week duration is typical for mid-complexity integrations; longer or shorter programs adjust phase durations proportionally while preserving the same phase structure and quality gates. The discipline that produces predictable outcomes is in the phase gates, not the calendar dates.

DOC-PMO-001
Rev 2.4
Approved Template
SAP-CMMS Integration Project Plan Template
7 Phases · 52-Week Baseline · 6 Quality Gates · Phase-Gated Progression
PROGRAM TIMELINE · WEEK
W1
W4
W12
W24
W32
W36
W44
W52
Plan Build Test Cutover Window Run Stabilize
P0
Discovery & Mobilization
Weeks 1-4 · 4-week duration
OwnerProgram Manager
Key Deliverables
  • Project charter signed by executive sponsor
  • RACI matrix & team mobilization complete
  • AS-IS process mapping initiated (6 functional lanes)
  • Asset master inventory & data quality baseline
  • Risk register established & first review held
Quality Gate G1
MilestoneProject formally chartered
Exit CriteriaSponsor signed; team mobilized; AS-IS baseline captured
P1
Design & Blueprint
Weeks 5-12 · 8-week duration
OwnerSolution Architect
Key Deliverables
  • TO-BE process design signed off across all lanes
  • SAP PM configuration design document approved
  • CMMS configuration design & integration spec approved
  • Data migration strategy & mapping templates
  • RBAC roles & authorization matrix designed
Quality Gate G2
MilestoneDesign freeze achieved
Exit CriteriaTO-BE signed; configuration design approved; migration plan ready
P2
Build & Configuration
Weeks 13-24 · 12-week duration
OwnerBuild Lead
Key Deliverables
  • SAP PM configured per design spec; unit tested
  • CMMS configured; integration endpoints built
  • Master data cleansed & loaded to test environments
  • Custom developments completed & code reviewed
  • SIT (System Integration Test) environment ready
Quality Gate G3
MilestoneBuild complete; ready for testing
Exit CriteriaAll config in scope built; SIT environment validated; unit tests passed
P3
Testing & Validation
Weeks 25-32 · 8-week duration
OwnerQA / Test Lead
Key Deliverables
  • SIT executed; integration defects resolved
  • UAT cycles 1 & 2 executed by business users
  • Performance & load testing complete
  • Security & penetration testing complete
  • UAT sign-off by business sponsor
Quality Gate G4
MilestoneUAT sign-off complete
Exit CriteriaAll severity 1-2 defects resolved; UAT signed; performance baselines met
P4
Cutover & Go-Live
Weeks 33-36 · 4-week critical window
OwnerCutover Manager
Key Deliverables
  • End-user training delivered to all roles
  • Production cutover plan rehearsed (3+ dress rehearsals)
  • Master data & transactional data migrated to production
  • Production environment validated & smoke tested
  • Go/no-go decision; system goes live
Quality Gate G5 · GO-LIVE
MilestoneSystem live in production
Exit CriteriaAll cutover steps executed; smoke tests passed; sponsor approval
P5
Hypercare
Weeks 37-44 · 8-week stabilization
OwnerOperations Lead
Key Deliverables
  • Daily war-room cadence with defect triage
  • Production issues resolved within SLA
  • End-user adoption metrics tracked weekly
  • Knowledge transfer to support & BAU teams
  • Stabilization KPIs reach target thresholds
Quality Gate G6
MilestoneStable production operations
Exit CriteriaDefect rate at BAU; adoption targets met; KT to support complete
P6
Optimization & BAU Transition
Weeks 45-52 · 8-week transition
OwnerBAU Owner
Key Deliverables
  • Process optimization from production data analysis
  • Reporting & analytics tuned to operational reality
  • BAU operating model fully transitioned
  • Project closure documentation completed
  • Lessons learned captured & published
Project Closure
MilestoneProject formally closed
Exit CriteriaBAU transition complete; closure documents signed; benefits tracked

The template's structural discipline is that each phase has explicit exit criteria, not just a calendar end-date. The phase doesn't close because week 12 arrives; it closes because the TO-BE design is signed off, the configuration design is approved, the migration mapping is reviewed, and the named approver puts their signature on the quality gate. That signature-backed evidence chain is what distinguishes a phase-gated program from a calendar-gated one. Program managers ready to deploy this template structure on their current integration can Sign up free to operationalize the phase-gated template on a live project.

Resource Planning Across the Seven Phases

Resource intensity varies dramatically across the seven phases. Discovery and design phases run lean with senior architects; build phase peaks the team size; testing requires business-user availability; cutover demands full-team focus; hypercare ramps down. The grid below shows the typical resource shape across the 52-week program.

Resource Intensity Across the Seven Phases
Swipe to compare across phases
Resource Role P0-P1 Plan P2 Build P3 Test P4 Cutover P5-P6 Run
Program Manager 1.0 1.0 1.0 1.0 0.5
Solution Architect 1.0 0.75 0.5 1.0 0.25
SAP / CMMS Consultants 2.0 5.0 3.0 4.0 1.0
Data Migration Lead 0.5 1.0 1.0 1.0 0.25
Business Users (UAT) 0.25 0.5 3.0 5.0 1.0
Cutover & Hypercare Team 0 0.5 1.0 6.0 4.0
P2 Peak technical resource phase (build & configuration)
P4 Peak total resource phase (cutover demands full-team focus)

The resource-shape implication for budgeting: the build phase (P2) is typically the largest single line item, but the cutover phase (P4) is the highest-risk concentration of resources working under time pressure. Sponsor attention should be highest during P2 (for cost discipline) and P4 (for execution risk). Program leads ready to model resource scenarios against this template can Sign up free to model team scenarios against the seven-phase template.

See the Template Operationalized on a Live Integration Project
Walk through how the seven-phase plan and quality gates run on an actual SAP-CMMS integration program with deliverable tracking, milestone management, and phase-gate sign-offs. 30-minute walkthrough.

Quality Gates That Distinguish Successful Projects

The single most common cause of integration program failure is weak quality gate enforcement. The phase closes because the calendar says so, not because the evidence is complete. The next phase inherits unresolved decisions that compound until the program runs out of recovery time. Disciplined quality gates work because they enforce evidence-backed progression—the gate doesn't close on enthusiasm, it closes on signed artifacts.

The Six Quality Gates · What Each Gate Demands
G1
Project Chartered
Sponsor signature · Team mobilization confirmed · AS-IS baseline captured · Risk register established
G2
Design Frozen
TO-BE process signed · Configuration design approved · Migration mapping reviewed · RBAC designed
G3
Build Complete
All in-scope config built · Unit tests passed · SIT environment validated · Code reviews complete
G4
UAT Signed Off
Severity 1-2 defects resolved · Business sponsor sign-off · Performance baselines met · Security passed
G5
Go-Live Authorized
Cutover steps executed · Smoke tests passed · Production validated · Go/no-go signed by sponsor
G6
Hypercare Closed
Defect rate at BAU level · Adoption targets met · KT to support complete · Stabilization confirmed

The gate that most often gets compromised is G2 (Design Frozen)—because sponsors are typically eager to start build, and "we'll finalize that during build" is the easy compromise that produces 60-70 percent of build-phase rework. The gate that most often fails on first attempt is G4 (UAT Signed Off)—because defect counts at first UAT cycle are typically higher than the team expected, requiring a second cycle to close out. Disciplined teams plan two UAT cycles into the schedule from the start, treating the second cycle as expected rather than as schedule slippage.

Expert Perspective: What Distinguishes Predictable Integration Programs

The integration programs I've seen execute predictably share a property that often surprises new program managers: they treat the phase-gate template as inviolable. Each gate has explicit completion criteria, an accountable owner, and a sign-off that means something. Phase 2 doesn't start before Phase 1 closes. Phase 4 doesn't relax the freeze established in Phase 2. UAT defects in Phase 3 require formal resolution before the team enters cutover preparation. The programs that overrun on cost and schedule almost always trace to a phase that closed without genuine completion—items deferred, design freezes held loosely, sign-offs given without underlying evidence. The discipline isn't innovative. It's the patient enforcement of phase-gate criteria over the 52-week horizon, and it's what separates predictable integrations from career-ending ones.

Phase Gates Are Inviolable
Each gate has explicit completion criteria signed by named approver. Skipping or partially completing gates produces the predictable failures the industry chronically reports.
Design Freeze Means Freeze
The G2 design freeze is governance, not procedural formality. Scope additions after freeze require sponsor approval with documented business case. "We'll figure it out in build" is how budgets overrun.
Two UAT Cycles Planned, Not One
First-cycle UAT defect counts always exceed expectations. Plan two cycles into the schedule from kickoff; treating the second as expected rather than as slippage avoids predictable schedule failure.

From Template to Operationalized Project Plan

A template downloaded is not a template implemented. The disciplined path from template to operationalized plan follows the cadence below.

From Template to Live Project Operation
90-day path from template adoption to phase-gated execution
Days 1–15
Template Adoption & Customization
Adapt template to organizational context. Adjust phase durations to project complexity. Customize deliverable lists. Name owners for each phase and quality gate. Sponsor review and adoption sign-off.
Days 16–35
P0 Discovery Execution
Execute Phase 0 against the template. Capture AS-IS baselines. Mobilize team. Establish risk register. Build sponsor cadence. Complete G1 quality gate with signed evidence.
Days 36–70
P1 Design Execution
Run TO-BE design workshops. Build configuration design documents. Define data migration mapping. Hold design review with sponsor. Complete G2 quality gate; close design freeze with sign-offs.
Days 71–90
P2 Build Initiation
Begin SAP PM configuration and CMMS build per design spec. Establish weekly build status reviews. Track defect emergence. Prepare master data cleansing pipeline. P2 typically continues 12 weeks; first 20 days set the cadence.

By day 90, the program has executed two phases with signed quality gate evidence, established the cadence that will carry it through the remaining nine months, and demonstrated to sponsors that phase-gate discipline is producing measurable progress. The remaining phases benefit from the operational momentum the disciplined start created. Program managers ready to begin template adoption can Book a free demo to walk through template adoption on a current program.
Run Your Next Integration With Phase-Gate Discipline
Seven phases. Thirty-five deliverables. Six quality gates with signed evidence. See the template operationalized on a live SAP-CMMS integration program with phase-by-phase tracking.

Frequently Asked Questions

How do we adapt the 52-week duration to a smaller or larger integration?
The seven-phase structure stays constant; phase durations adjust proportionally. Smaller integrations (single facility, limited scope) typically compress to 26-32 weeks total—discovery and design phases shrink most, build phase compresses to match scope, cutover stays at 3-4 weeks regardless of size. Larger multi-site or multi-instance integrations expand to 78-104 weeks, with proportional growth across all phases. What doesn't change: the quality gates, the phase-gate evidence requirements, and the discipline that the gate doesn't close until the evidence is signed. The duration is flexible; the structure is not.
What's the relationship between this template and SAP Activate methodology?
The template is compatible with SAP Activate's six-phase structure (Discover, Prepare, Explore, Realize, Deploy, Run). The mapping is rough: P0 Discovery and Mobilization aligns with Discover-Prepare; P1 Design aligns with Explore; P2 Build aligns with Realize; P3 Testing and P4 Cutover align with Deploy; P5 Hypercare and P6 Optimization align with Run. The differences are emphasis—this template puts more weight on phase-gate evidence than calendar progression, treats CMMS integration as equal first-class with SAP PM rather than as a secondary integration, and explicitly plans two UAT cycles rather than one. Programs using SAP Activate can overlay this template's gate discipline without conflict.
Who should own each phase as the named accountable owner?
P0 Discovery typically owned by the Program Manager (driving mobilization and charter). P1 Design owned by the Solution Architect (driving the configuration and integration design). P2 Build owned by the Build Lead (driving technical configuration and code). P3 Testing owned by the QA or Test Lead (driving validation cycles). P4 Cutover owned by the Cutover Manager (often a dedicated role for this critical window). P5 Hypercare owned by the Operations Lead transitioning from project to operational ownership. P6 Optimization owned by the BAU Owner who carries the system forward into business as usual. Each owner has explicit authority to make decisions within their phase and accountability for the quality gate sign-off.
How do we handle scope changes during execution?
Scope changes after G2 (Design Frozen) require formal change control. Each proposed change documented with impact analysis covering schedule, cost, and risk. A change board (typically Program Manager, Solution Architect, Sponsor, and business owner) approves or rejects. Approved changes added to scope with explicit schedule and budget impact. The mistake to avoid is accepting changes informally because they seem small—each individual change is small, but the aggregate of accepted-without-tracking changes is what blows budgets. The template treats change control as a governance activity at the sponsor level, not a procedural task at the project management level.
What metrics indicate the program is on track vs at risk?
The strongest leading indicators are quality gate readiness (do we have signed evidence for the upcoming gate), defect emergence rate during build phase (rising rate signals build-quality issues), UAT defect counts cycle-over-cycle (should drop sharply between cycle 1 and cycle 2), and resource availability variance from plan (sponsors and senior architects pulled to other priorities is the most common early failure signal). Lagging indicators (schedule variance, cost variance) confirm what the leading indicators already showed. Programs that track only lagging indicators discover problems too late to recover within the phase; programs that track leading indicators catch issues while the response options are still inexpensive.


Share This Story, Choose Your Platform!