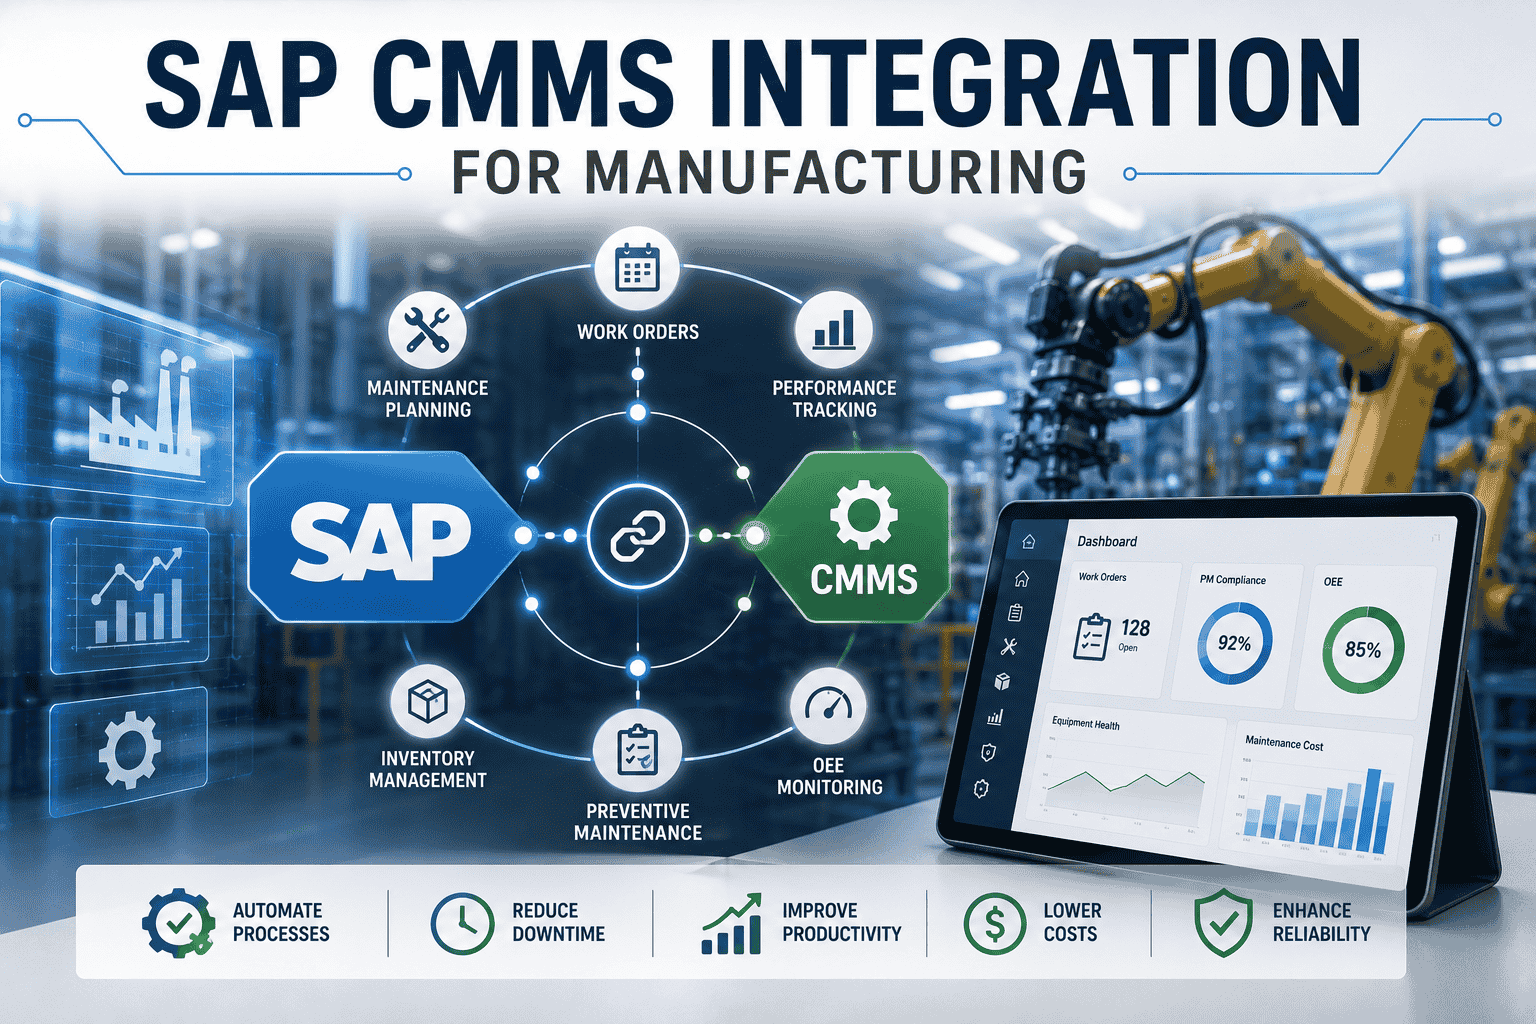
SAP CMMS Integration for Manufacturing: Automating Plant Maintenance and Work Orders
Manufacturers running SAP PM typically lose 20–30% of productive capacity to slow work orders, missed preventive maintenance, mismatched parts inventory, and OEE numbers that don't match floor reality. SAP-CMMS integration closes that gap by automating the workflows SAP wasn't built to handle. Book a free demo to see the integration running against a manufacturing environment.
MANUFACTURING GUIDE
Integrating SAP and CMMS for Manufacturing Plant Maintenance
Five manufacturing capabilities, one integration architecture, and the implementation playbook plant managers can use to close the productivity gap.
5Core capabilities
38%Less downtime
16wkTypical rollout
Why Manufacturing Needs SAP-CMMS Integration
SAP PM is built for financial accuracy and master data integrity—it knows what every asset is, what it costs, and where the budget went. What it does not do well is field execution. That gap between SAP's strengths and the manufacturing floor's reality is exactly where productivity leaks happen day after day.
Where SAP PM Falls Short on the Floor
Four gaps that drain manufacturing productivity
GAP 01
Field Execution
Technicians at the machine need mobile work orders, parts staged, and history one tap away—not desktop SAP screens back in the office.
GAP 02
Sensor Signals
Vibration, temperature, current draw, and pressure anomalies need to flow directly into work order triggers—not into spreadsheets nobody opens.
GAP 03
Mobile Workflows
Work order updates need to happen at the asset, in real time—not hours later when the technician returns to a shared terminal.
GAP 04
Real-Time OEE
Plant managers need live availability, performance, and quality numbers—not yesterday's report compiled from three different systems.
DELOITTE 2024 MANUFACTURING OUTLOOK
Manufacturers operating without integrated maintenance and operations data lose an average of 800 hours of production per plant per year to preventable failures.
$2–4M
in lost revenue per plant annually
Integration closes the gap by keeping SAP as the system of record while adding a CMMS execution layer that handles mobile, sensors, automation, and analytics. The two systems sync bidirectionally—master data flows down from SAP, execution data flows up from CMMS. The outcomes show up quickly and consistently.
25–40%
Unplanned Downtime Cut
Predictive analytics catch failures before they halt production lines
60%
Faster Work Order Cycles
Mobile execution and auto-routing eliminate paperwork delay
+5–10
OEE Points in Year 1
Live data feeds availability, performance, and quality calculations
5 Manufacturing Capabilities Integration Unlocks
The integration delivers five distinct manufacturing capabilities, each tied to a specific operational gain. Together they cover the maintenance and reliability surface area that determines plant productivity. Skipping any one of them leaves measurable value on the table.
01
Automated Work Order Lifecycle
From request to completion to cost posting—every step automated. Operators raise issues from the line, work orders generate in SAP, route to technicians on mobile, close with full data, and post costs back without manual intervention.
60% faster work order cycle
02
Preventive Maintenance at Scale
Time-based, usage-based, and condition-based PMs run automatically across thousands of assets. SAP holds the plans, CMMS handles the scheduling logic, mobile execution closes the loop with the technician.
95%+ PM compliance rate
03
Real-Time OEE Visibility
Availability, Performance, and Quality calculated live from production data and maintenance events. Plant managers see line-level OEE instantly instead of in yesterday's report; root cause analysis runs against unified data.
+5–10 OEE points in 12 months
04
Smart Spare Parts Inventory
SAP MM master data plus actual consumption patterns from CMMS feed AI-driven stocking logic. Critical spares stay covered, long-tail obsolete parts retire systematically, working capital drops.
15–25% inventory reduction
05
Predictive Failure Detection
Sensor streams plus ML models trained on integrated SAP + CMMS history catch failures 14–60 days before they occur. Production schedules absorb predictive work orders instead of being broken by unplanned downtime.
25–40% unplanned downtime cut
The five capabilities operate as a system—each one strengthens the others. Smart inventory depends on accurate work order data; OEE accuracy depends on real-time work order events; predictive detection requires both. Plants implementing all five together see compounded results that single-capability deployments cannot match. Teams ready to assess their plant's current state can sign up free to run the five-capability diagnostic against their existing maintenance operations.
Inside the Manufacturing Integration Architecture
The architecture below shows how SAP PM, CMMS, and SAP MM connect across a manufacturing plant—from production lines at the top where work originates, through the integration layer in the middle, down to the support functions that execute against work orders. Bidirectional arrows mark every point where data flows in both directions. The architecture works because each system stays in its lane: SAP for master data and financials, CMMS for execution and mobile, SAP MM for inventory and procurement.
Manufacturing Plant Integration Architecture
Three zones, real-time bidirectional data flow
ZONE 1
Production Floor
Line 1
96.4%
OEE LIVE
Line 2
92.1%
OEE LIVE
Line 3
88.7%
OEE LIVE
Line 4
78.2%
FAULT DETECT
Sensor data & work order events flow both directions in real time
ZONE 2
Integration Layer
CMMS
Execution & mobile
Work orders · Mobile · PMs · Sensors
SAP PM
System of record
Master data · Plans · Costs · History
SAP MM
Materials & inventory
Parts · Reservations · Procurement
CMMS ↔ SAP PM
SAP PM ↔ SAP MM
Orchestrated work orders dispatched to support functions; execution data returns
ZONE 3
Support Functions
Maintenance Shop
12
TECHS ACTIVE
Parts Crib
4.2K
SKUS
Quality Lab
98.6%
PASS RATE
Utilities
100%
UPTIME
All four production lines, three core systems, and four support functions operate on shared real-time data—the architectural reason manufacturers report 38% downtime reduction within 12 months.
The three-zone architecture is intentional. Production data alone produces dashboards no one acts on; integration logic alone produces work orders that never reach technicians; support functions alone consume resources without strategic direction. Connecting all three through bidirectional sync is what makes the integration actually deliver. Plant managers ready to see this architecture mapped against their specific environment can sign up free to model their plant's integration topology against the three-zone framework.
Map the Architecture to Your Plant
A 30-minute working session walks through the three-zone architecture using your actual plant layout—production lines, integration scope, and support functions—producing a tailored integration topology you can take to leadership and operations.
Most manufacturing plants are not at zero, but few are at full integration. The maturity ladder below describes the five recognizable stages a manufacturing operation moves through on the way to fully integrated, predictive maintenance. Knowing the current stage matters for setting realistic implementation goals—a plant at Stage 2 should not be targeting Stage 5 outcomes in year one.
1
Manual
Paper work orders, manual PM scheduling, spreadsheet OEE tracking, parts inventory by walkthrough.
Compliance under 65% · OEE unknown or stale
2
Digital
SAP PM live, basic CMMS in place, some mobile work order capability, but the systems don't talk. Data lives in silos.
Compliance 65–80% · OEE refreshed daily
3
Integrated
Real-time SAP-CMMS sync operational. Automated work orders, mobile execution adopted, parts inventory linked to consumption. The five capabilities are functioning.
Compliance 90%+ · OEE live · downtime trending down
4
Predictive
Condition monitoring across critical assets, AI-driven PM intervals, predictive failure detection running with sufficient accuracy to plan maintenance windows.
Self-optimizing maintenance strategy. Closed-loop reliability where the AI model adjusts intervals, parts stocking, and labor allocation based on outcomes. Human focus shifts to strategic decisions.
Compliance 97%+ · OEE benchmark-leading · downtime <50% of industry average
Most manufacturers reading this guide are at Stage 2 or Stage 3. The path from Stage 2 to Stage 3 is the highest-ROI move on the ladder—it unlocks the five core capabilities and produces the visible operational lift that funds further progression. Stage 4 and Stage 5 require deeper sensor coverage and longer training data accumulation, but they build on the same Stage 3 foundation. Manufacturers ready to identify their current stage and design a realistic path forward can sign up free to run the maturity assessment.
Implementation Roadmap for Manufacturing Plants
The implementation roadmap below is calibrated specifically for manufacturing environments—the production line constraints, the change management realities, the regulatory considerations. Total elapsed time is approximately 16 weeks from kickoff to plant-wide go-live, assuming a mid-sized plant with reasonable SAP master data quality at the starting line.
P1
Week 1–2
Plant Discovery & Asset Baseline
Inventory critical production lines and equipment. Score asset criticality on production impact and failure consequence. Capture current OEE, MTTR, MTBF baselines. Audit SAP master data quality for top assets.
Deliverable: criticality matrix + data readiness report
P2
Week 3–4
Integration Architecture Design
Decide which SAP touchpoints integrate (PM, MM, FI). Define CMMS scope (mobile, sensors, automation). Determine sensor coverage for condition-based and predictive PMs. Document field-level ownership rules.
Configure SAP-CMMS connector for master data, work orders, measurements. Test bidirectional sync across normal flow and edge cases. Validate field-level ownership and conflict resolution. Set up sensor data pipeline.
Deliverable: working integration with verified bidirectional data flow
P4
Week 9–12
Pilot Line Deployment
Activate integration on one critical production line. Roll out mobile work orders to technicians serving that line. Capture real-world friction points. Refine workflows before expanding.
Deliverable: validated workflow with measurable compliance lift
P5
Week 13–16
Plant-Wide Rollout & Optimization
Expand integration to remaining production lines in waves. Onboard all technicians to mobile. Activate condition-based PMs where sensors are deployed. Begin the analyze-and-refine cycle for continuous improvement.
Deliverable: production-running architecture at 90%+ compliance
The 16-week timeline holds for plants with reasonable starting maturity. Plants at Stage 1 (fully manual) typically add 4–6 weeks for master data clean-up before the architecture design phase. Plants at Stage 3 may compress to 10–12 weeks by skipping discovery work already completed in earlier initiatives. Manufacturing operations ready to scope the roadmap against their specific environment can book a free demo to walk through the 16-week plan in operational detail.
Bring Manufacturing-Grade Integration to Your Plant
Oxmaint connects to SAP PM and SAP MM, deploys across multi-line manufacturing environments, and runs the full three-zone architecture—keeping SAP as the system of record while delivering the execution layer manufacturing operations actually need.
How is SAP-CMMS integration different for manufacturing vs. other industries?
Manufacturing integrations have to handle production line constraints that other industries don't face—continuous shifts, OEE accountability, takt-time pressure, and the cascading impact of any single asset failure across an entire production sequence. The architecture is the same three zones, but the integration logic is tuned for real-time line-level events, faster work order release cycles, and tighter coupling between maintenance actions and production schedules. Process manufacturing (pharma, chemicals, food) adds regulatory compliance overlay that discrete manufacturing typically does not require.
Will integration disrupt our existing SAP PM configuration?
No. The integration preserves SAP PM as the system of record—your existing maintenance plans, task lists, equipment master data, and cost rollups continue to function exactly as configured. The CMMS layer adds execution, mobile, and analytics capabilities on top of SAP rather than replacing any part of it. Bidirectional sync keeps both systems consistent, so the maintenance organization gains capability without losing SAP investment or retraining users on a different system of record.
What's the typical ROI for manufacturers implementing this integration?
Most mid-sized manufacturers see 12–18 month payback periods with cumulative 3-year returns of 4–6x project investment. The largest dollar contributions come from unplanned downtime reduction (38% average), followed by labor productivity gains from mobile work orders, then inventory carrying cost reduction. Plants with high downtime cost per hour (continuous-process, capital-intensive operations) see faster paybacks because the downtime reduction alone often justifies the integration investment.
Can we integrate SAP with our existing CMMS, or do we need a new one?
Depends on the CMMS. Modern CMMS platforms with mature SAP connectors integrate cleanly. Legacy CMMS systems without OData/REST integration capability typically require either significant custom development or replacement. The decision factor is whether the existing CMMS supports the five core capabilities (work order automation, scalable PMs, real-time OEE, smart inventory, predictive detection) or whether you would be retrofitting a tool that was not designed for them. A pre-integration assessment usually resolves this question quickly.
How do we measure success after manufacturing integration goes live?
Five core metrics tracked monthly during the first six months, then quarterly: PM compliance rate (target 95%+), OEE by production line (expect 5–10 point improvement within 12 months), unplanned downtime hours (target 30–40% reduction), work order cycle time (target 60% reduction), and inventory turn rate (target +20–30%). These five metrics together signal whether the integration is delivering the manufacturing capabilities it was built to deliver, and whether the architecture is positioned to progress from Stage 3 toward Stage 4 on the maturity ladder.