SAP Inventory Accuracy Checklist for Maintenance Spare Parts
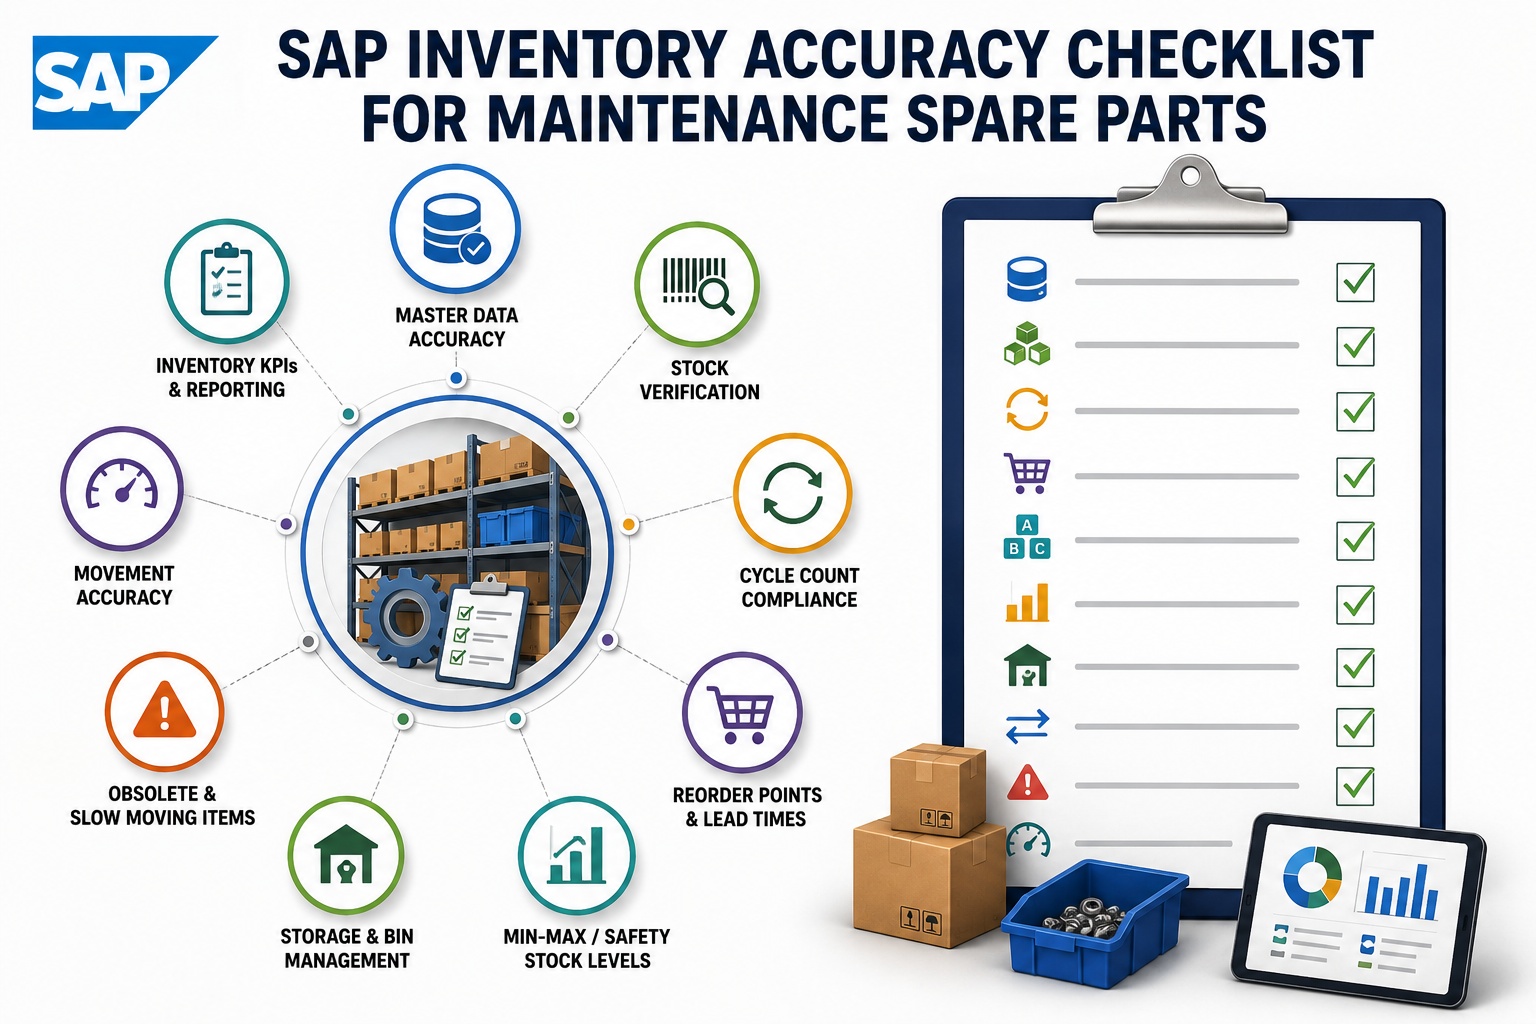
Maintenance technicians who reach for a spare part and find an empty bin lose 30-60 minutes per occurrence. Multiply that across a year and inventory inaccuracy alone destroys thousands of productive hours. The fix isn't more inventory—it's more accuracy. SAP MM provides the framework: cycle counting, ABC classification, reorder points, lead times. But the framework only works when the discipline behind it does. This checklist maps the 8 inventory accuracy areas every SAP MM maintenance environment must address—and what evidence demonstrates the discipline is working. Book a free demo to see accuracy-driven inventory.
SPARE PARTS ACCURACY REALITY
Inventory Accuracy Is a Daily Discipline, Not an Annual Audit
8
Accuracy Check Areas
99%+
Target Accuracy for A-Class Items
ABC
Classification Drives Cadence
30-60 min
Lost per Stockout Event
Why Spare Parts Inventory Accuracy Drives Maintenance Performance
The maintenance organizations with the highest wrench-time also have the highest inventory accuracy. The correlation isn't accidental. When technicians trust the system, they pull parts and start working. When they don't trust the system, they verify before starting—or they discover the stockout mid-job and scramble. Inventory accuracy is the invisible foundation that determines whether your maintenance program runs efficiently or operates in constant friction.
SAP MM inventory accuracy specifically affects four operational dimensions: technician productivity (no time wasted hunting parts), maintenance schedule reliability (planned work actually starts on time), procurement efficiency (orders trigger correctly without manual oversight), and financial accuracy (asset values match physical reality). Stockroom managers ready to assess their accuracy baseline can Sign up free to baseline your inventory accuracy.
The 8-Area SAP MM Inventory Accuracy Checklist
The checklist below covers eight inventory accuracy areas every SAP MM maintenance environment must address. Each row shows the verification cadence (how often), the target accuracy percentage, and the three-part verification structure. Inventory aging and obsolescence anchors as the gold area—typically the largest cost recovery opportunity hiding in plain sight.
Items not consumed in 12-24+ months; obsolete part numbers; superseded items; return-to-vendor candidates
METHOD
SAP MB52 (warehouse stock); MC.9 (consumption analysis); aging reports; cross-reference with engineering BOM updates
EVIDENCE TRAIL
Aging reports trended; write-off journals; return-to-vendor documentation; recovery value captured
2Operational Counting
3Stock Level Discipline
3Strategic Data Quality
08Aging Cost Recovery
The frequency cadences reveal the discipline rhythm: daily/weekly counts for A/B items keep accuracy fresh; monthly stock-level reviews catch drift before stockouts; quarterly strategic reviews catch slower-moving issues. Stockroom managers ready to deploy the 8-area framework can Sign up free to deploy the 8-area framework.
SEE IT IN PRACTICE
Walk Through Accuracy-Driven Inventory Management
30-minute walkthrough showing how integration automates cycle count workflows, ABC reclassification, stockout alerts, and aging reports—all running in real stockroom operations.
Common SAP MM Inventory Pitfalls That Erode Accuracy
Stockrooms with declining accuracy share predictable patterns. Phantom inventory: items showing in SAP but missing physically because someone forgot to issue them against a work order. Mis-locations: items present but in the wrong bin, effectively invisible to technicians searching the right location. Unit-of-measure mismatches: counted in pieces, stored in cartons of 10, recorded in either—producing 10x discrepancies that look like theft. Negative stock postings: backflushed materials that drive system quantities negative, masking real consumption patterns. Goods receipt timing: parts received but not yet posted, creating temporary phantom inventory. Each pitfall sounds preventable in isolation; combined and ignored, they degrade accuracy by 1-2 percentage points per quarter until the stockroom requires a major reset.
Cycle Counting Cadence by ABC Classification
The cycle counting cadence below shows the standard ABC-driven frequency that keeps inventory accuracy fresh without overburdening stockroom resources. A-items get the most attention; C-items get the least. The Pareto principle applies: roughly 80% of inventory value sits in 20% of items.
A-Class Items
~10-20% of items, ~70-80% of value. Cycle count daily or weekly. Target ≥99% accuracy. Critical spares included.
B-Class Items
~20-30% of items, ~15-25% of value. Cycle count monthly. Target ≥95% accuracy. Standard maintenance parts.
C-Class Items
~50-70% of items, ~5-10% of value. Cycle count quarterly. Target ≥90% accuracy. Consumables and low-value items.
The cadence is the discipline. Plants that maintain ABC-driven cycle counting consistently keep accuracy fresh; plants that batch counts into annual events lose accuracy throughout the year. Stockroom managers ready to apply ABC-driven cadence can Sign up free to apply ABC-driven cycle counting.
ROI of Inventory Accuracy Discipline
Inventory accuracy ROI shows up in metrics that matter to maintenance and finance leaders alike: stockouts, turnover, carrying costs, technician productivity, and freed-up cash.
AD-HOC vs DISCIPLINED INVENTORY ACCURACY
Stockroom Performance Delta
Inventory Accuracy
~75%
99%+
+24 pts
Stockout Rate
15-25%
<2%
−88%
Excess Inventory Carrying Cost
Baseline
−25%
−25%
Mean Time to Part
Hours
Minutes
−85%
Inventory Turnover
2-3x
6-8x
+150%
99%+
Inventory accuracy achievable with disciplined cycle counting
−25%
Carrying cost reduction from rightsized stock levels
The compounding effect: accurate inventory means fewer emergency orders, lower carrying costs, faster work execution. Stockroom managers ready to model accuracy ROI can Book a free demo to model inventory accuracy ROI.
Expert Perspective on Stockroom Excellence
"
The stockrooms I've watched transform their accuracy share a property that initially surprised me: they measured accuracy as a daily KPI, not as an annual outcome. Daily count variance gets reported alongside daily production metrics. Weekly accuracy trends get reviewed in operations meetings. Monthly aging reports surface obsolete inventory before it accumulates. The discipline isn't a project that completes; it's a rhythm that continues. The stockrooms that struggle treat inventory accuracy as something to fix before audits or after stockouts—reactive cycles that produce momentary improvement followed by drift. The integration architecture matters because it makes the daily discipline possible. Without automation, the discipline becomes unsustainable workload; with it, accurate inventory becomes the default state the system maintains.
01
Accuracy Is a Daily KPI
Measure variance daily, not annually. Report alongside production metrics. Discipline becomes operational rhythm.
02
Cadence Matters More Than Volume
Daily 5-item counts beat monthly 100-item counts. Cadence keeps accuracy fresh; batches let it drift.
03
Aging Reviews Recover Real Cash
Quarterly aging reviews recover real money through write-offs, returns, and reclassifications. Often 5-15% of stock value.
90-Day Inventory Accuracy Roadmap
The 90-day program below establishes disciplined inventory accuracy—baseline assessment, cycle count cadence, master data clean-up, and KPI dashboard deployment.
90-DAY INVENTORY ACCURACY ROADMAP
From Baseline Assessment to KPI-Driven Operations
DAYS 1–25
01
Baseline & ABC Re-Classification
Measure current accuracy; reclassify ABC based on 12-month consumption; identify critical/insurance spares; document baseline state.
Eight check areas mapped. Cycle count cadence deployed. Master data cleaned. KPI dashboards live. The stockroom discipline that eliminates stockouts and frees up working capital.
What's the difference between annual physical count and cycle counting?
Annual physical count is a periodic event that shuts down the stockroom for 1-3 days to count everything at once. Cycle counting is continuous—counting a small subset of items every day or week so that all items get counted multiple times per year without disruption. The advantages of cycle counting: no operational shutdown, accuracy stays fresh year-round, variances get investigated when they're small and traceable, problem categories surface quickly. The advantages of annual counts: regulatory acceptance, single point-in-time financial reconciliation, simpler to schedule. Most mature stockrooms use cycle counting as the primary discipline and supplement with smaller annual physical counts to satisfy audit requirements.
How often should we recount ABC classifications?
Best practice: full ABC re-classification annually, with quarterly reviews for new items and items showing significant consumption pattern changes. Why quarterly: maintenance consumption patterns shift as equipment ages, production mix changes, and reliability programs mature. A part that was C-class two years ago may be A-class today because the equipment using it has become critical to production. Quarterly reviews catch these shifts before they cause stockouts or excess inventory. Run SAP MC40 (ABC analysis), compare current designations against rolling 12-month consumption value, and update material master classifications where drift is significant.
What inventory accuracy KPIs should we track?
Five KPIs cover most of the actionable picture. Inventory accuracy by ABC class: percentage of items where physical count matches system within tolerance. Stockout rate: percentage of pulls that found no available stock. Mean time to part: average time from work order release to part-in-hand. Inventory turnover: cost of goods consumed divided by average inventory value, by class. Aging share: percentage of inventory value in items not consumed in 12+ months. Track these weekly for A-items, monthly for B-items, quarterly for C-items. Trend them over 12-24 months to see whether discipline is improving or degrading.
How do we set safety stock for critical spares?
Standard safety stock formulas (z-score × demand standard deviation × √lead time) work for predictable-consumption items but underprovide for low-consumption critical spares. For critical spares, supplement the formula with consequence-based reasoning. If a part stockout shuts down a $500K/day production line and replacement lead time is 60 days, the safety stock decision isn't statistical—it's catastrophic-risk avoidance. Carry insurance spares regardless of formula output. Document the criticality rationale. Review insurance spare lists annually against equipment changes. Many plants over-rely on formulas and end up with appropriate stock for common parts but inappropriate stock for the parts that matter most.
What should we do about obsolete and insurance spares?
Quarterly aging reviews surface items with no consumption in 12-24+ months. For each item, decide one of: KEEP (genuine insurance spare for critical equipment - document rationale), RETURN (still in OEM purchase window - return for credit), SELL (working condition but no longer needed - sell to surplus brokers), or WRITE OFF (truly obsolete with no recovery value). The KEEP decision should be the exception, not the default. Most aged inventory exists because nobody decided otherwise—not because it's truly needed. A disciplined aging review typically recovers 5-15% of inventory value annually through returns, sales, and write-offs that free up storage space and working capital.