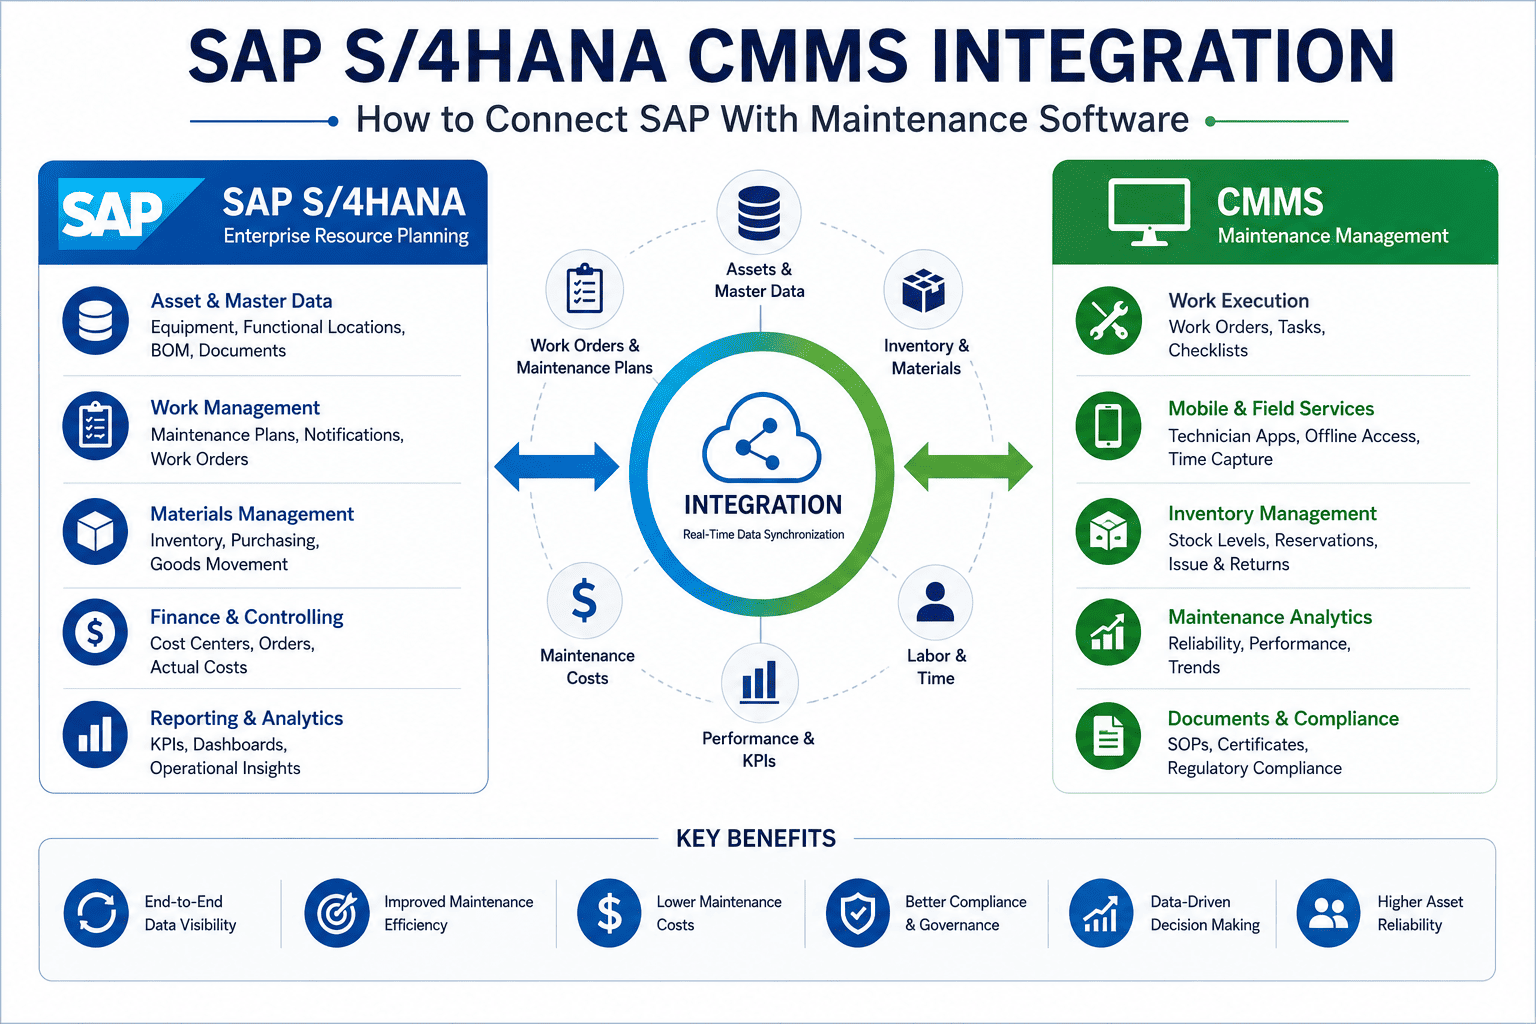
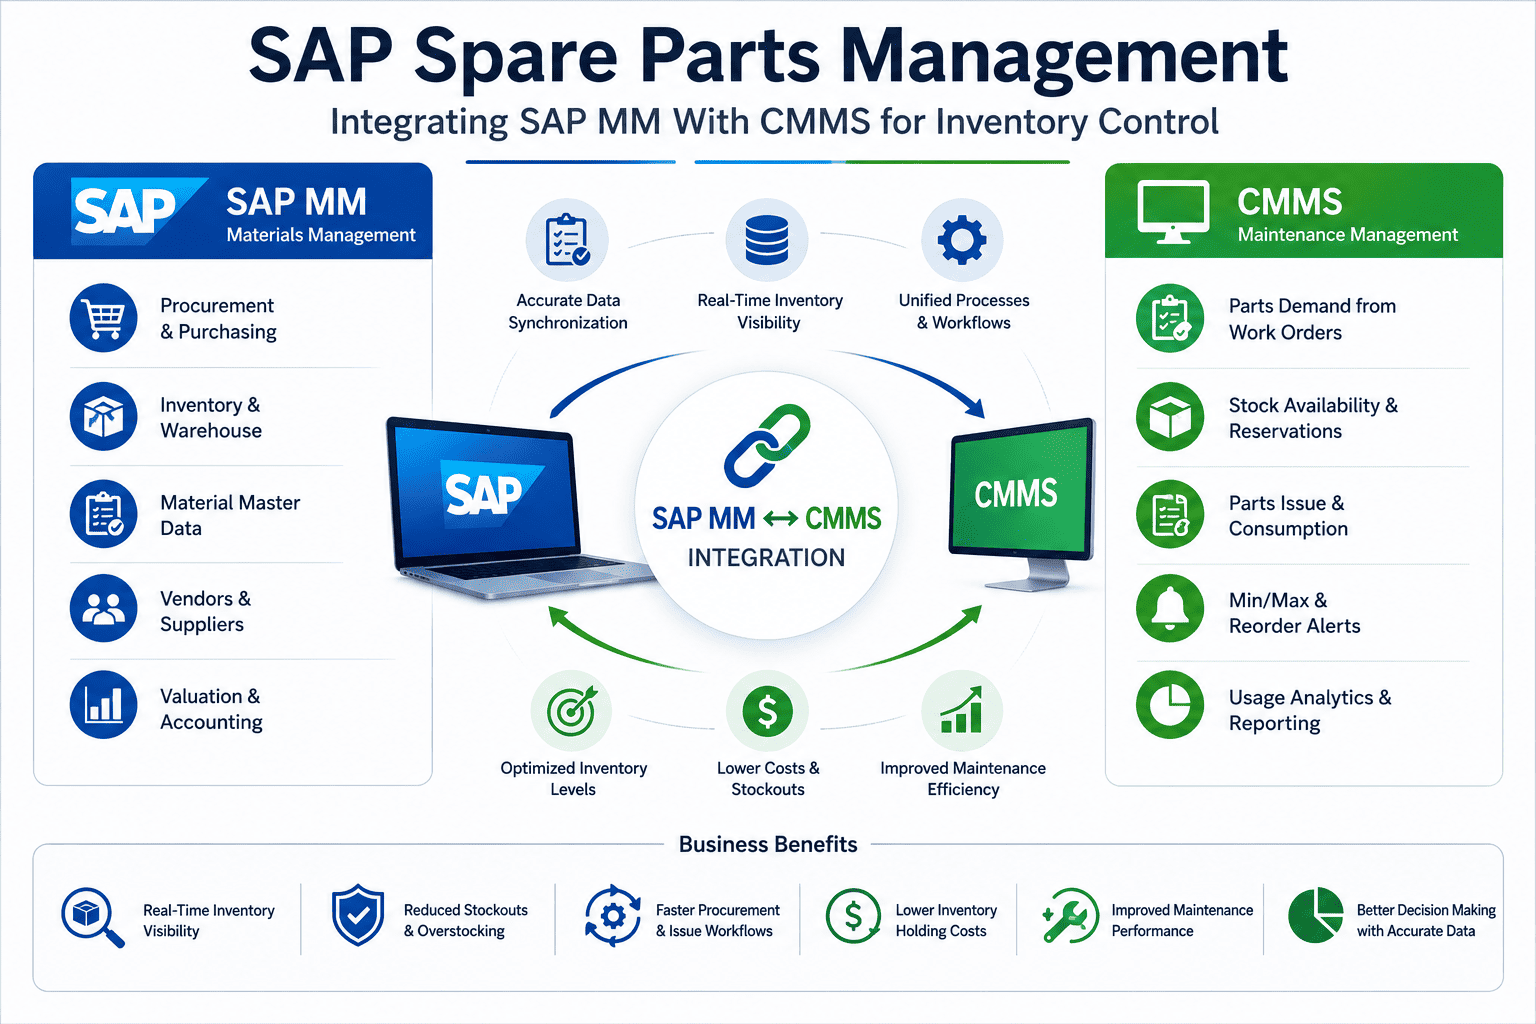
Every plant lives with two simultaneous MRO failure modes: too much capital tied up in slow-moving spare parts, and too few of the parts that fail at 3 AM during a critical run. IBM research shows 37 percent of companies still manage spare parts through spreadsheets and email. Emergency airfreight costs 10 to 20 times normal procurement. SAP EWM gives manufacturers the warehouse backbone; what's missing is the field-execution layer connecting technician requests, bin picks, and goods movements to the work orders that consume them. Book a free demo to walk through EWM-CMMS integration.
37%
Of companies still manage spare parts via spreadsheets, email, or shared folders
Source: IDC / IBM
10–20×
Cost premium for emergency airfreight vs normal procurement
Source: Industry research
15–30%
Inventory cost reduction with structured criticality classification
Source: Throughput.world
3–7×
Typical ROI within 6-12 months of integrated MRO optimization
Source: AI-MRO benchmarks
Why MRO Inventory Sits on Two Failure Modes Simultaneously
MRO inventory is the only category of working capital where being right is the exception. Most storerooms simultaneously carry too much of what nobody needs and too little of what fails next Tuesday. The "just-in-case" philosophy that built most storerooms produces a long tail of slow-moving parts that haven't moved in three to seven years, sitting on shelves while the same maintenance team places emergency orders for parts that should have been on the shelf to begin with. SAP EWM holds the data—every part, every bin, every movement—but the data doesn't help if it isn't linked to the work orders that actually consume the parts.
The structural problem is that maintenance planners, procurement buyers, and warehouse operators all work in different parts of SAP, with different priorities, and rarely with shared visibility into the same demand signal. A technician asking for a bearing on the floor is invisible to the buyer reviewing safety stock levels in the office. A reservation in IW31 doesn't trigger a pick in EWM until the work order releases. By the time the part is needed, it's either already there in excess or already late. Plants ready to close that visibility loop can Sign up free to connect EWM data to live work order demand.
The ABC-VED Matrix — Strategic Stocking by Criticality
The MRO problem isn't solved by stocking more or stocking less—it's solved by stocking the right things. The ABC-VED matrix is the framework world-class storerooms use to assign every spare part to a stocking strategy based on two dimensions: annual usage value (A/B/C) and operational criticality (V/E/D). The nine resulting cells each have a distinct replenishment philosophy, service level target, and capital exposure.
Criticality →
↓ Usage Value
V — VitalFailure stops production
E — EssentialFailure degrades output
D — DesirableConvenience or comfort
A — High
AV
Pareto Critical
Service: 99%+
Tightly forecasted. Min/max managed weekly. Vendor-stocked when possible.
AE
High-Value Non-Critical
Service: 95–97%
Forecast-driven. Consignment or just-in-time delivery from key suppliers.
AD
High-Value Slow Mover
Service: 85–90%
De-stock candidate. Buy-on-demand. Quarterly review for obsolescence.
B — Medium
BV
Critical Backup
Service: 99%+
Always-stock policy. Safety stock = 1 unit minimum. Reservation-tied.
BE
Standard Replenishment
Service: 95%
Standard min/max in EWM. Automated reorder. Cycle count monthly.
BD
Quarterly Review
Service: 85%
Light safety stock. Demand pattern reviewed quarterly for de-stocking.
C — Low
CV
High Quantity / Low Cost
Service: 99%+
Stock generously—low capital exposure. Bin-stocked at point of use.
CE
Vending / Bulk
Service: 95%
Vending machines or open bins. Replenish on threshold, not transaction.
CD
Eliminate or Vending
Service: 80%
Candidates for removal from storeroom or transition to vending/buy-out.
The matrix only works when SAP EWM and the CMMS share a unified part classification. A bearing labeled AV (Vital, high annual usage) in maintenance must be the same AV bearing in EWM, with the matching min/max settings, the right bin assignment, and the corresponding reservation behavior on a work order. Plants ready to classify their parts catalog against the matrix can Sign up free to start an ABC-VED segmentation on their current SAP catalog.
From Work Order Request to Issued Part
The mechanical question every maintenance planner asks: how does a parts reservation on a work order actually flow through SAP EWM to end up in the technician's hand at the asset? The cleaner that flow is, the lower the friction—and the lower the temptation to bypass SAP with manual workarounds that hide consumption from forecasting models.
T+0
Reservation Created
CMMS work order references SAP PM functional location. Required parts pulled from task list BOM. Reservation auto-created in EWM with quantity, priority, and target delivery window.
T+2 min
EWM Availability Check
EWM confirms quantity available at the source bin. If short, purchase requisition auto-triggers with vendor SLA. If reserved by another order, conflict resolution rules apply.
T+10 min
Warehouse Task & Pick
Warehouse task generated in EWM. Storeroom operator receives mobile pick instruction with bin location, quantity, and destination work order. Pick confirmed by barcode scan.
T+20 min
Goods Issue Posted
Goods issue (mvt 261) posts to SAP. Cost charged to work order cost center. Inventory level decremented. Reorder point triggered if min level crossed.
T+30 min
Asset Consumption Logged
Part scanned at asset by technician. Serial number captured for serialized parts. Consumption event linked to work order, asset history, and warranty / failure analysis records.
The traditional version of that same flow—paper reservation, walk to storeroom, hand-written sign-out, end-of-week reconciliation—takes between four hours and two days, and routinely leaves goods-issue postings unprocessed for weeks. Every day that consumption sits unposted, the forecasting model gets worse and the next stockout becomes more likely. Plants ready to compress the cycle can Book a free demo to walk through EWM-CMMS round trip on a sample asset.
SAP EWM Integration Points That Move the Needle
SAP EWM is a deep, capable warehouse management system. The integration points that most directly affect maintenance operations are concentrated in three areas, and getting them right is what separates plants that recover MRO capital from plants that don't.
01
Reservation-Driven Picking
Every work order reservation in CMMS generates an EWM warehouse task automatically. Storeroom operators receive mobile pick lists tied to specific work orders, not generic shortage reports.
Impact
Pick accuracy > 99%, picking time down 60–70%, kit-staging by job
02
Real-Time Consumption Feedback
Goods issue from EWM posts back to SAP MM and updates demand forecasting models with the actual consumption signal—not just the reservation. Phantom-stock and unposted goods movements eliminated.
Impact
Inventory accuracy 96%+, forecasting error down 30–40%, stockouts down 25%
03
Cycle Count & Bin Verification
CMMS technicians scanning parts at the asset automatically generate cycle count events when bin quantities reach min/max thresholds. The storeroom audits itself as work happens.
Impact
Cycle count compliance 95%+, annual physical inventory time down 80%
See SAP EWM Connected to Live Maintenance Demand
Walk through reservation-driven picking, real-time goods issue, and automated cycle counts—all linked to active work orders. 30-minute live demo on your asset hierarchy.
ROI: What Integrated MRO Inventory Actually Returns
MRO inventory ROI shows up in three places: working capital released, emergency procurement avoided, and downtime prevented through stockout reduction. The numbers below come from operating data at manufacturers running multi-plant MRO operations after they connected SAP EWM to integrated CMMS execution.
Swipe to compare
3–7×
Typical ROI within 6-12 months of integration
20–40%
Reduction in emergency procurement events
The biggest single lever is rarely the inventory reduction itself—it's the working capital released back to the business. A mid-size manufacturing plant carrying $8 million to $15 million in MRO inventory typically releases $1.5 million to $5 million in working capital within the first 18 months of integrated operations, while simultaneously reducing the stockout frequency that was driving emergency procurement to begin with. The math compounds: less capital tied up plus fewer emergencies plus fewer downtime events.
Expert Perspective: Why MRO Programs Stall
The most common failure mode in MRO programs isn't bad software—it's good software running on bad classification. Plants invest in SAP EWM, deploy mobile picking, configure min/max, and then leave every part defaulted to the same generic stocking policy because nobody ran the ABC-VED analysis first. Two years in, the carrying cost hasn't moved, the stockouts haven't dropped, and the program gets blamed on the technology. The technology was fine. The classification was missing. Get the matrix right first, and every subsequent decision about safety stock, reorder points, and vendor terms gets easier.
Classify Before You Automate
ABC-VED segmentation done well takes 4–6 weeks for a typical plant catalog. Skipping it produces fast technology adoption with zero working capital impact, which kills program credibility.
Match Bin Strategy to Part Strategy
CV parts belong in point-of-use bins, not the central storeroom. AV parts belong in secured locations with reservation locks. Generic shelf placement defeats matrix logic.
Close the Demand Loop
Forecasting models need the actual consumption signal, not the reservation signal. The integration that posts goods issues in real time is what separates working programs from theatre.
90-Day Path to Integrated MRO Operations
Most MRO integrations fail because they try to do too much at once. The roadmap below is what plants execute when they want measurable working capital impact within one quarter, with full coverage across all plant assets by month six.
Days 1–20
ABC-VED Classification
Pull 12 months of consumption history from SAP. Run ABC analysis on annual usage value. Conduct VED criticality assessment with maintenance leadership. Assign every part to a cell.
Days 21–40
EWM Configuration & Sync
Connect CMMS to EWM via OData. Configure reservation-driven picking. Set up bin strategy per matrix cell. Validate goods movement postings to SAP MM.
Days 41–65
Pilot Storeroom Go-Live
Activate on one storeroom or asset class. Mobile picking deployed to operators. Cycle count workflow active. Inventory accuracy baselined and tracked weekly.
Days 66–90
Plant-Wide & Optimization
Expand to all storerooms. Activate vending for CV/CE parts. Begin AD/CD de-stocking program. Establish quarterly matrix review cadence.
By day 90, plants executing this roadmap typically see inventory accuracy climb above 95 percent, stockouts on critical parts drop below 2 percent, and the first measurable working capital release land on the books. Materials management leaders ready to start the classification phase can Sign up free to begin ABC-VED classification on a sample storeroom.
Stop Carrying Inventory You Don't Need While Stocking Out on What You Do
Your SAP EWM is already running. The next step is connecting it to the work order demand that actually consumes the parts. See a live ABC-VED matrix running on your catalog in a 30-minute walkthrough.
Frequently Asked Questions
What's the difference between SAP EWM and SAP WM, and which integrates better with CMMS?
SAP WM is the legacy warehouse management module embedded in SAP ECC; SAP EWM is the modern, more capable warehouse system included in SAP S/4HANA. Both can integrate with a CMMS via standard APIs, but EWM offers richer functionality around mobile execution, slotting optimization, and real-time inventory visibility. Plants currently on WM should plan for EWM transition during their S/4HANA migration, and an OData-based CMMS integration will work with both without significant rework.
How long does ABC-VED classification take for a typical plant catalog?
For a parts catalog of 10,000 to 30,000 SKUs, ABC-VED classification takes approximately four to six weeks of focused effort. The ABC portion runs quickly from consumption history—it's a data analysis exercise. The VED portion requires workshops with maintenance engineers, reliability staff, and operations leadership to assign criticality ratings to parts that don't have obvious answers. The investment is one-time and pays back continuously through better stocking decisions over the catalog's life.
What inventory accuracy should we target, and how is it measured?
World-class MRO operations target 96 percent or higher inventory accuracy, measured as the percentage of cycle counts where system quantity matches physical count within tolerance. Tolerance varies by part value—high-value parts demand zero tolerance, low-value bulk items may allow a small percentage variance. Plants moving from spreadsheet-based tracking to EWM-integrated cycle counting typically improve from the low 80s to 96 percent or higher within the first six months of integrated operations.
How do we handle parts that don't fit cleanly into the ABC-VED matrix?
Edge cases are typically newly introduced parts with limited consumption history (default to BV until pattern emerges), regulated parts with mandatory carrying requirements (always-stock regardless of matrix position), and parts with extreme lead times where availability constraints override usage value (treat as one tier higher). The matrix is a starting framework, not a rigid rule—the goal is consistent classification logic that drives consistent stocking decisions, with documented exceptions where needed.
What working capital impact can a mid-size plant realistically expect?
Operating data from manufacturers integrating SAP EWM with CMMS execution shows working capital releases of $1.5 million to $5 million for plants carrying $8 million to $15 million in baseline MRO inventory. The release comes from three sources: de-stocking AD and CD parts identified by the matrix, optimizing safety stock on BE and BV parts based on actual lead-time variability, and eliminating duplicate part numbers discovered during classification. The release typically begins in month three and continues through month eighteen as the program matures.