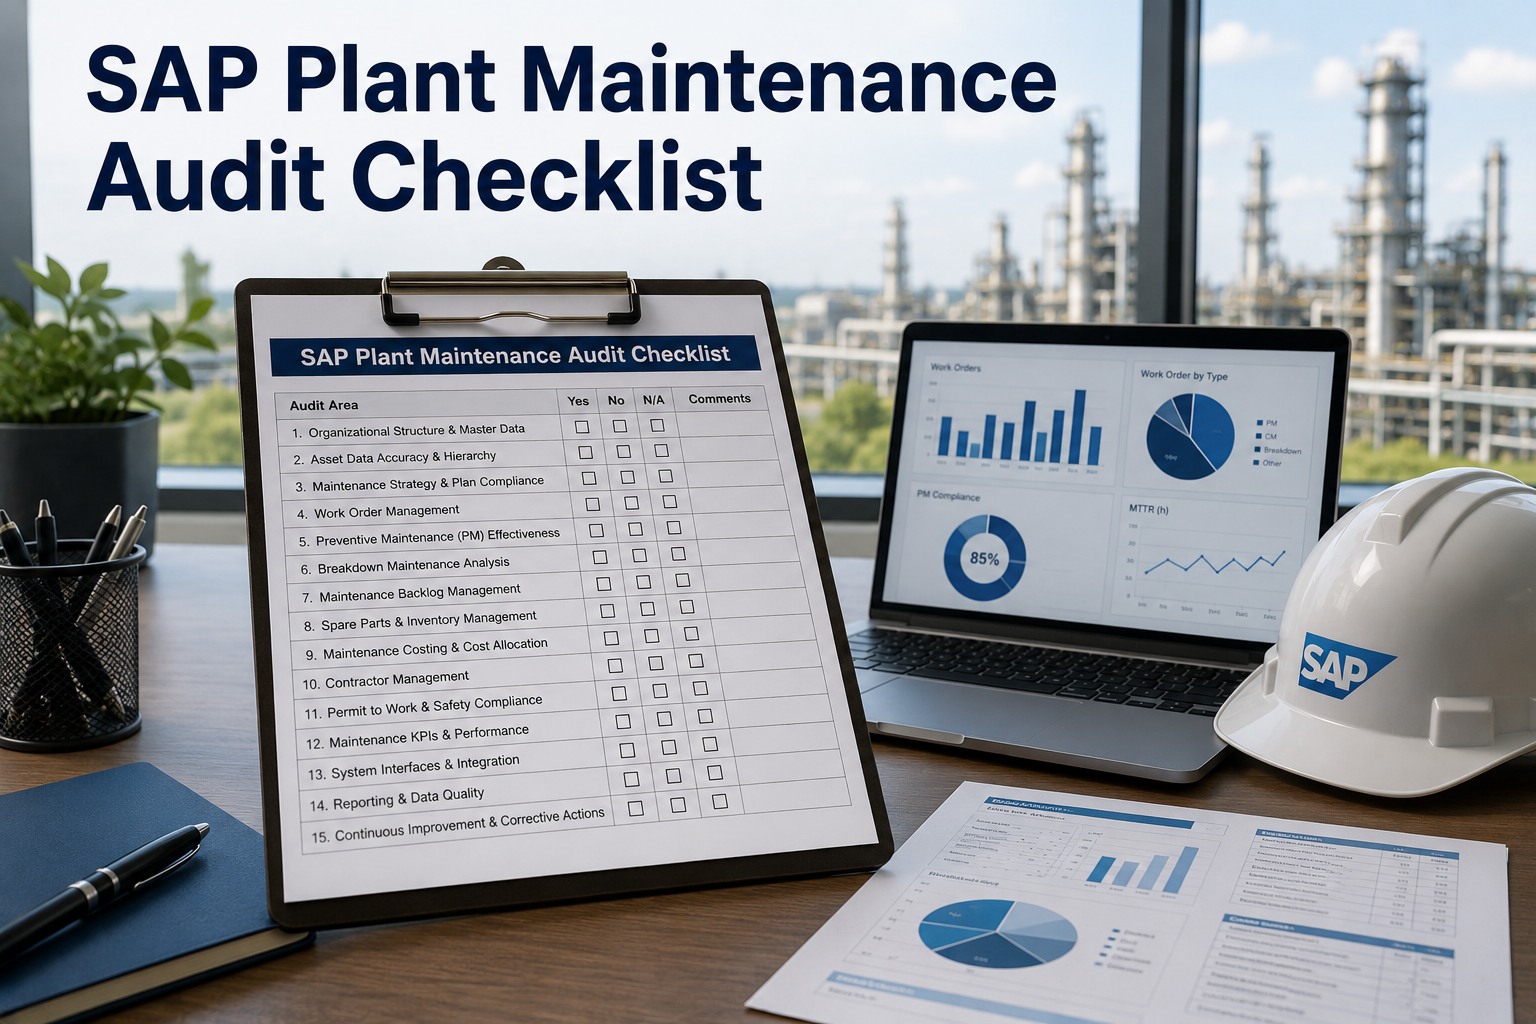
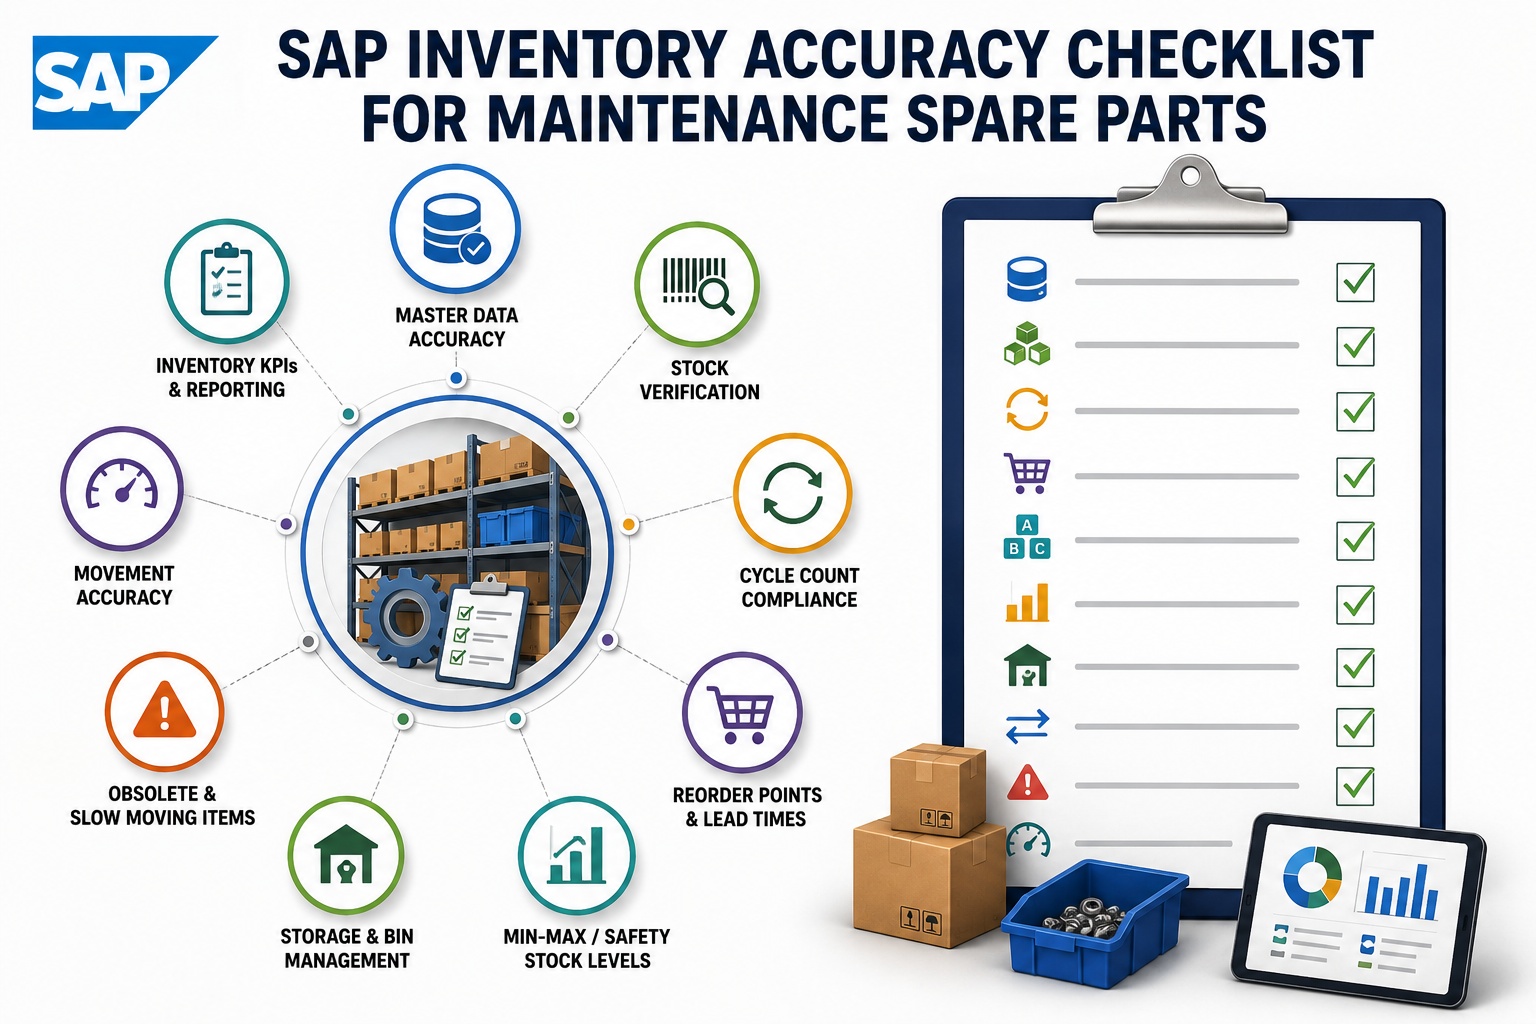
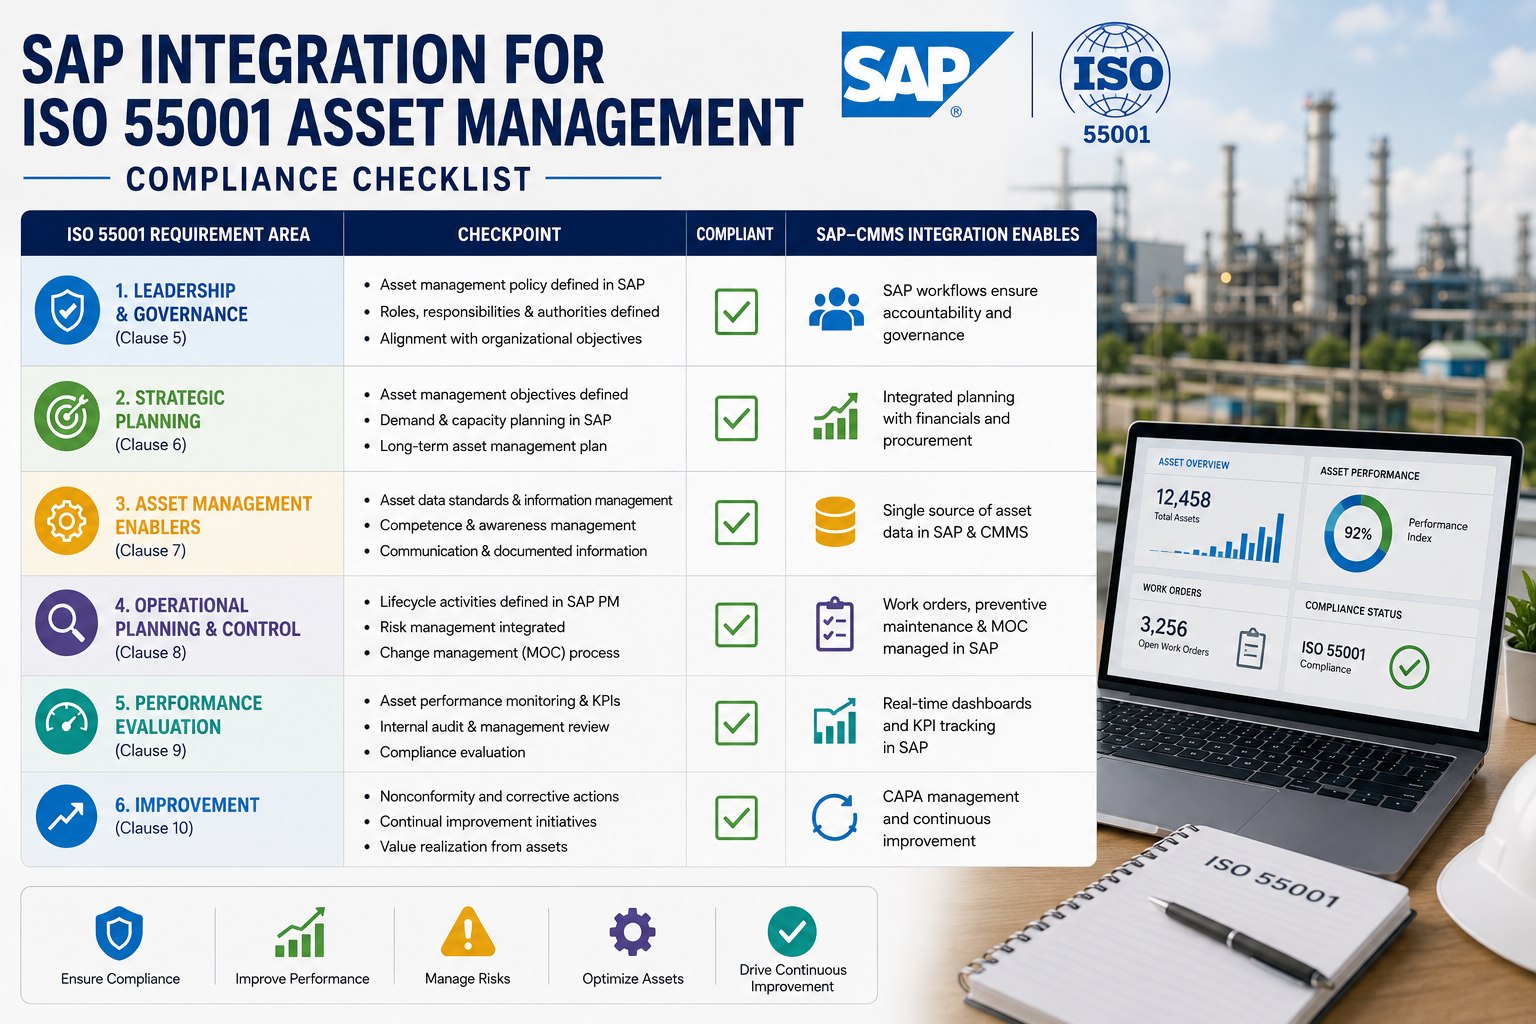
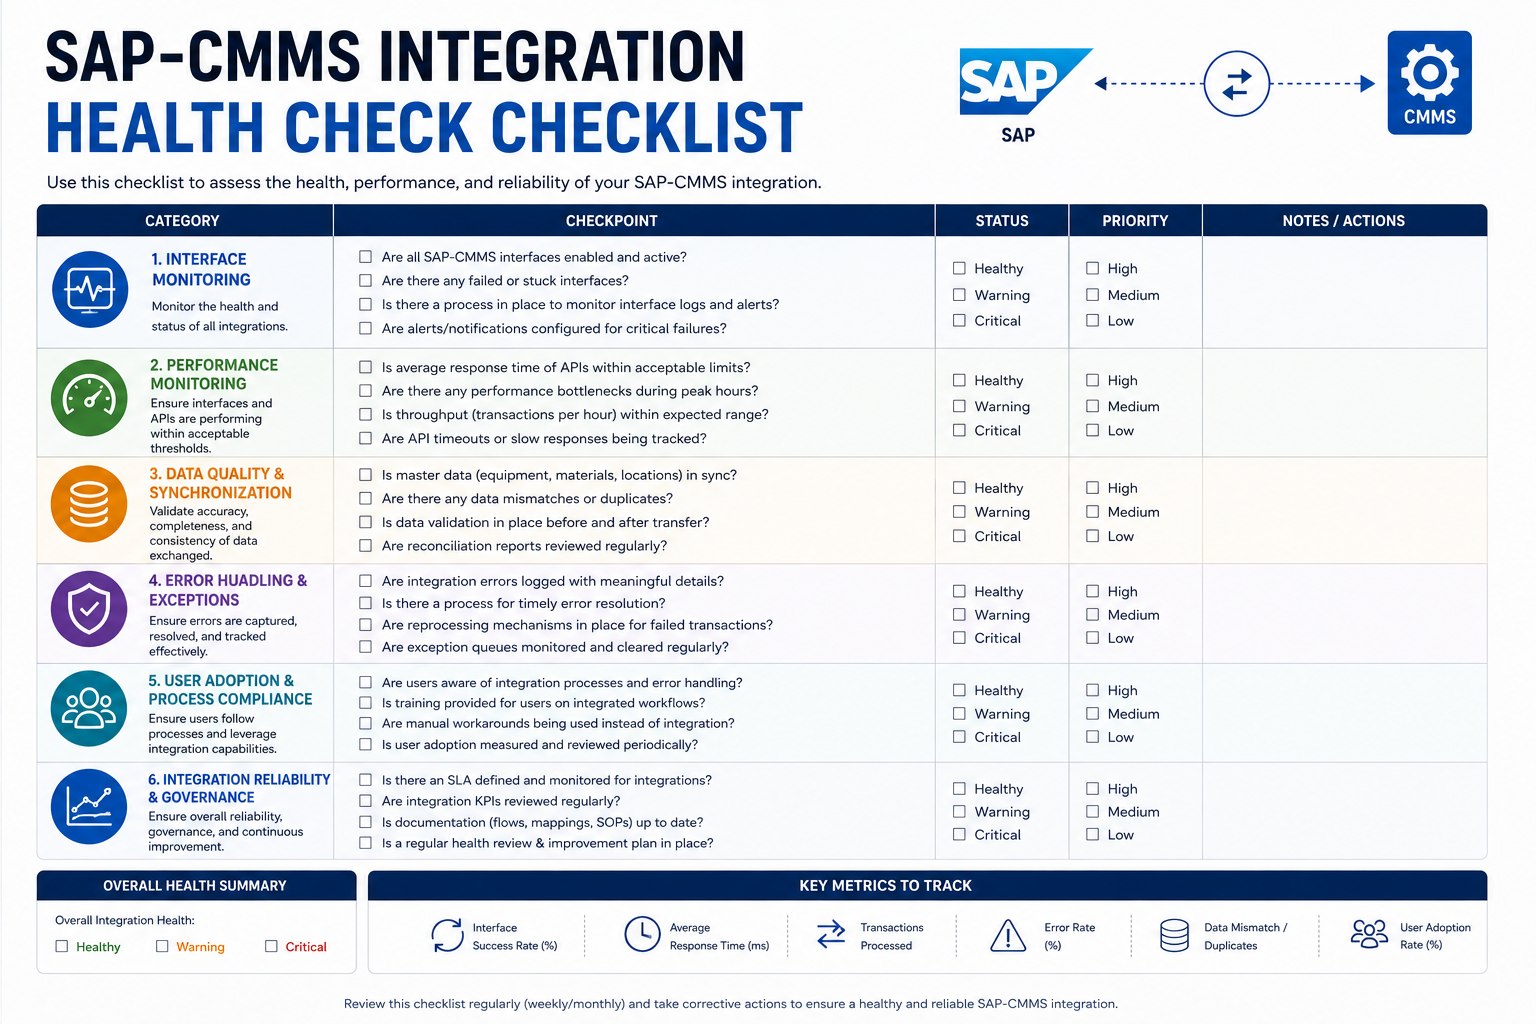
SAP PM audits surface the gaps daily operations work around but never fix. Duplicate equipment records that planners ignore. Aged backlog that everyone assumes someone else owns. Cost settlement variance reconciled manually at month-end. Sync errors that have been firing for nine months but never made it into anyone's ticket queue. Each is a symptom of a governance gap that compounds into the operational drag executives notice only when something breaks. This 30-item, six-domain audit checklist covers what disciplined teams evaluate annually. Book a free demo to walk through audit findings.
14-22
Average audit findings discovered per cycle in mature SAP PM environments without active governance
Source: SAP audit benchmarks
6
Audit domains that collectively cover all major SAP PM governance dimensions
Source: This framework
30
Specific evaluation items, each with quantified industry benchmark
Source: This page
90 days
Typical remediation window for audit findings before next operating cycle
Source: Industry remediation pace
Why SAP PM Audits Find What Daily Operations Miss
Daily SAP PM operations are optimized for throughput, not governance. Planners process work orders. Technicians close them out. Supervisors track completion. Nobody in the daily flow has the explicit responsibility to ask whether the equipment masters are still clean six years after go-live, whether the backlog mix matches the asset criticality distribution, or whether the cost settlements actually flow to the cost centers the original configuration intended. These questions get answered only during a structured audit cycle, and the answers are almost always uncomfortable—because the gaps compound silently across operating quarters until something forces attention.
The disciplined organizations run a comprehensive SAP PM audit annually—not because regulators require it, but because the cost of finding governance issues in a controlled audit is roughly one-fifth the cost of finding the same issues during a production incident or executive escalation. The audit produces an objective evaluation across six domains, each measured against published industry benchmarks. Maintenance and reliability leaders ready to run this audit on their current SAP PM environment can Sign up free to begin a structured audit cycle against the six-domain framework.
The Six-Domain SAP PM Audit Scorecard
The scorecard below evaluates SAP PM operations across the six governance domains that collectively determine maintenance program health. Each item has a quantified target benchmark drawn from industry best-practice publications. The discipline is to score each item objectively against the benchmark, document the evidence, and identify gaps that require remediation before the next audit cycle.
Target ≥Performance must meet or exceed target
Target ≤Performance must stay below threshold
Target =Performance must hit exact value
- Equipment master deduplication rate≥ 98%
- Functional location hierarchy completeness= 100%
- BOM completeness on critical equipment classes≥ 95%
- Cost center linkage accuracy on equipment master= 100%
- Material master active & consistent (vs SAP MM)≥ 97%
D2
Audit Weight: Critical
- PM compliance rate (completed on schedule)≥ 90%
- PM schedule adherence within tolerance window≥ 85%
- PM cycle review & calibration cadence= Annual
- Counter-based PM measurement document accuracy≥ 95%
- PM-to-corrective ratio (proactive vs reactive)≥ 60:40
- Work orders with complete asset linkage= 100%
- Work orders with task list / job plan assigned≥ 85%
- Planning lead-time adherence (planned vs actual)≥ 80%
- Cost variance at closure (planned vs actual)≤ ±10%
- Closure completeness (time, parts, observations)≥ 95%
- Total backlog hours ÷ weekly crew capacity= 2-4 wks
- Aged backlog (work orders > 90 days)≤ 10%
- Critical & safety backlog older than 30 days= 0
- Backlog balance across crafts (variance band)≤ ±15%
- Backlog priority distribution documented & reviewed= Monthly
D5
Audit Weight: Medium-High
- Work order settlement completion rate at month-end≥ 95%
- Settlement variance (debit vs credit reconciliation)≤ 5%
- Direct labor capture rate vs payroll baseline≥ 85%
- Parts cost allocation to work order accuracy= 100%
- Maintenance cost reporting timeliness≤ T+3 days
- SAP-CMMS sync error rate (rolling 30-day)≤ 1%
- End-to-end sync latency (transaction posting)≤ 5 sec
- Master data drift between SAP and CMMS= 0
- Mobile work order platform availability (uptime)≥ 99.5%
- Audit log completeness & retention compliance= 100%
D2
Critical-Weight Domain
The headline domain in the scorecard is D2—PM Compliance & Effectiveness—because every other domain feeds it. Master data quality (D1) determines whether PM plans even target the right equipment. Work order quality (D3) determines whether PM execution data is reliable. Backlog health (D4) determines whether resource capacity exists to execute scheduled PMs at all. A program that scores well on D2 typically scores well across all six domains. A program that scores poorly on D2 almost always has root causes in D1 or D4 that have to be fixed first. Reliability leaders ready to score their own environment against this framework can Sign up free to score the six-domain audit on their SAP PM environment.
Three Audit Findings That Predict Larger Problems
Three specific audit findings—each common, each easily overlooked, each predictive of larger underlying issues—account for a disproportionate share of post-audit remediation effort. Each is worth investigating with extra rigor when it surfaces.
F1
Aged Backlog > 30% of Total
When more than 30 percent of backlog is older than 90 days, the operational system has lost the ability to discriminate priority. Items sit in the backlog because the system isn't being actively managed. Typical underlying root cause: scheduling discipline has degraded; backlog reviews are happening less than monthly or not at all.
Surfaced By
D4 items 2 & 5 (aged backlog & priority review cadence) failing target benchmark in the audit
F2
Settlement Variance > 10%
When the gap between work order planned cost and actual settled cost runs above 10 percent, financial reporting integrity is compromised. Maintenance cost reports become approximations rather than evidence. Typical underlying root cause: cost center configuration drift, or labor capture gaps that have accumulated since go-live without correction.
Surfaced By
D5 items 2 & 3 (settlement variance & labor capture rate) failing in the audit scorecard
F3
Sync Error Rate Trending Upward
Even sync error rates well below 1 percent are flagged if they're trending up. Increasing sync errors indicate either a configuration change introducing new failure modes, or upstream data quality degradation that the sync layer can't accommodate. Typical underlying root cause: changes deployed without integration regression testing.
Surfaced By
D6 items 1 & 3 (sync error rate & master data drift) trending unfavorably across audit cycles
The pattern in all three findings: a metric that looks acceptable on a single audit becomes alarming when trended across multiple audits. Annual auditing without trend analysis misses these signals. Disciplined organizations track each metric across audit cycles and treat unfavorable trends as audit findings in themselves, regardless of current absolute values. Audit leaders ready to set up trend tracking against their historic scorecard can Sign up free to track audit scorecards across cycles with trend analysis.
See the Six-Domain Audit Scorecard on a Live SAP PM Environment
Walk through the audit framework on actual SAP PM data, with item-by-item benchmark scoring, evidence capture, and remediation tracking. 30-minute live demonstration.
From Audit Findings to Remediation: The 90-Day Path
An audit that doesn't produce remediation isn't an audit—it's a status report. The discipline that turns audit findings into operational improvement follows the cadence below. The pace matters: remediation activity that drifts beyond 90 days typically loses sponsor attention and stalls.
Days 1–14
Findings & Prioritization
Audit findings documented with evidence. Findings prioritized by domain weight, current performance gap, and operational risk. Sponsor review and acceptance of finding inventory.
Days 15–35
Remediation Planning
Each finding assigned to owner with target completion date. Remediation actions documented with evidence requirements. Resource and budget allocation approved. Kick-off meeting per workstream.
Days 36–75
Remediation Execution
Owners execute corrective actions. Weekly progress reviews. Blockers escalated to sponsor. Interim audits verify that remediation actions are producing the targeted metric improvements.
Days 76–90
Verification & Closure
Each remediation action verified against target benchmark. Evidence captured. Findings either formally closed or carried forward to next audit cycle with documented rationale. Sponsor sign-off.
By day 90, every audit finding has either been remediated and closed with documented evidence, or has been carried forward with explicit rationale and a new target date. That documentation is what turns audit cycles from periodic compliance exercises into the continuous improvement engine that drives measurable maintenance program improvement year over year. Maintenance and reliability leaders ready to walk this cadence on their next audit can Book a free demo to map the remediation cadence to a current audit cycle.
Expert Perspective: What Distinguishes Audits That Drive Improvement
The SAP PM audits I've seen that actually drove improvement share a property that's often missing in compliance-driven audits: they had real consequences. Findings produced corrective actions with owners, dates, and evidence requirements. Repeat findings across audit cycles triggered escalation rather than apologies. Sponsors held remediation reviews and asked why the same things kept appearing. The audits that didn't drive improvement looked the same on paper—same framework, same domains, same checklist—but findings disappeared into status reports that nobody read, corrective actions that nobody closed, and remediation deadlines that nobody enforced. The audit framework isn't the differentiator. The governance discipline around closing what the audit finds is what separates programs that improve year over year from programs that audit the same gaps for a decade.
Findings Need Real Consequences
Each finding gets an owner, a target date, and an evidence requirement. Repeat findings trigger escalation. Audits without follow-through become expensive compliance theater.
Trend Across Cycles, Not Single Snapshots
A metric inside benchmark this year but trending unfavorably is itself a finding. The patterns across multiple audit cycles surface issues invisible in any single snapshot.
Sponsors Must Engage
An audit without executive sponsorship is a checklist someone fills out. Sponsor engagement on remediation reviews is what converts findings into actual operational improvement.
Make Your Next Audit the One That Actually Improved Things
Six domains. Thirty benchmark-backed items. Remediation discipline that holds across operating cycles. See the framework running on a live SAP PM environment with multi-year trend tracking.
Frequently Asked Questions
How often should we run a comprehensive SAP PM audit?
Annual is the industry standard for comprehensive audits covering all six domains. Quarterly mini-audits on the most volatile domains (D2 PM Compliance, D4 Backlog Health, D6 Integration Performance) provide earlier signal on emerging issues. Some highly regulated industries (pharmaceutical GMP, nuclear) run quarterly comprehensive audits with annual external review. The cadence should match the rate at which underlying issues compound—if a single quarter of drift can produce material operational impact, quarterly auditing is justified. For most industrial operations, annual comprehensive plus quarterly targeted is the right balance.
Who should own SAP PM audit ownership inside the organization?
Audit ownership belongs with a function that has objectivity from daily operations but understanding of operational reality. Most commonly this is either Maintenance Engineering, Reliability Engineering, or a dedicated Asset Management function. Internal Audit typically participates as a stakeholder but rarely owns the technical content. The audit team should include perspectives from maintenance planning (operational reality), SAP configuration (technical accuracy), and finance (cost integrity). The function that owns daily operations should not own audit findings on their own work—that creates conflict of interest the audit is specifically designed to surface.
How do industry benchmarks compare across sectors?
PM compliance targets are reasonably consistent across sectors at 90 percent or higher for mature programs. PM-to-corrective ratios vary more by sector: process industries (refining, petrochemical) typically target 70:30 proactive-to-reactive, while discrete manufacturing often runs closer to 60:40. Backlog targets shift with asset criticality—nuclear and pharmaceutical operations target tighter aged-backlog limits than typical manufacturing. The framework benchmarks reflect general industrial best practice; sector-specific or regulatory contexts may justify tighter targets on specific items.
What evidence should we capture for each audit item?
Each item needs objective evidence supporting the score, not narrative assessment. For master data quality items, evidence is database query output showing deduplication rates, hierarchy completeness percentages, etc. For PM compliance, evidence is SAP PM compliance reports filtered to the audit period. For backlog health, evidence is backlog aging reports and trend analysis. For integration performance, evidence is sync log analysis with error counts and latency measurements. The principle: an external reviewer should be able to reproduce the score from the captured evidence without relying on the audit team's interpretation.
How do we handle findings that have been open for multiple audit cycles?
Repeat findings are themselves a separate audit finding—evidence that the remediation process isn't working. The pattern should trigger an escalation to executive sponsor, a root-cause investigation into why prior remediation efforts failed, and a structurally different remediation approach for the next cycle. Most repeat findings trace to one of three causes: insufficient resource allocation, lack of clear ownership, or the gap requires capability the current organization doesn't have (often pointing to a need for external expertise or system enhancement). Continued treatment of the symptom without addressing one of these root causes produces the multi-year repeat findings that characterize stagnant audit programs.