How a Steel Mill Improved Maintenance Visibility Through SAP and CMMS Integration
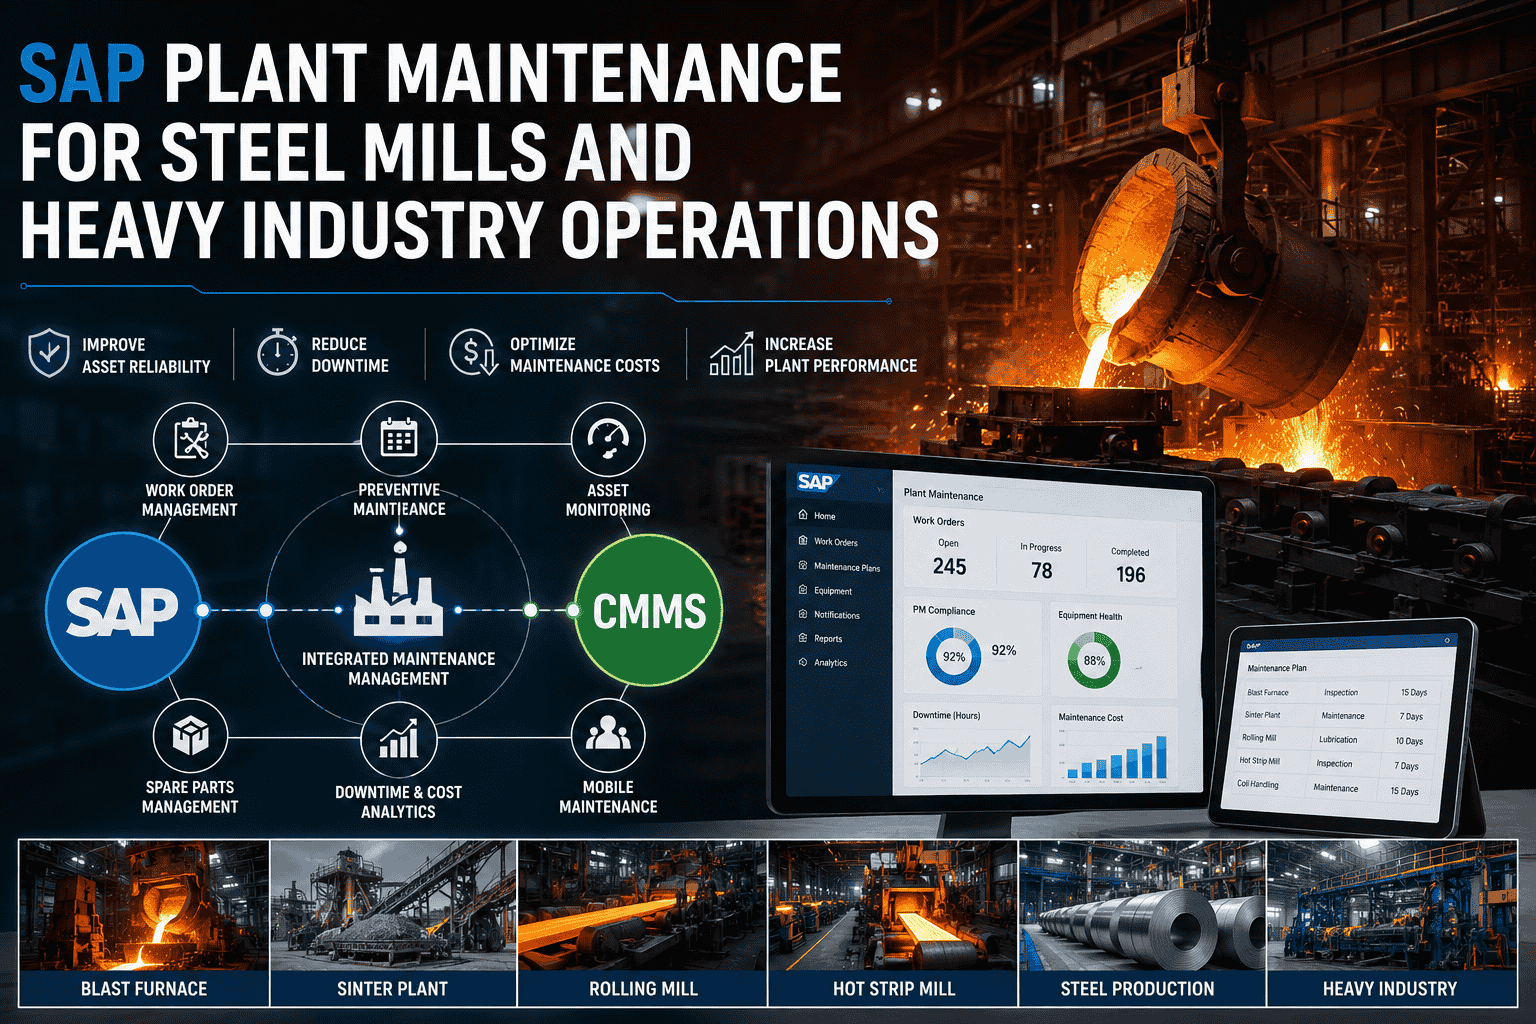
A North American integrated steel mill running blast furnace, casting, and rolling operations was burning roughly $32,000 per hour every time the hot strip mill stopped unexpectedly. The maintenance team used SAP PM for work orders, but field reality rarely made it back into the system in usable form. Reactive work dominated. Critical motors failed without warning. Spare parts spend ballooned with emergency purchases. Twelve months after integrating SAP S/4HANA with a modern CMMS and bringing AI analytics onto the plant floor, unplanned downtime dropped 38%, MTTR improved 26%, and the plant recovered roughly $4.6 million annually. Here is how the transformation unfolded.
STEEL MILL CASE STUDY
From $32,000/hour Outages to Full Maintenance Visibility
How a Tier-1 integrated steel mill turned reactive chaos into predictive operations with SAP + CMMS + AI integration in 14 weeks.
38%Downtime cut
$4.6MAnnual savings
14wkTo go-live
The Operating Reality Before Integration
Before the project started, the plant ran maintenance the way most legacy steel mills do—competent technicians compensating for systems that did not talk to each other. SAP held the work orders, the costs, and the master records. The maintenance floor lived on paper, radios, and tribal knowledge. Critical equipment failed without warning because nothing in either system could see degradation building up over weeks. The financial impact was significant: roughly 62% of maintenance work was reactive, and the hot strip mill alone accounted for the majority of unplanned downtime cost. The four pain points below shaped the entire transformation roadmap.
01
Data Disconnect
SAP Records Lagged Reality by Days
Work orders generated in SAP rarely matched what technicians actually did. Completion data was entered hours or days late, often missing root cause and parts consumed. Reports were unreliable because the data was.
02
Reactive Bias
62% of Work Was Reactive
Critical equipment like caster drives, mill motors, and hydraulic systems failed without warning. The maintenance team was constantly firefighting rather than executing planned work, which compounded asset wear.
03
Cost Blindness
Parts Spend Could Not Be Explained
SAP recorded the financial cost of every part issued, but no one could link spend spikes to specific failure patterns. Emergency purchases ran 3–4x normal pricing because procurement could not see them coming.
04
Visibility Gap
No Cross-Line Operational View
Each production line had its own maintenance lead with their own spreadsheet. Plant leadership had no consolidated view of equipment health, work backlog, or asset risk across blast furnace, caster, and rolling operations.
The combined effect was predictable—and expensive. A single avoidable hot strip mill stoppage cost more than the entire integration project. Operations leadership needed a way to see the plant as a single connected system instead of a collection of fragmented data sources. Teams facing similar visibility gaps can sign up free to assess their own maintenance visibility gaps against the same diagnostic framework used in this engagement.
The 14-Week Integration Roadmap
The project ran for 14 weeks from kickoff to plant-wide go-live, not counting the discovery phase that preceded it. The roadmap intentionally avoided big-bang risk: the team integrated SAP with the CMMS first, then deployed sensors on the highest-value assets, then expanded scope as confidence grew. Each phase produced something usable on its own, so value started compounding before the full rollout finished.
From Discovery to Full Visibility — 14 Weeks
1
Week 1–2
Discovery & Scoping
Asset criticality mapping, SAP PM data audit, integration scope definition
2
Week 3–4
SAP Connector Setup
OData connector configured for work orders, master data, and parts inventory sync
3
Week 5–8
Sensor Deployment
Vibration, temperature, and current sensors deployed on 47 critical assets across the plant
4
Week 9–12
AI Models & Pilot
On-prem AI analytics activated on hot strip mill; predictions validated against historical failures
5
Week 13–14
Plant-Wide Rollout
Mobile work order app live for 180 technicians; full SAP-CMMS bidirectional sync operational
All AI inference runs on an on-prem RTX PRO 6000 Blackwell server with Jetson AGX edge nodes — sensor data and predictions stay inside the plant network.
The critical move was sequencing. The team did not try to instrument every asset before integrating SAP. They proved the SAP-CMMS data flow with the first 12 assets, then expanded once technicians and supervisors trusted the workflow. Steel manufacturers planning similar projects can book a free demo to see the steel-industry integration in action and walk through the sequencing decisions in detail.
Before vs After: The Visibility Transformation
The clearest way to see what changed is to compare what plant leadership could see on any given Monday morning before and after the integration went live. Before, the dashboard was effectively a guess constructed from yesterday's spreadsheets. After, every critical asset reported its own health, every work order had real-time status, and predictions surfaced weeks of advance warning on emerging issues.
Plant Maintenance Dashboard — Same Plant, Twelve Months Apart
BEFORE
Fragmented Visibility
Data sync: 24–48 hour lag
Asset healthUnknown
Open work ordersApproximate
Parts on handStale
Failure predictionsNone
Cross-line viewManual rollup
12 months
AFTER
Real-Time Visibility
Data sync: live (sub-minute)
Asset health47 / 47 monitored
Open work ordersLive count
Parts on handSAP-synced
Failure predictions14–60 day lead
Cross-line viewUnified
Twelve-Month Results: Where the $4.6M Came From
The financial impact was not concentrated in one place. It came from six measurable improvements compounding across the plant, with the largest contributor being unplanned downtime avoidance on the hot strip mill. The improvement breakdown is shown below, with each result tied to the operational change that produced it.
38%
Unplanned Downtime
Driven by failure predictions on caster drives and mill motors
26%
Mean Time To Repair
Mobile work orders, parts pre-staging, and clear failure context
19%
Spare Parts Inventory
SAP MM data plus AI demand forecasting eliminated overstock
11%
Overall Equipment Effectiveness
Cumulative effect of fewer stops, faster repairs, better planning
$4.6M
Annual Operating Savings
Downtime avoidance, reduced overtime, lower emergency parts cost
34pt
Planned Maintenance Lift
Planned ratio rose from 38% to 72% of total maintenance work
The results compound year over year. The 38% downtime reduction in year one becomes a baseline the team continues to push down as more assets come under predictive coverage and the AI models accumulate more training data. Maintenance leaders can sign up free to start their own maintenance transformation and run the same diagnostic that scoped this engagement against their own asset base.
See the Same Integration on Your Plant Data
A 30-minute working session walks through the SAP connector, the sensor deployment approach, and the on-prem AI analytics layer—mapped to your own asset criticality and downtime cost profile.
Expert Perspective: Why This Works in Heavy Industry
LESSONS LEARNED
Three Principles Behind the Outcome
01
Integration Before Instrumentation
The team connected SAP PM and the CMMS before deploying a single sensor. That order matters. Without clean bidirectional sync, sensor data has nowhere useful to land, and predictions cannot trigger work orders that close cleanly. Many transformation projects fail because teams skip this foundational sequence and chase IoT pilots that never get embedded in the work order workflow.
02
Start With the Highest-Cost Assets
The plant did not try to instrument 200 assets simultaneously. They focused on the 47 that drove 80% of downtime cost—primarily the hot strip mill, caster drives, and primary mill motors. ROI showed up inside 90 days because the dollar exposure on those assets was massive. Picking high-value, high-failure-rate equipment for the pilot is how predictive maintenance proves itself in heavy industry.
03
Keep AI Inference Local
Sensor data and the AI models that score it run on on-prem hardware inside the plant network. For a steel mill with proprietary process data and 24/7 operational dependencies, sending raw sensor streams to a remote cloud was a non-starter on both security and latency grounds. Running locally also meant predictions kept working during external network outages—a hard requirement in continuous-process operations.
Every heavy-industry maintenance operation has hidden downtime cost the current systems cannot see. Oxmaint integrates with SAP, deploys AI on local hardware, and gives maintenance leaders the visibility that turns reactive operations into predictive ones.
Is the steel mill in this case study identified publicly?
The plant is described in anonymized terms to respect customer confidentiality—a common practice in B2B case studies, especially in heavy industry where competitive dynamics make customers cautious about disclosure. The metrics, timeline, and architectural approach reflect real engagement outcomes. Prospective customers under NDA can request direct references during a discovery call to validate the numbers against named operations.
How long does a steel mill integration like this typically take?
The 14-week timeline in this case is representative for a focused engagement: discovery (2 weeks), SAP connector setup (2 weeks), sensor deployment on critical assets (4 weeks), AI model activation and pilot (4 weeks), and plant-wide rollout (2 weeks). Larger or more fragmented SAP environments can extend the timeline to 18–24 weeks, particularly if SAP master data needs significant cleanup before integration begins. Discovery phase usually surfaces this early.
Does this require ripping out the existing SAP environment?
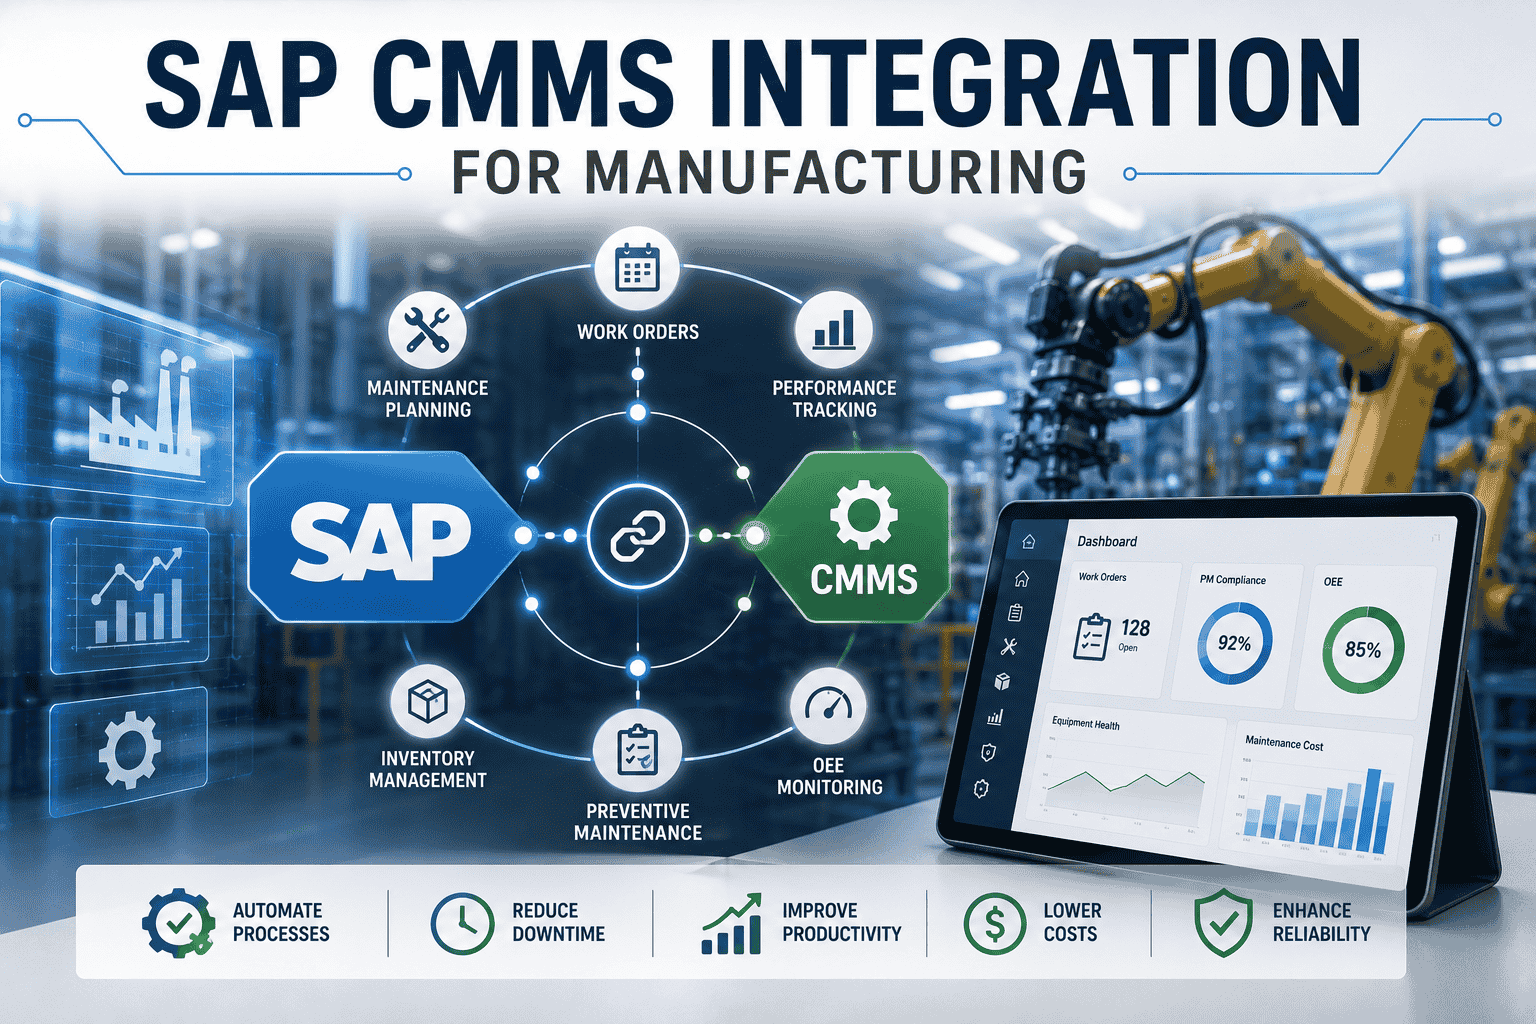
No. The integration sits alongside SAP, not on top of it. SAP PM continues to serve as the system of record for work orders, master data, and financial postings. The CMMS layer adds mobile execution, IoT sensor management, and AI analytics that SAP was not built to do natively. Bidirectional sync keeps both systems consistent, so the plant gets enhanced operational capability without losing SAP investment.
What was the ROI timeline on the $4.6M annual savings?
Initial savings began showing up in month three, primarily from the first prevented hot strip mill outage that the AI flagged 17 days in advance. Cumulative savings crossed the break-even point on the integration investment around month seven. The full $4.6M annual run-rate was reached by month twelve as more asset classes came under predictive coverage and the planned-maintenance ratio improved. Year-two returns compound further as the model library expands.
Can this approach work for other heavy industries beyond steel?
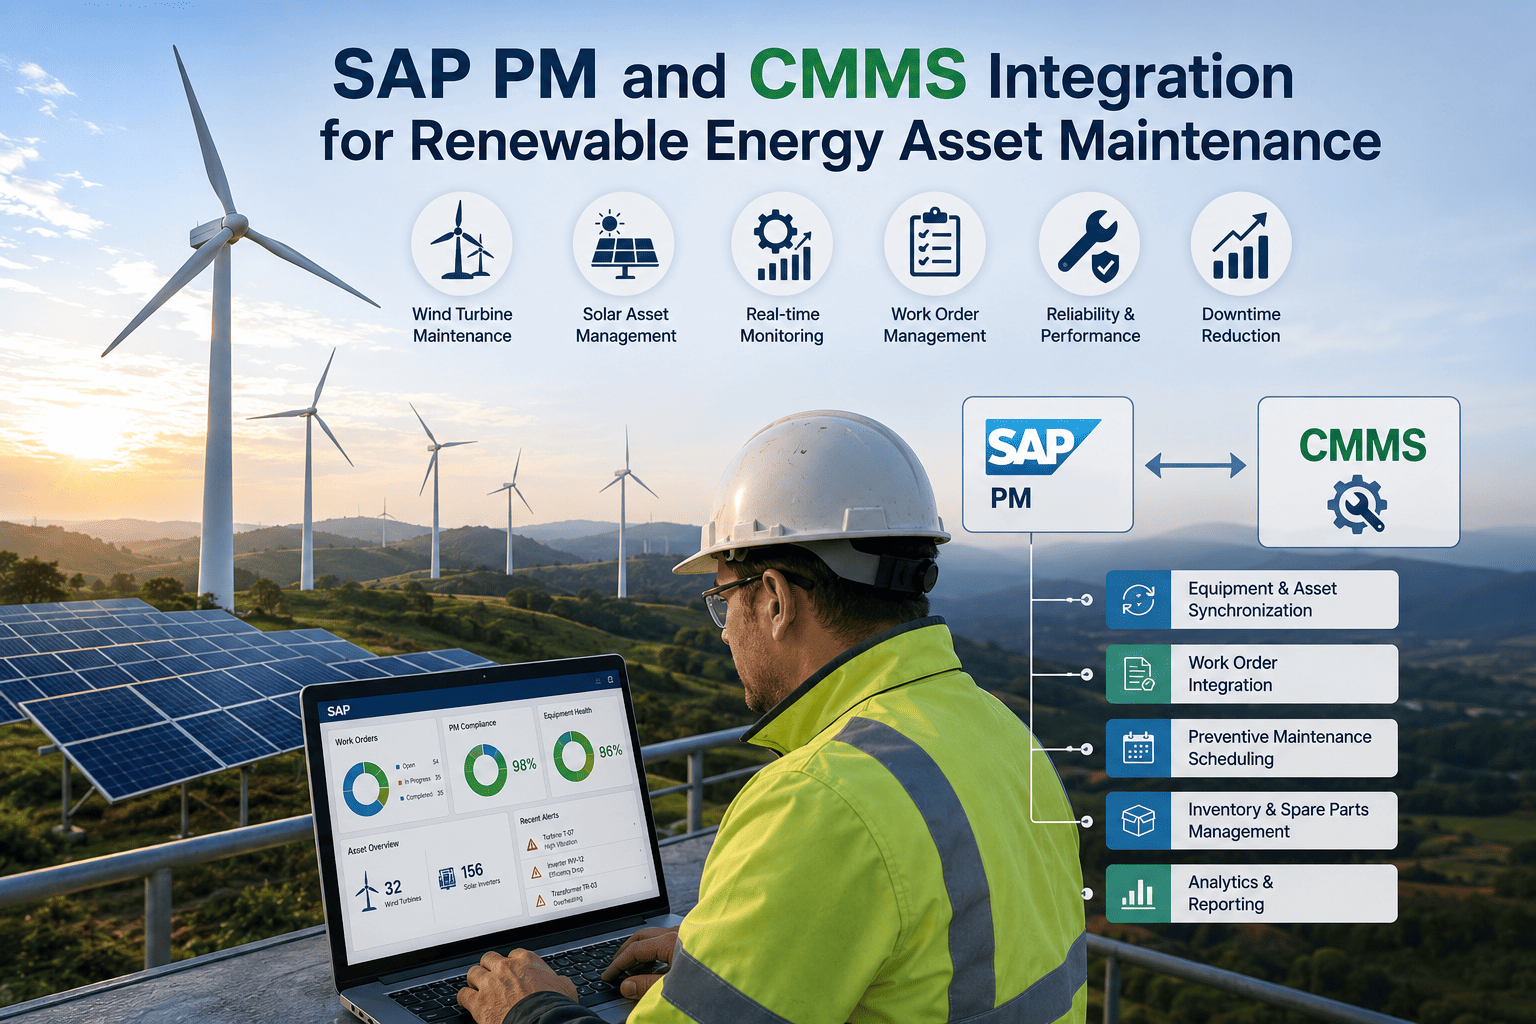
Yes. The same SAP + CMMS + AI integration pattern applies to cement, mining, thermal power, oil and gas, bulk chemicals, and pulp and paper—any industry where unplanned downtime is expensive, equipment is heavy and complex, and SAP is the enterprise system of record. The specific asset classes monitored differ by industry, but the integration architecture, sensor approach, and on-prem AI deployment model are transferable.