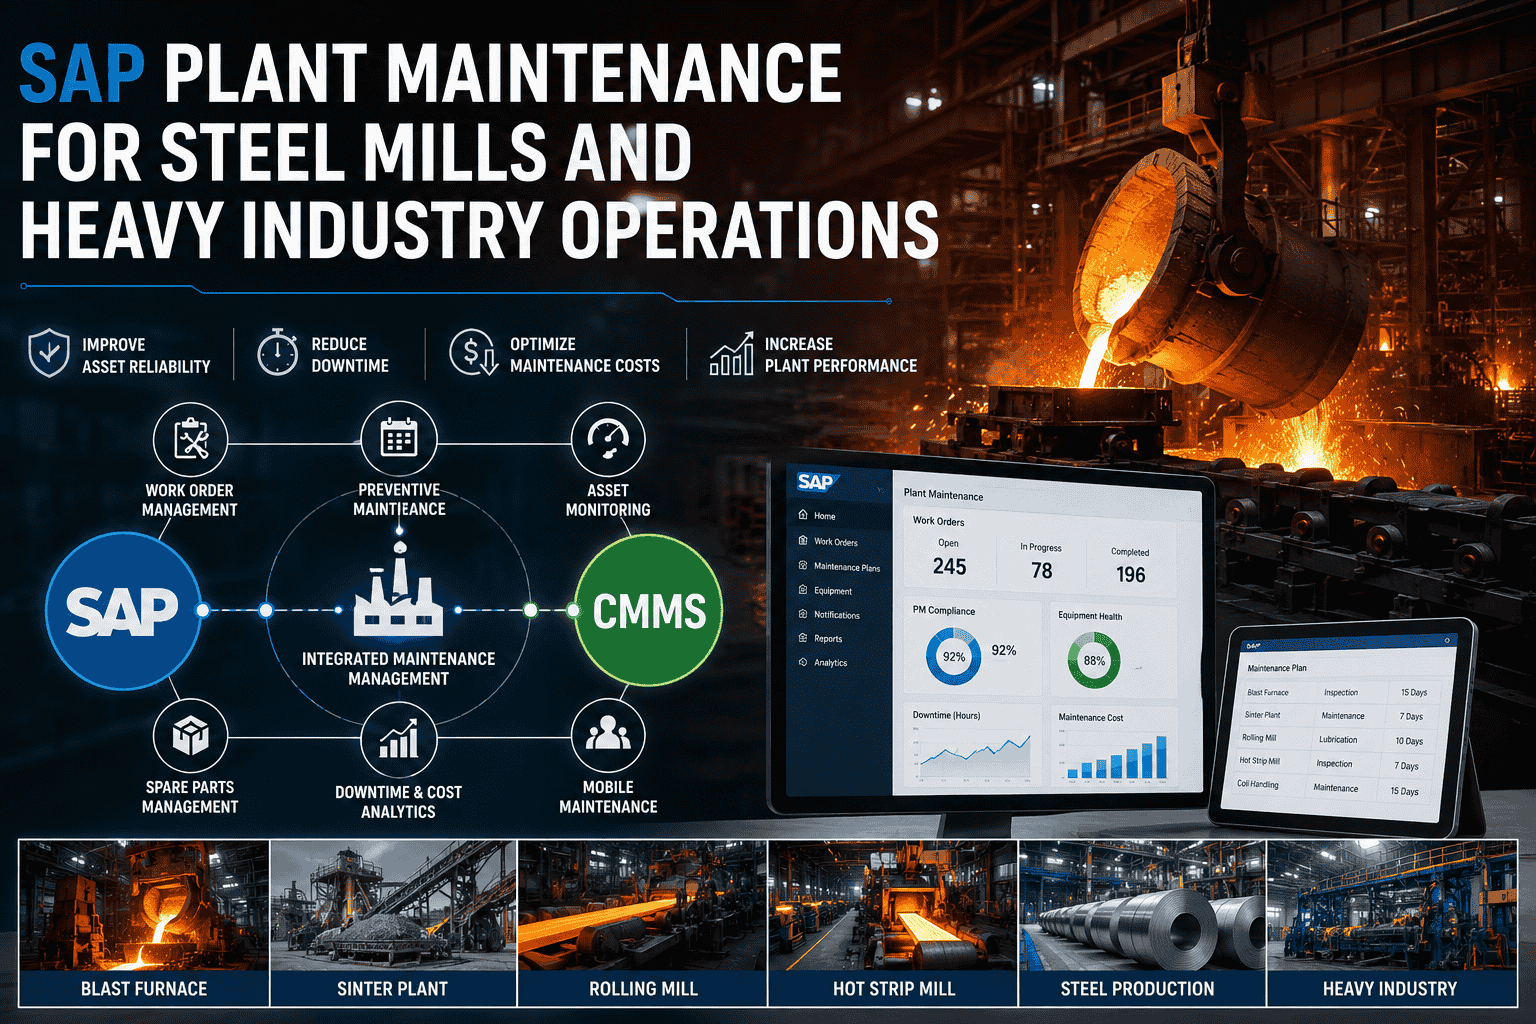
SAP Plant Maintenance for Steel Mills and Heavy Industry Operations
A blast furnace fault costs $80–120K per hour. A rolling mill bearing failure cascades through the entire production chain. Heavy industry maintenance has different math from general manufacturing, and SAP PM alone wasn't built for it. Book a free demo to see steel-grade integration in action.
HEAVY INDUSTRY GUIDE
SAP Plant Maintenance for Steel Mills and Heavy Industry
Five process stages, hundreds of critical assets, and a maintenance math problem that conventional CMMS deployments don't solve. This guide covers the integration architecture built for it.
$120K/hr peak downtime
40%Downtime cut
5Process stages
Why Steel Mills Have a Maintenance Problem Other Industries Don't
Steel mills run 24/7/365 with no soft landing. Every asset is part of a tightly coupled chain where one failure stops everything downstream. Hourly downtime costs are 5–10x higher than general manufacturing. Refractory degradation, thermal cycling, and metallurgical wear create failure modes that don't exist in lighter industries. SAP PM handles the financial side well, but the operational reality on a hot blast furnace floor needs more than what SAP alone delivers.
Heavy Industry vs General Manufacturing
Four dimensions where steel changes the maintenance math
Operating Schedule
GENERAL MFG
80hr/wk
2-shift weekdays, weekends off for maintenance
2.1×
STEEL MILLS
168hr/wk
24/7/365 continuous, no shutdown windows
Downtime Cost Per Hour
GENERAL MFG
$10K
Typical discrete manufacturing line
10×
STEEL MILLS
$100K
Blast furnace stoppage, peak cost-at-risk
Failure Impact Scope
GENERAL MFG
1asset
Failure localized to single line or machine
2.8×
STEEL MILLS
5stages
Cascades upstream and downstream within minutes
Asset Operating Conditions
GENERAL MFG
75°F
Ambient temperature, clean environments
29×
STEEL MILLS
2,200°F
Molten metal, abrasive dust, corrosive gas
Each multiplier compounds with the others. The combined effect is why heavy industry maintenance math looks fundamentally different from general manufacturing.
None of these pressures are unique to steel individually—but together they create a maintenance environment where conventional approaches break down. Heavy industry operations ready to address the full pressure profile can sign up free to assess their current maintenance posture against the four-pressure framework.
The Steel Mill Process Chain & Maintenance Integration Map
The five-stage steel production chain runs as a single connected process from raw materials to finished steel. Each stage has its own critical asset profile, characteristic failure modes, and downtime cost signature. The integration architecture below maps SAP-CMMS coverage onto each stage—because the integration that works for a hot strip mill is not identical to the integration that works for a sinter plant.
Steel Production Chain · Integration Map
Raw materials to finished steel · five stages · one connected architecture
RAW MATERIALS
Iron ore · coke · flux
01
Sinter Plant
Sintering machines
Mixers & conveyors
Ignition hoods
ESPs
$20–30K/hr
02
Blast Furnace
Furnace body
Tuyeres & stoves
Casting equipment
Top gas systems
$80–120K/hr
03
Steelmaking
BOF / EAF vessels
Ladles & cranes
Electrodes
Oxygen lances
$60–100K/hr
04
Rolling Mills
Roll stands
Bearings & drives
Hydraulic systems
Cooling beds
$40–80K/hr
05
Finishing Line
Coilers & levelers
Shears
Surface inspection
Packaging
$20–40K/hr
FINISHED STEEL
Coils · plates · bars
INTEGRATION LAYER · ACROSS ALL FIVE STAGES
SAP PM · master data & financials
CMMS · work orders & mobile
Sensors · vibration, thermal, refractory
AI · predictive failure detection
Blast Furnace stage carries the highest downtime cost—and the highest integration ROI. Every other stage benefits from coverage but the blast furnace earns the integration back fastest.
The process-chain view matters because it forces an honest conversation about scope. A plant trying to deploy CMMS coverage everywhere at once will struggle for budget approval; a plant prioritizing the blast furnace stage first delivers fast ROI that funds expansion. Steel operations ready to map this prioritization against their specific plant configuration can sign up free to scope a stage-by-stage rollout plan.
Map the Integration to Your Steel Mill
A 30-minute working session walks through the five-stage architecture using your specific plant—blast furnace count, steelmaking route (BOF vs EAF), rolling mill configuration, and existing SAP-PM scope—producing a prioritized integration roadmap your team can act on.
The Downtime Cost Cascade — Why Steel Math Is Different
The reason heavy industry maintenance economics look so different from general manufacturing is the cascade effect. When a single critical asset fails in a tightly-coupled process chain, the cost is not just the repair and the direct production loss. Every downstream stage also takes a hit. The visualization below shows what a typical blast furnace tuyere failure actually costs once the cascade is counted properly.
Single-Failure Cost Cascade
Blast Furnace #1 tuyere failure · 4-hour repair
TRIGGER EVENT
Tuyere failure on Blast Furnace #1
$400K direct cost · 4-hour outage
UPSTREAM IMPACT
Sinter Plant Idled
No demand for sinter output. Plant runs in standby, accumulating cost without value.
$80K
DIRECT IMPACT
BF #1 Repair & Restart
Tuyere replacement plus furnace stabilization. Restart procedures alone consume hours of operations time.
$490K
DOWNSTREAM IMPACT
Steelmaking + Rolling Starved
No hot metal supply to BOF; rolling mills run out of feedstock within hours. Both stages incur idle cost.
$540K
TOTAL CASCADE COST
$1,110,000
From a single tuyere failure · 2.8x the direct repair cost
The cascade multiplier is what makes integration ROI calculations look different in steel. A single prevented failure—catching the tuyere wear pattern 48 hours before failure and replacing during a scheduled window—saves not $400K but $1.1M. Across a year, even modest predictive coverage on the top assets typically returns 5–8x the integration investment. Steel operations modeling this math against their own plant can book a free demo for a personalized cascade calculation.
Implementation Roadmap for Steel Plant Integration
The implementation approach for a steel mill differs from general manufacturing in three important ways: critical assets carry far higher stakes (every decision is consequential), sensor coverage requires specialized hardware for extreme operating conditions, and the rollout must respect campaign cycles rather than working around shift schedules. The 18-week roadmap below is calibrated for these realities.
P1
Critical Asset Inventory & Failure History
Week 1–3
Audit every asset across all five process stages with criticality scores driven by downtime cost per hour. Pull 3-year failure history from SAP for top assets to baseline MTBF and identify recurring patterns. The asset list defines the integration scope.
P2
Sensor Coverage Design
Week 4–6
For each critical asset, specify sensor requirements: vibration on rotating equipment, thermography for refractory monitoring, hydraulic pressure for mill stands, current draw for electric arc furnaces. Heavy industry sensors require IP67+ ratings and high-temperature tolerance.
P3
SAP-CMMS Integration Build
Week 7–11
Configure the connector between SAP PM and the CMMS execution layer. Map functional locations across all process stages. Set up bidirectional sync for work orders, master data, and measurements. Validate edge cases—emergency orders, scope changes, campaign-driven shutdowns.
P4
Pilot on Highest-Cost Stage
Week 12–15
Activate the integration on the blast furnace or steelmaking stage first—the highest downtime cost concentration. Run for 60 days monitoring compliance, prediction accuracy, and technician adoption. Refine before expanding to other stages.
P5
Plant-Wide Rollout & Campaign Planning
Week 16–18
Expand integration to remaining process stages in waves prioritized by downtime cost. Align PM schedules with campaign cycles. Activate AI predictive modeling once sufficient training data accumulates. Begin the analyze-and-refine loop.
The 18-week timeline is realistic for steel plants with reasonable master data quality at the start. Plants with significant data clean-up needs typically extend to 22–24 weeks by adding a dedicated data preparation phase before P2. Heavy industry operations ready to walk through this roadmap against their specific plant can sign up free to map the 18-week plan in operational detail.
Steel-Grade Maintenance Integration, Without the Risk
Oxmaint integrates with SAP PM, deploys across all five steel production stages, and runs the predictive coverage that turns blast furnace cascade failures into scheduled tuyere replacements. Built for heavy industry from the architecture up.
How is SAP-CMMS integration for steel mills different from general manufacturing integration?
Three things change at the same time. First, the cost-per-hour math is 5–10x higher than discrete manufacturing, which changes every ROI calculation. Second, the sensor and connector hardware has to survive extreme operating conditions—2,000°F+ environments, abrasive dust, corrosive gases. Third, the implementation has to respect campaign cycles rather than working around overnight shutdowns, because there are no overnight shutdowns. The architecture is the same SAP-CMMS pattern, but tuned for these realities.
Which stage of the steel production chain should we prioritize first?
The blast furnace stage almost always delivers the highest first-year ROI. It carries the highest hourly downtime cost ($80–120K), the most catastrophic cascade impact when failures occur, and asset types (refractory, tuyeres, hot blast equipment) where predictive analytics produce the largest improvement over reactive maintenance. Mini-mill operations without a blast furnace typically prioritize the EAF and continuous caster stages by the same logic. The principle is consistent: highest downtime cost concentration gets covered first.
How much does a heavy industry integration project typically cost vs the annual benefit?
For an integrated steel mill, first-year implementation typically runs $800K–$1.5M depending on sensor scope, number of process stages covered, and SAP environment complexity. Annual benefits at full deployment typically run $5M–$12M, driven primarily by avoided cascade failures and improved campaign planning. Payback periods cluster around 9–14 months. Mini-mill operations see smaller absolute numbers but similar ratios—the percentage benefit holds across plant sizes.
Can predictive maintenance really work on blast furnace assets given the extreme conditions?
Yes, with the right sensor strategy. Thermography for refractory monitoring, acoustic emission sensors for tuyere wear, and gas composition monitoring for furnace health are established techniques producing weeks-of-advance warning on failure signatures. The integration architecture matters more than any single sensor type—what makes prediction reliable is the combination of multiple signal streams correlated against historical failure data via ML models trained on the specific asset class.
How do we measure success after steel plant integration goes live?
Five core metrics tracked monthly during the first year: cascade failures per quarter (target 50%+ reduction), unplanned blast furnace outages (target 30–40% reduction), PM compliance across all stages (target 95%+), prediction lead time on critical assets (target 14+ days for major refractory failures), and total downtime cost per quarter (target 30–45% reduction from baseline). These five together signal whether the integration is delivering the heavy-industry-specific outcomes it was designed for.