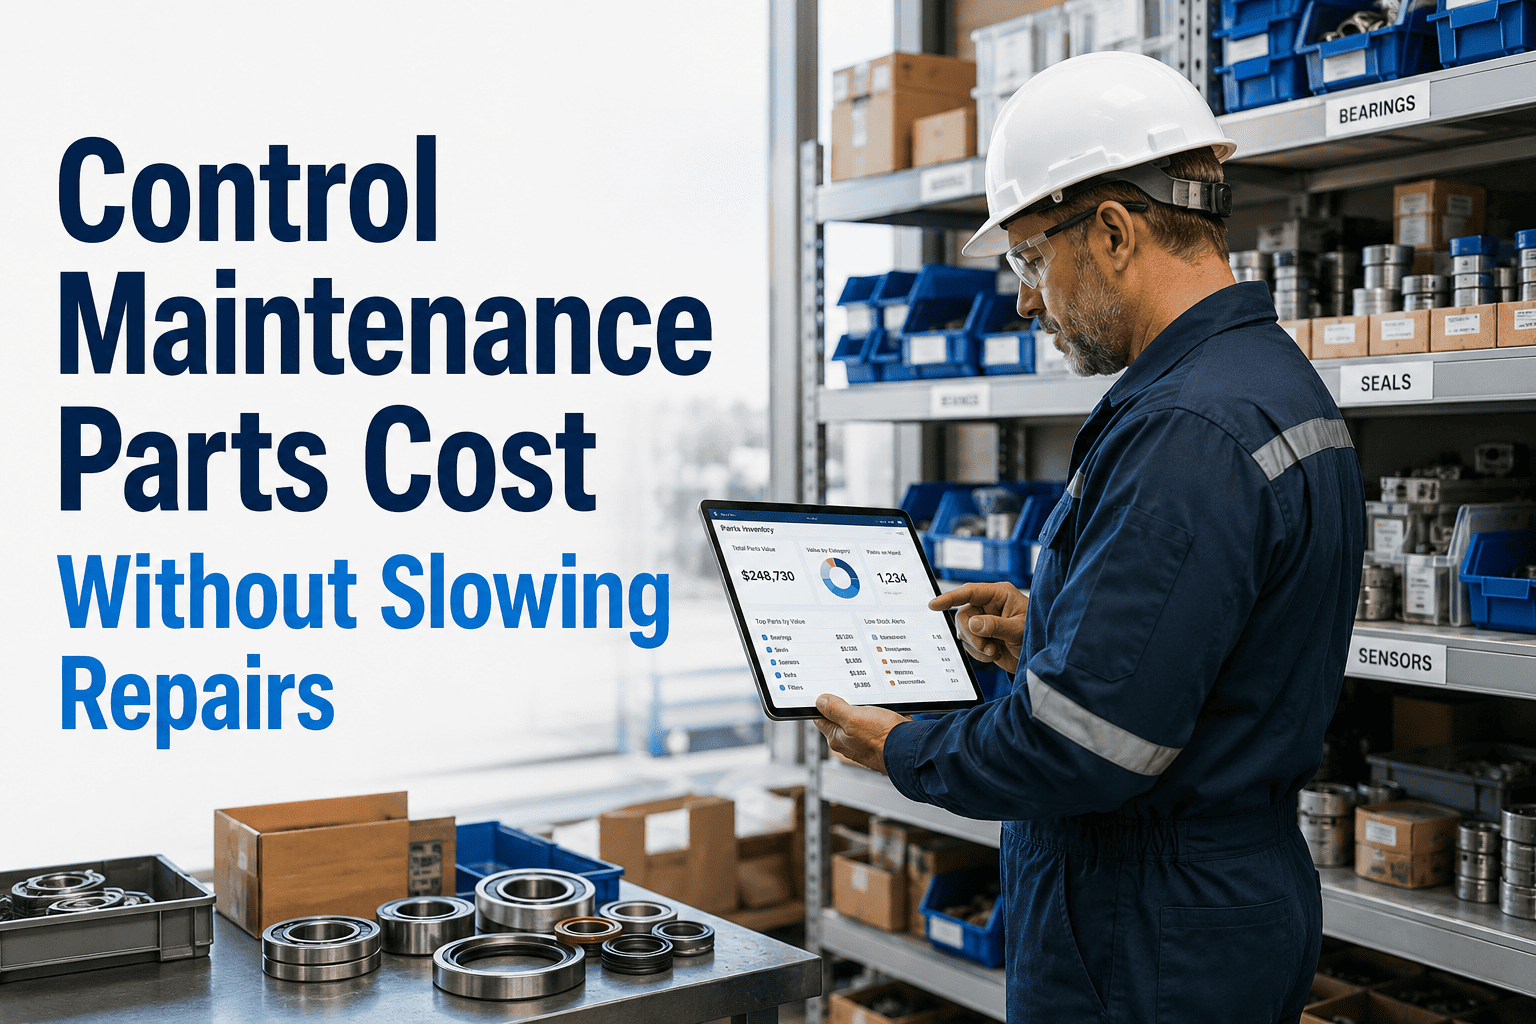
MRO spare parts inventory accounts for 40–50% of the total maintenance budget at most industrial facilities — yet 15–25% of that inventory is obsolete or surplus, sitting on shelves doing nothing. At the same time, 23% of unplanned downtime events are directly attributable to unavailable spare parts. The same storeroom carries too much of what it rarely needs and too little of what it urgently does. This is not a procurement problem — it is an intelligence problem. Facilities that are overstocked on low-criticality consumables and stocked-out on critical bearings are managing inventory by habit and anecdote rather than by asset-linked consumption data and statistically-derived reorder logic. Carrying costs run 20–30% of total inventory value annually — every dollar sitting on a shelf costs money in storage, obsolescence risk, and opportunity cost. A missing $200 bearing that causes one hour of unplanned downtime on a production line can cost $10,000–$150,000 in lost output. The math is not subtle. OxMaint's parts and inventory module connects every storeroom item to the assets that use it, the work orders that consume it, and the PM schedules that will demand it — giving maintenance teams the data to right-size stock levels, automate reorder triggers, classify spares by criticality, and eliminate the dead stock that consumes budget without protecting uptime.
The goal is not to reduce inventory — it is to hold the right inventory. Less of what rarely fails, more of what stops production lines, and exactly the right reorder logic for everything in between.
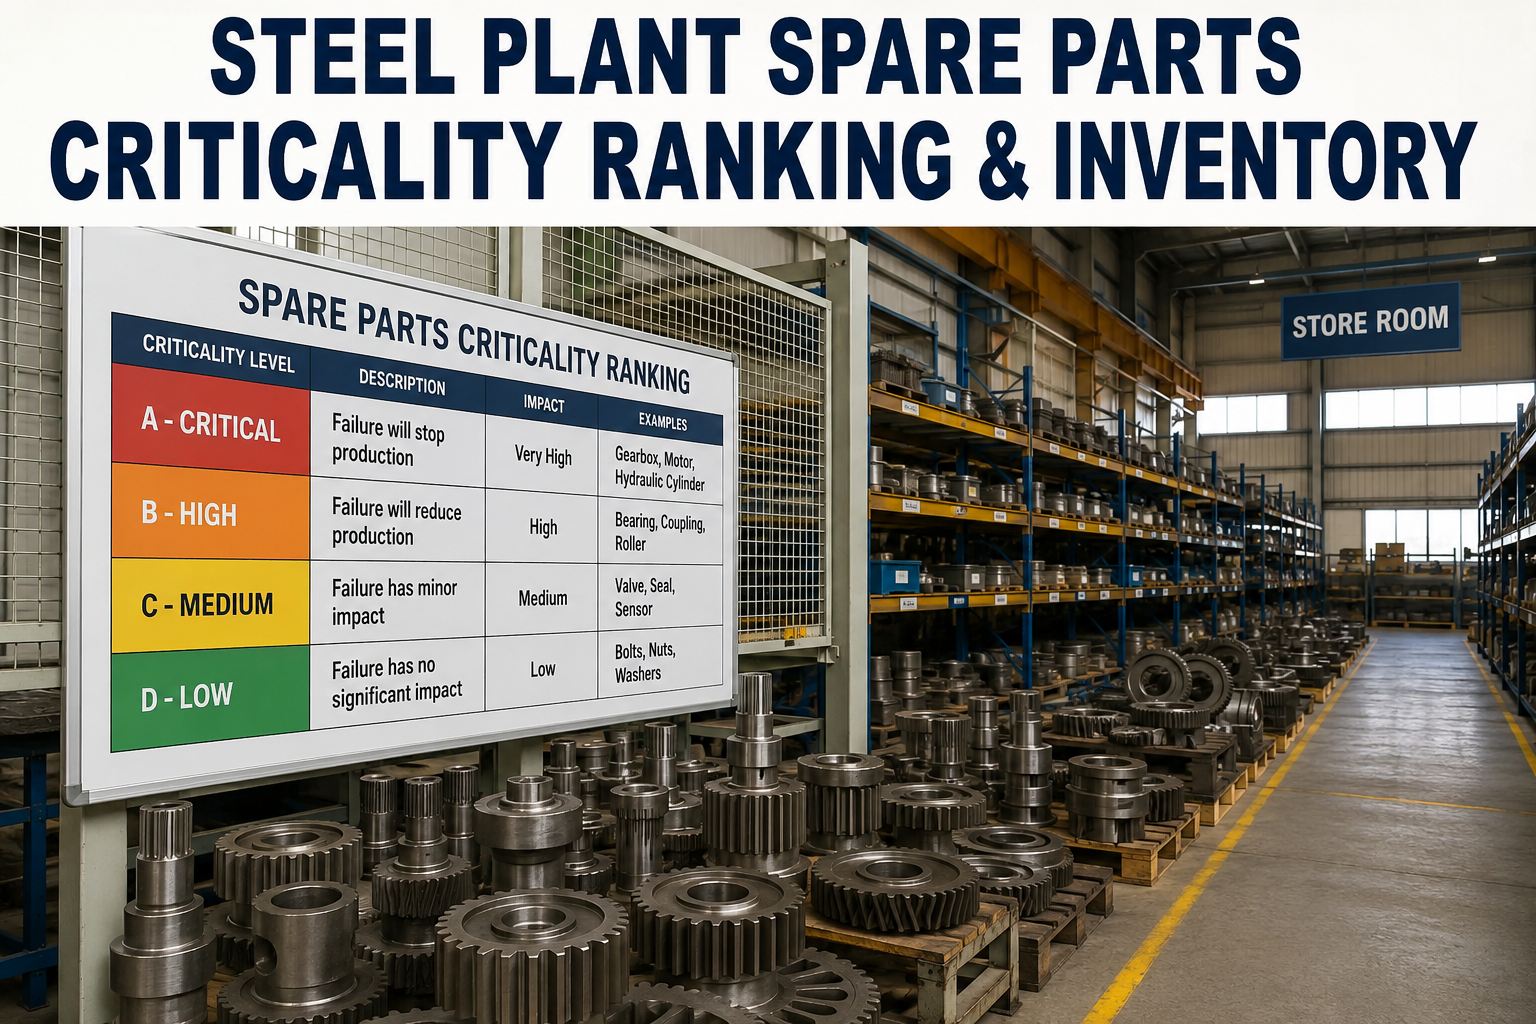
ABC analysis alone is insufficient for MRO inventory. A cheap consumable like a V-belt may be a C item by spend but is needed immediately when it breaks. A $10,000 spare motor may be an A item by spend but is only needed once every five years. Effective MRO classification combines value (ABC) with criticality (the consequence of stockout) to produce nine categories — each with its own stocking policy.
A reorder point based on "we usually keep two on the shelf" is a stocking policy built on memory. A reorder point derived from actual consumption history, verified lead times, and demand variability is a stocking policy built on evidence. OxMaint calculates reorder points from three data inputs that it collects automatically.
The fundamental capability that makes inventory optimisation possible is the asset-parts link. When every part in the storeroom knows which assets use it, consumption becomes predictable from the PM schedule rather than reactive from emergency callouts.
Parts cost is not only controlled at the storeroom — it is controlled at the point of requisition. Emergency purchasing, non-preferred supplier purchases, and off-catalogue procurement are the biggest sources of avoidable parts cost. OxMaint's approval workflows apply spend controls at the moment a parts request is created.
| Purchase Type | Trigger | Approval Required | SLA | OxMaint Control |
|---|---|---|---|---|
| Standard Reorder — In-Stock Supplier | Stock hits configured reorder point | Auto-approved up to configured limit (e.g. <$500) | PO issued same day | Automated PO generation — no manual step required below threshold |
| Standard Reorder — Over Limit | Stock hits reorder point, value > approval threshold | Storeroom manager or maintenance supervisor | Approval within 4 hours | Approval workflow with escalation if SLA missed — PO held until approved |
| Emergency Purchase — Not in Storeroom | Work order requires part not stocked — urgent breakdown | Maintenance manager sign-off + cost code confirmation | Approval within 1 hour | Emergency purchase flag logged against work order — visible in monthly spend report as avoidable cost |
| Non-Preferred Supplier | Requisition for part from supplier outside approved vendor list | Procurement manager required | Same business day | Supplier not on approved list triggers procurement review — preferred supplier alternatives shown before approval requested |
| Capital Spare — First-Time Purchase | New part proposed for stocking — no prior procurement history | Maintenance manager + asset owner | 48 hours | New part linked to specific asset(s) and criticality classification before approval — ensures stocking justification is documented |
Every maintenance manager I have worked with believes their storeroom is a cost problem. They are right, but not in the way they think. The problem is not that the storeroom is too large — it is that it is the wrong shape. Too much of the budget is concentrated in slow-moving, low-criticality parts that were purchased because someone once needed them in a hurry and decided to keep a few on hand ever since. Too little is invested in the cheap consumables that stop production lines — the fuses, the V-belts, the O-rings — because those items are so inexpensive individually that nobody ever prioritises their replenishment properly. What changes when you link your parts inventory to your asset register and your work order history is that you replace the anecdote with data. You can see that bearing 6205-2RS has been consumed 18 times in 24 months across six different assets — and you are stocking one unit. You can see that the $3,200 gearbox assembly for Line 4 has not moved in five years — and the asset it supports was replaced last year. One of those problems costs you downtime. The other costs you working capital. Both are visible the moment parts and assets are connected in a CMMS.
How does OxMaint handle slow-moving and insurance spare parts that should never be consumed?
OxMaint supports a dedicated insurance spare classification — parts that are stocked as emergency insurance against catastrophic failure but have zero or near-zero expected consumption. These parts are tagged in the storeroom with a different reorder logic (typically "do not reorder until consumed — then replace immediately") and are excluded from inventory turnover ratio calculations so they do not distort the performance metrics for the rest of the storeroom. Condition-based monitoring can be configured for insurance spares with defined shelf-life limitations — the part generates a replacement work order at its configured inspection interval even with no consumption event. Start your free trial to configure the insurance spare classification for your critical equipment spares.
Can OxMaint identify which parts are obsolete and link that to retired equipment?
Yes. OxMaint's obsolescence review report identifies parts that meet any of three criteria: no consumption in the configured review period (default 12 months), linked exclusively to assets that have been marked as retired or replaced in the asset register, or belonging to a part class for which no scheduled PM tasks remain in the active PM programme. The report shows the current stocked quantity, estimated value, and the asset linkage status for each flagged item — giving the storeroom team the information needed to initiate vendor returns, surplus sales, or disposal. Running this report quarterly and actioning the results is the primary mechanism for reducing the 15–25% obsolete inventory figure. Book a demo to see the obsolescence review report for your current inventory profile.
What KPIs does OxMaint report for storeroom performance?
OxMaint's storeroom performance dashboard tracks the six metrics that define a well-managed MRO storeroom: service level (% of requests filled from stock immediately — target 95–97%), inventory turnover ratio (annual consumption ÷ average inventory value — MRO target 1.0–2.0), stockout frequency (number of stockouts per month by criticality class), dead stock percentage (% of SKUs with no movement in 12+ months — target below 15%), emergency purchase percentage (emergency buys as % of total parts spend — target below 5%), and inventory accuracy (physical count match rate — target above 95%). Each metric is trended over rolling 3/6/12-month windows and broken down by storeroom location for multi-site operations. Start your free trial to configure the storeroom performance dashboard for your inventory profile.
How does OxMaint support cycle counting to maintain inventory accuracy between full physical counts?
OxMaint generates cycle count work orders on a frequency configured per part classification — A-High parts are cycle-counted monthly, B-Medium parts quarterly, C-Low parts semi-annually. Each cycle count work order lists the parts to be counted, the system-recorded quantity, and a field for the physical count result. Variances above a configured threshold (typically 5% or one unit, whichever is greater) trigger an investigation work order — requiring the storeroom team to identify and document the source of the discrepancy before the system quantity is corrected. If accuracy consistently falls below 95%, OxMaint surfaces a storeroom process alert. Book a demo to configure the cycle counting programme for your storeroom's SKU count and classification.
OxMaint connects every storeroom item to the assets that use it, the work orders that consume it, and the PM schedules that will demand it — so reorder points are calculated from data, critical spares are never out of stock, and the 15–25% of inventory that serves retired equipment is identified and eliminated before it finishes writing itself off.


.png)

