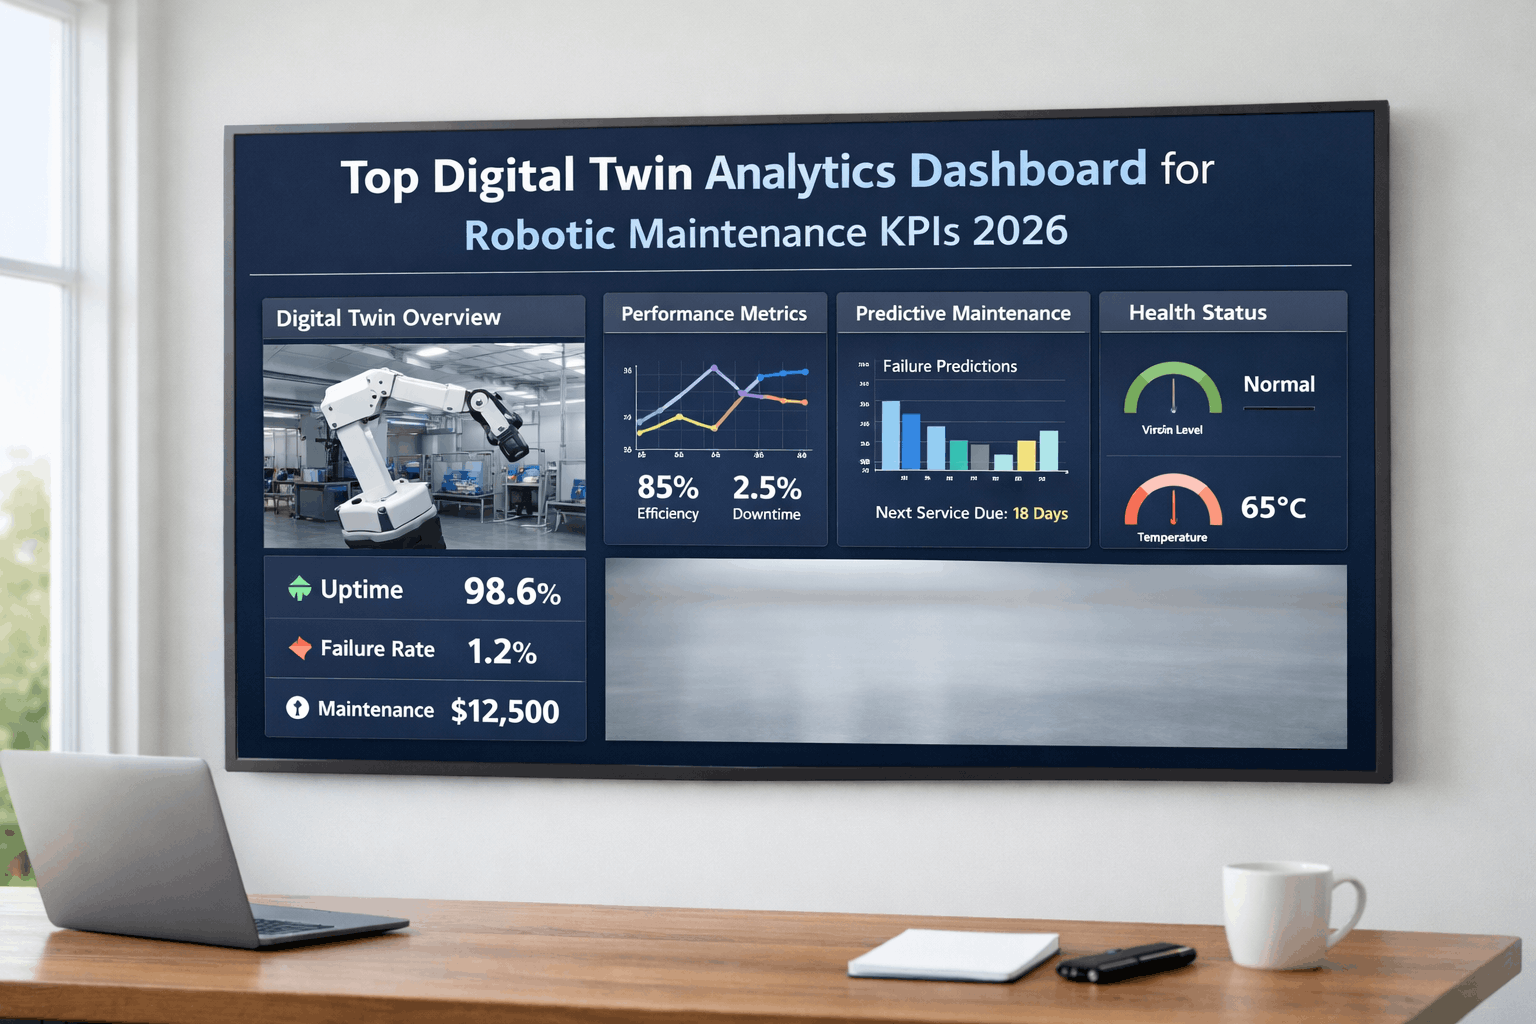
Top Digital Twin Analytics Dashboard for Robotic Maintenance KPIs 2026
Robotic maintenance has outgrown spreadsheets and static reports. As autonomous robots—quadrupeds, AGVs, AMRs, cobots, and industrial arms—scale across warehouses, factories, refineries, and logistics hubs, operations teams face a critical visibility gap: maintenance KPIs like MTTR, MTBF, and OEE exist in disconnected silos, making it impossible to correlate equipment health with operational performance in real time. The result is reactive firefighting instead of predictive optimisation, missed SLA targets, and maintenance budgets consumed by emergency interventions that proper analytics would have prevented.
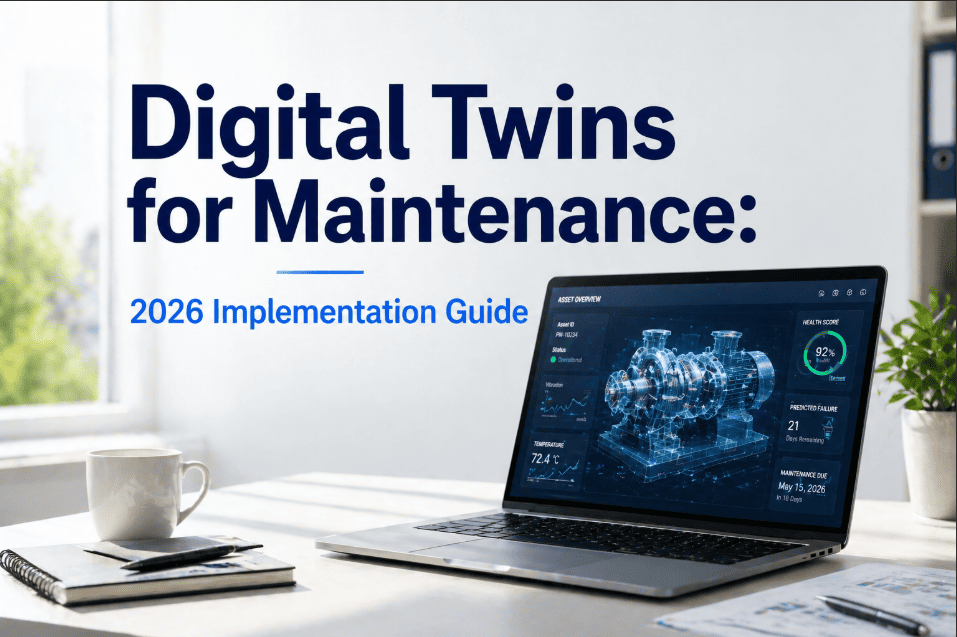
In 2026, digital twin analytics dashboards have closed this gap. By mirroring every physical robot as a live digital replica—fed by IoT telemetry, maintenance history, and operational data—these platforms deliver real-time KPI visualisation with drill-down into the CMMS layer where work orders, parts inventory, and technician scheduling live. Platforms like Oxmaint unify the digital twin view with CMMS execution, giving maintenance leaders a single pane of glass from fleet-wide OEE trends down to the specific work order causing a spike in MTTR. This guide evaluates the best digital twin dashboard platforms, explains the KPI architecture, and provides the complete framework for deploying analytics-driven robotic maintenance at your facility.
Complete Guide 2026
Top Digital Twin Analytics Dashboard for Robotic Maintenance KPIs
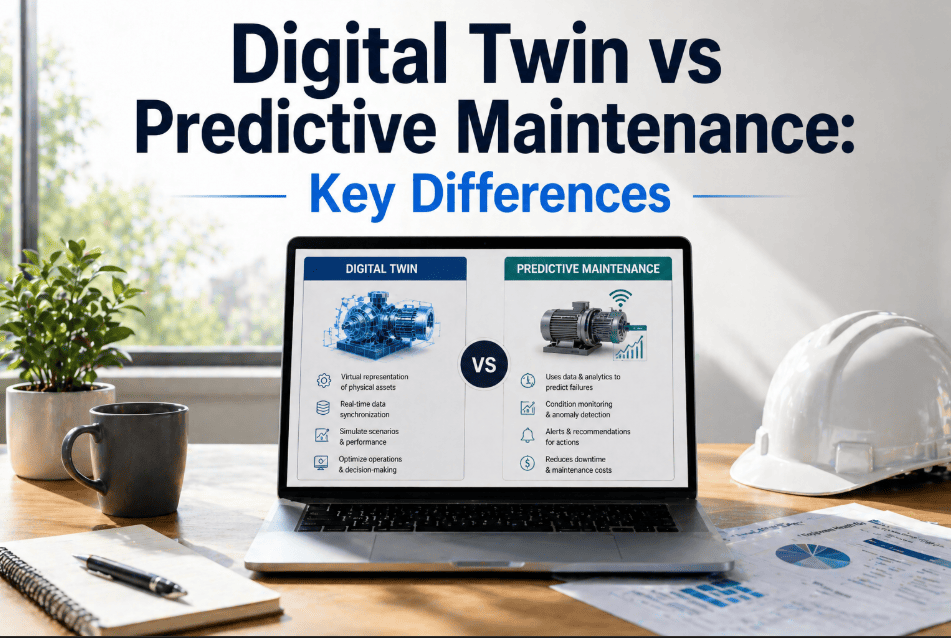
Digital twin dashboards display robotic maintenance KPIs—MTTR, MTBF, OEE—with CMMS drill-down capabilities. Monitor fleet health in real time, predict failures before they occur, and optimise maintenance schedules with analytics that connect live robot telemetry to actionable work orders. This is the definitive guide to selecting, deploying, and integrating the best digital twin analytics dashboards for robotic maintenance in 2026.
Dashboard Architecture: How Digital Twins Connect to CMMS
The best digital twin analytics dashboards in 2026 operate across three integrated layers: real-time IoT telemetry ingestion from robotic fleets, digital twin modelling that mirrors physical asset state and predicts degradation, and CMMS-connected drill-down that converts KPI anomalies into maintenance actions. Each layer solves a specific weakness of legacy reporting—and together they eliminate the delay between detecting a KPI deviation and executing corrective maintenance.
Three-Layer Digital Twin Dashboard Architecture6 Core Components
IoT Telemetry Ingestion
Real-time sensor data from motors, joints, batteries, hydraulics, and navigation systems streamed via MQTT/OPC-UA
Layer 1 | Live Data Feed | Sub-Second Latency
Digital Twin Engine
Physics-based and ML-driven models that mirror each robot's real-time state, predict degradation curves, and simulate failure scenarios
Layer 2 | Predictive Modelling | Asset Mirroring
KPI Calculation Engine
Automated MTTR, MTBF, OEE, availability, and utilisation calculations from combined telemetry and CMMS work order data
Layer 2 | Real-Time KPIs | Trend Analytics
CMMS Drill-Down Layer
Click any KPI anomaly to drill into Oxmaint work orders, part consumption, technician assignments, and repair timelines
Layer 3 | Work Order Context | Root Cause
Alerting & Auto-Dispatch
Threshold breaches trigger automated CMMS work orders with predicted failure window, priority score, and recommended actions
Layer 3 | Predictive Alerts | Auto Work Orders
Continuous Optimisation Loop
Repair outcomes feed back into digital twin models—improving prediction accuracy, PM intervals, and spare parts forecasting over time
All Layers | Self-Learning | Feedback Loop
The Cost of KPI Blind Spots: Failure Cascade
Without real-time digital twin dashboards, robotic maintenance operates on lagging indicators. By the time a monthly MTBF report shows degradation, the failures have already occurred—and so have the production losses, emergency repair costs, and SLA breaches. The cascade below shows how a single unmonitored KPI deviation triggers compounding operational consequences—and why live analytics with CMMS drill-down breaks the chain before costs escalate. Discover how real-time KPI dashboards prevent this cascade.
Remaining robots absorb workload—accelerating their own degradation and creating multi-unit failure risk
Months 3-6
5
Budget & SLA Crisis
Emergency repairs consume budget, spare parts stockout, SLA penalties trigger, and operations leadership demands answers
Month 6+
Best Platforms Compared: Digital Twin + KPI Dashboard + CMMS
We evaluated the leading digital twin platforms, robotic analytics dashboards, and CMMS integration capabilities across the criteria that matter most for robotic maintenance: real-time KPI accuracy, predictive model depth, CMMS drill-down capability, fleet scalability, and total cost of ownership. Here is an honest head-to-head comparison for 2026.
A structured KPI monitoring cadence ensures your digital twin analytics programme delivers sustained improvement rather than one-time visibility. The combination of always-on dashboards and periodic deep-dive reviews creates layered accountability where no KPI deviation persists unaddressed for more than 4 hours.
Continuous
Digital twin dashboards display live MTTR, MTBF, OEE for every robotAnomaly detection algorithms flag KPI deviations automaticallyThreshold breaches trigger CMMS work orders without human interventionControl room displays show fleet-wide health status in real time
Daily
Maintenance lead reviews overnight KPI trends and open work ordersPredictive alerts triaged and assigned to technician schedulesParts consumption versus forecast reviewed for stock adequacyCompleted repair outcomes validated against twin predictions
Weekly
MTTR trending review—identify units with increasing repair timesMTBF analysis—flag robots with declining intervals for root cause investigationOEE comparison across fleet—identify underperformers and top performersPM schedule adherence audit with twin-recommended adjustments
Monthly
Fleet-wide KPI report generation with trend analysis and cost impactDigital twin model accuracy review and recalibrationComponent failure pattern analysis for capital replacement planningSpare parts demand forecast update from twin degradation models
Quarterly
Management ROI report with documented downtime reduction and cost savingsPM interval optimisation based on twin-validated degradation dataFleet expansion or retirement planning from lifecycle analytics
Connect Digital Twin Analytics to Automated Maintenance Workflows
Oxmaint ingests robotic telemetry, calculates real-time MTTR/MTBF/OEE, flags KPI deviations with predictive alerts, and auto-generates prioritised work orders—giving maintenance leaders a single pane of glass from fleet-wide trends to individual repair actions.
Analytics Maturity Spectrum: Where Does Your Operation Sit?
Most robotic operations sit somewhere between reactive spreadsheet tracking and fully predictive digital twin analytics. Understanding your current maturity level determines the integration strategy, investment priority, and expected ROI timeline for upgrading to twin-driven KPI management with CMMS execution.
Level 1: Reactive Reporting
Monthly Spreadsheet KPIsManual Data CollectionNo Real-Time VisibilityDisconnected from CMMS
Insight Delay: 4-6 weeks between KPI deviation and corrective action. 60%+ reactive maintenance.
Insight Delay: Under 24 hours for KPI visibility. But no predictive capability—still reactive to failures.
Level 3: Predictive Digital Twin
Digital Twin + Live KPIsPredictive Failure ModelsCMMS Auto-DispatchSelf-Learning Optimisation
Insight Delay: Under 4 hours from deviation to corrective work order. 85%+ predictive maintenance. 40% downtime reduction.
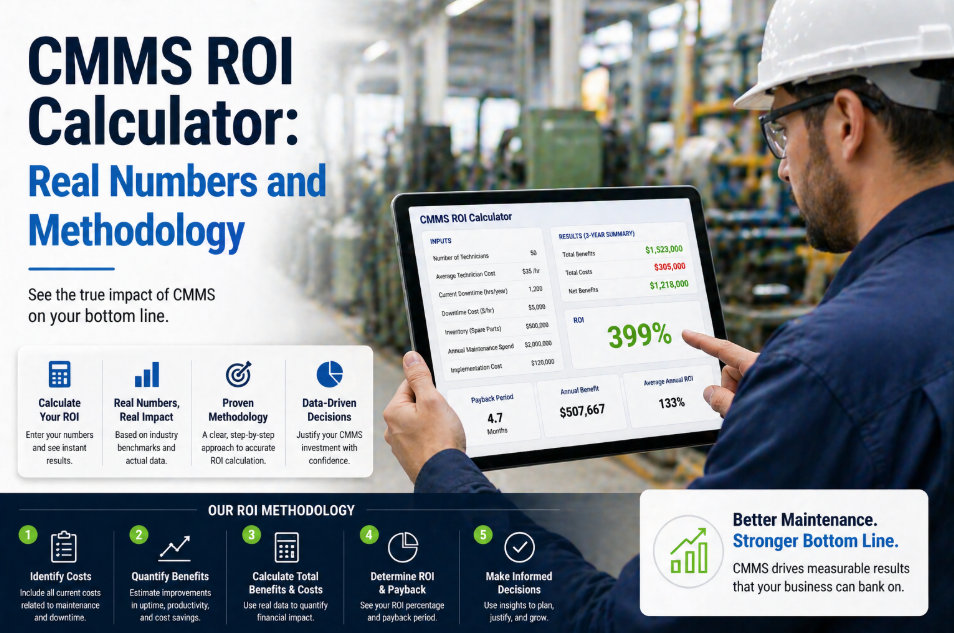
ROI Comparison: Reactive Reporting vs. Digital Twin Analytics
Annual Cost Impact: Robotic Fleet of 20-50 UnitsSpreadsheet KPIs vs. digital twin analytics with CMMS drill-down
Reactive Spreadsheet Approach
Unplanned downtime costs$120k - $600k/yr
Emergency repair premium$40k - $180k/yr
Manual KPI compilation labour$25k - $60k/yr
Missed PM optimisation waste$30k - $90k/yr
Insight-to-action delay4-6 weeks
Annual Waste: $215k - $930k+
VS
Digital Twin + CMMS Pipeline
Twin platform + CMMS licence$40k - $120k/yr
Downtime reduction (40%+)$48k - $240k saved
PM interval optimisation$20k - $60k saved
Parts inventory optimisation$15k - $45k saved
Insight-to-action delayUnder 4 hours
Net Annual Savings: $80k - $400k+
What CMMS Drill-Down Delivers: From KPI Anomaly to Repair Action
The difference between a KPI dashboard and a maintenance management system is the CMMS drill-down layer. Visibility without action creates frustration. Analytics without work order context creates guesswork. Oxmaint's CMMS drill-down transforms every KPI anomaly into a traceable path from deviation through root cause to verified repair—with full audit documentation.
MTTR Drill-Down Path
Click any MTTR spike on the dashboard to see the specific work orders causing delay—including parts wait time, technician assignment gaps, and repair complexity ratings
55% faster root cause identification for MTTR spikes
MTBF Component Analysis
Drill from fleet-wide MTBF trends to individual robot to specific component—identifying which servo, bearing, or battery model drives the degradation curve
100% of failure patterns traced to specific component or root cause
OEE Decomposition View
Break OEE into availability, performance, and quality components—see exactly which factor drags each robot below target with linked maintenance evidence
93% fleet OEE achievable with twin-optimised PM schedules
Predictive Work Order Queue
Digital twin predictions auto-generate prioritised work orders ranked by failure probability, production impact, and optimal maintenance window—before the failure occurs
85% of failures prevented through predictive work order execution
Turn Every KPI Deviation Into Predictive Maintenance Action
From real-time MTTR/MTBF/OEE dashboards to predictive failure alerts, auto-generated work orders, and verified repair outcomes—Oxmaint provides the complete digital twin analytics platform that proves maintenance ROI to operations leadership.
Integration Toolkit: Connecting Robots, Twins, and CMMS
The value of a digital twin analytics dashboard depends entirely on how well the three layers communicate. The integration toolkit below describes the six technical capabilities that Oxmaint provides to connect robotic fleets, digital twin engines, and maintenance workflows into a single analytics-to-action pipeline.
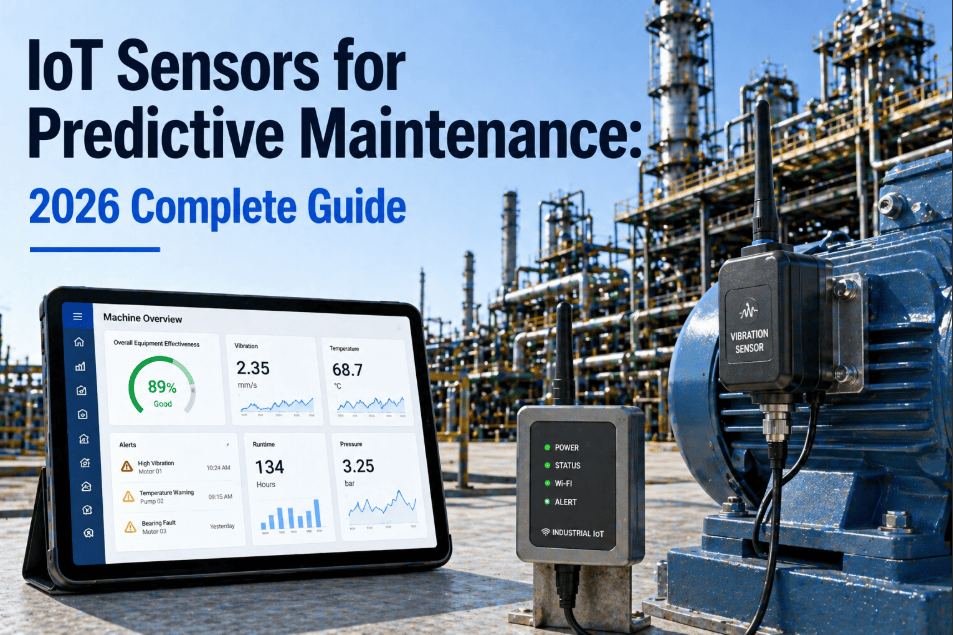
01Multi-Protocol Telemetry Ingestion
Oxmaint receives robotic telemetry from any fleet via MQTT, ROS2, OPC-UA, or REST API. Motor temperatures, joint torques, battery cycles, navigation errors, and vibration data are normalised, timestamped, and matched to each robot's asset record and maintenance history automatically.
02Digital Twin Model Synchronisation
Live telemetry feeds into physics-based and ML degradation models that mirror each robot's real-time health state. The twin continuously updates RUL (remaining useful life) estimates for every critical component—servos, harmonic drives, batteries, LiDAR modules—based on actual operating conditions.
03Automated KPI Computation Engine
MTTR, MTBF, OEE, availability, utilisation, and custom KPIs are calculated automatically by combining telemetry uptime data with CMMS work order timestamps. No manual data entry, no spreadsheet formulas—every metric is audit-ready and drill-down enabled from the moment it appears on the dashboard.
04Predictive Alert & Work Order Generation
When a digital twin's degradation model predicts a component will cross failure threshold within a configurable window, Oxmaint auto-generates a prioritised CMMS work order with predicted failure date, recommended repair action, required parts, and optimal maintenance window—before the failure occurs.
05CMMS Drill-Down & Root Cause Tracing
Every KPI anomaly on the dashboard is click-through enabled. Drill from fleet OEE to individual robot to specific component to the work orders, parts consumed, technician notes, and repair photos that explain the deviation—creating a complete causal chain from symptom to root cause.
06Feedback Loop & Model Improvement
Repair outcomes feed back into digital twin models automatically. Actual component lifespans, repair durations, and failure modes refine prediction accuracy over time—improving PM interval recommendations, spare parts forecasts, and fleet replacement planning with every completed work order.
Frequently Asked Questions
Q. What KPIs does a digital twin dashboard track for robotic maintenance?
The core KPIs are MTTR (Mean Time to Repair), MTBF (Mean Time Between Failures), and OEE (Overall Equipment Effectiveness)—which decomposes into availability, performance, and quality. Beyond these, digital twin dashboards track fleet utilisation rate, PM schedule adherence, predictive alert accuracy, spare parts consumption rate, energy consumption per unit, and remaining useful life (RUL) estimates for critical components. All metrics are calculated automatically from combined IoT telemetry and CMMS work order data—no manual spreadsheet compilation required.
Q. How does CMMS drill-down work from a KPI dashboard?
Every KPI displayed on the dashboard is click-through enabled. If fleet MTTR spikes to 4.2 hours from a 2-hour target, clicking that metric reveals which specific robots drove the increase. Clicking an individual robot shows its recent work orders. Clicking a work order shows parts consumed, technician time, repair notes, and photos. This drill-down path—from fleet KPI to root cause—eliminates the manual correlation that traditionally takes days or weeks. Sign up free to see the drill-down workflow in action.
Q. What types of robots can be monitored with digital twin dashboards?
Any robot or autonomous system that generates operational telemetry can be modelled in a digital twin dashboard: quadruped inspection robots (Boston Dynamics Spot, ANYmal), autonomous mobile robots (AMRs), automated guided vehicles (AGVs), collaborative robots (cobots), industrial robot arms (FANUC, ABB, KUKA), warehouse picking systems, delivery robots, and drone fleets. The key requirement is telemetry access—motor data, battery status, navigation metrics, and sensor health—which most modern robotic platforms provide via MQTT, ROS2, or vendor APIs.
Q. How accurate are digital twin failure predictions for robotic equipment?
Well-calibrated digital twin models achieve 80-90% prediction accuracy within a 7-14 day failure window for common robotic failure modes—bearing wear, battery degradation, servo drift, and harmonic drive wear. Accuracy improves over time as repair outcomes feed back into the model. The critical factor is data quality: platforms with tight CMMS integration (where actual failure modes and repair outcomes are documented) train more accurate models than those relying on telemetry alone. Book a demo to see prediction accuracy benchmarks from real deployments.
Q. What is the ROI timeline for a digital twin analytics dashboard?
Most operations see measurable downtime reduction within 60 days of deployment as the first predictive alerts prevent unplanned failures. Full programme ROI—including platform costs, integration, and training—is typically achieved within 8 months. The primary ROI drivers are unplanned downtime reduction (40%+ is typical), PM interval optimisation (eliminating unnecessary PMs while catching missed ones), and spare parts inventory reduction through demand-driven forecasting. Operations spending more than $200,000 annually on robotic maintenance commonly save $80,000-$400,000 per year through twin-driven analytics.