
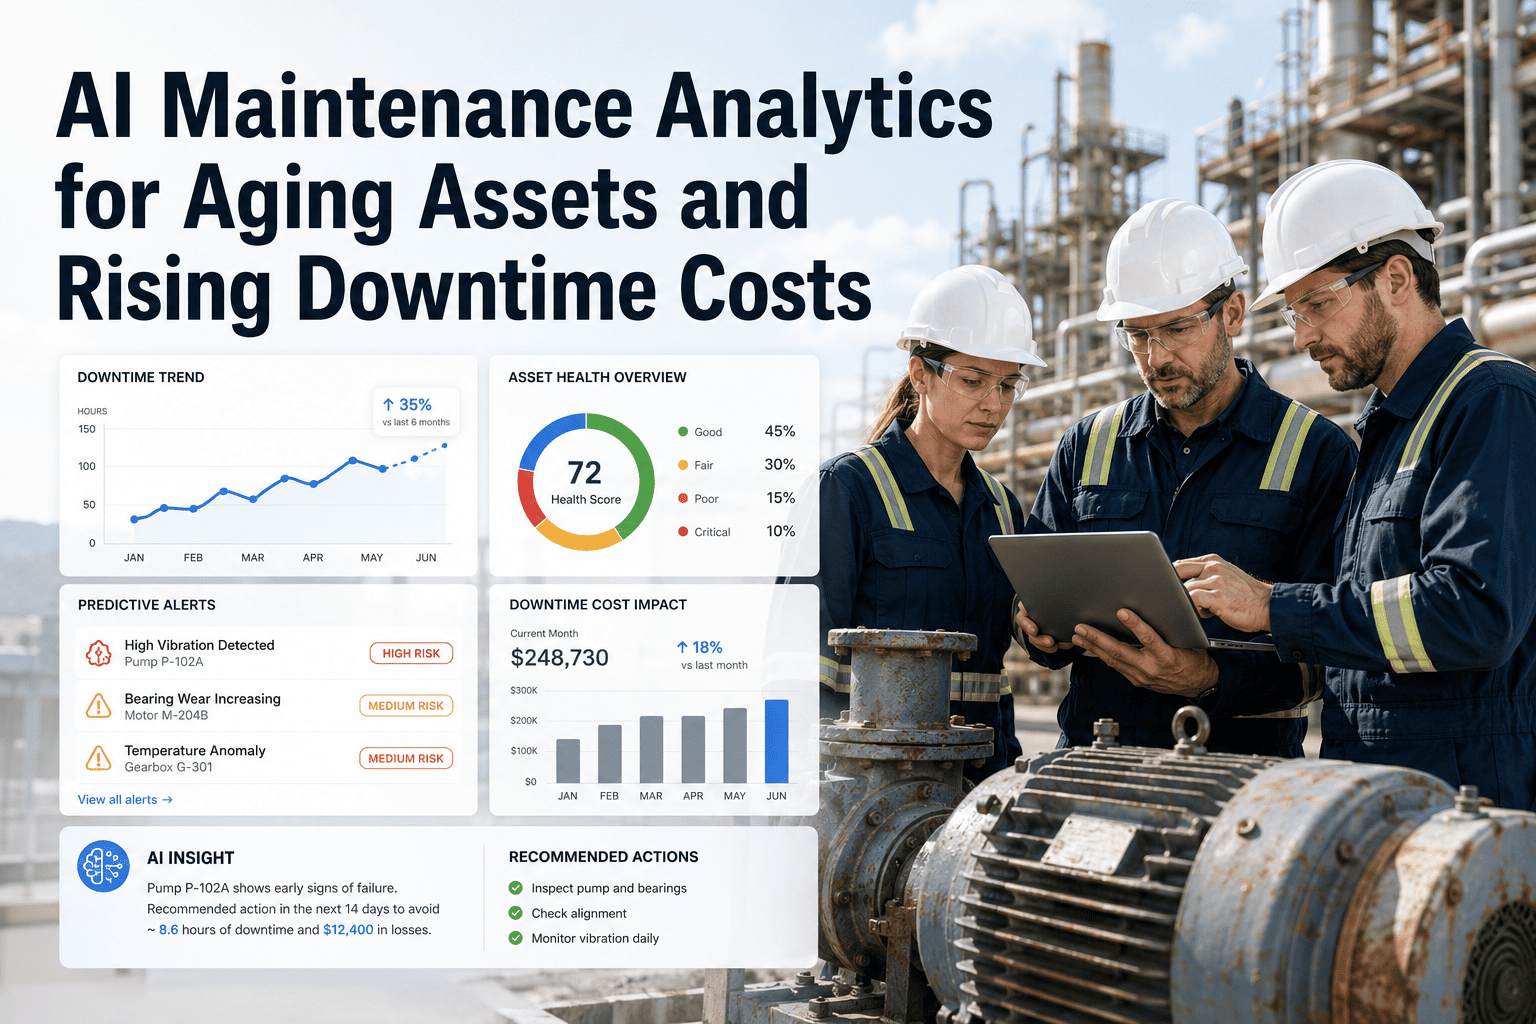
Every maintenance manager knows that downtime costs money. Very few know exactly how much — because most organisations only count the visible damage: lost production hours multiplied by a rough per-hour rate. That calculation misses the hidden costs that Siemens' 2024 True Cost of Downtime research found have driven a 62% increase in downtime costs since 2019, even as incident frequency declined. Hidden costs — idle workforce wages, premium emergency parts, overtime recovery, contractual penalties, scrap and rework, and customer SLA impacts — typically exceed visible costs by two to three times. OxMaint's analytics and reporting module tracks actual downtime duration per asset and calculates true cost automatically from pre-configured hourly rates — so the number your CFO sees is based on data, not estimates.
How to Find the True Cost of Equipment Downtime
The complete downtime cost framework — visible costs, hidden costs, sector benchmarks, and the calculation method that produces a number your operations director and CFO will both take seriously.
The True Cost Framework: Eight Cost Categories
A complete downtime cost calculation requires eight cost categories. Most maintenance teams calculate only the first one — and wonder why their CFO doesn't take the maintenance budget seriously.
Your Downtime Cost Calculator: Build the Number
Use this framework to calculate your plant's true hourly downtime cost. The result is the number you need to justify maintenance budget increases, CMMS investments, and predictive maintenance programmes to financial leadership.
The 62% Cost Increase Paradox: Why Downtime Costs More Even When Failures Decline
| Cost Category | Appears on Maintenance Report | Typical Share of True Total Cost | Tracked in OxMaint | Calculation Input |
|---|---|---|---|---|
| Lost production value | Sometimes | 30–40% | Yes | Hourly rate × downtime duration per asset |
| Idle workforce wages | Rarely | 10–15% | Yes | Affected headcount × fully-loaded rate × hours |
| Emergency parts premium | Yes (as maintenance cost) | 8–12% | Yes | Parts cost variance: emergency vs. planned price |
| Overtime recovery | Rarely linked to downtime | 12–18% | Partially | Recovery hours × overtime premium rate |
| Scrap and rework | Rarely | 5–10% | Partially | In-process material value + restart reject rate |
| Customer SLA penalties | Never | 5–15% | Manual | Contractual penalty per late shipment × events |
| Expedited logistics | Never | 3–8% | Manual | Air freight vs. ground freight cost differential |
The most important conversation I ever had about maintenance investment happened when a CFO looked at a maintenance budget request and said "This is your biggest ask in five years — what are you actually preventing?" The maintenance manager said "downtime." The CFO said "What does your downtime cost?" The room went quiet, because nobody had calculated it past the production-loss line. We spent the next week building a true cost model using the framework I'd developed across 40 industrial site assessments, and the number came back at $28 million annually — three times what anyone in finance had estimated. The maintenance budget request, which had been described as ambitious, was approved the same afternoon. The problem is not that maintenance teams don't care about cost — it is that they systematically understate it because they only count the costs that are easy to measure. When you build the full picture, the ROI case for preventive maintenance investment is almost always overwhelming. You just have to do the calculation.
Frequently Asked Questions
How does OxMaint track downtime cost automatically?
OxMaint records the start and end time of every unplanned stoppage as a work order is created and closed. Each asset has a pre-configured hourly downtime cost rate — set by the maintenance manager during system setup — which reflects the asset's production contribution, dependent workforce, and average hidden cost multiplier. When a work order closes, OxMaint calculates total downtime cost for that event and logs it against the asset record. Monthly and quarterly downtime cost reports show total cost by asset, by area, by failure type, and by cause — giving maintenance managers the financial data to prioritise PM investment and justify budget requests. Start your free trial to configure downtime cost rates for your critical assets.
What is a reasonable hidden cost multiplier to use in a downtime calculation?
Industry research suggests a 2.0–3.0× multiplier applied to the combined visible cost (lost production + idle workforce) to approximate true total downtime cost. For facilities with significant JIT commitments, high scrap rates on failure, or premium emergency parts dependency, use the higher end of the range (2.5–3.0×). For facilities with flexible recovery capacity, minimal contractual penalties, and low emergency parts premium, use 2.0–2.2×. The multiplier should be calibrated annually by auditing actual hidden costs from a sample of major downtime events against the visible cost figure. Book a demo to see how OxMaint's downtime reporting supports this calibration process.
How do you use downtime cost data to justify a preventive maintenance investment?
The ROI argument requires three inputs: your current annual downtime cost (calculated using the framework above), the expected reduction from PM (typically 40–60% reduction in unplanned downtime within 18 months of structured PM implementation), and the cost of the PM programme. For a plant with $5M in annual downtime cost, a 50% reduction saves $2.5M per year. If the PM programme — including CMMS software, additional labour, and parts — costs $800K per year, the net annual benefit is $1.7M, with payback in under six months. OxMaint tracks both the downtime cost reduction and the PM spend, generating the before/after comparison automatically. Start your free trial to begin building your downtime cost baseline.
Which equipment failures typically generate the highest downtime costs?
Failures on bottleneck assets — the single piece of equipment that constrains the entire production flow — generate the highest downtime cost, because every downstream process stops simultaneously. In addition to bottleneck assets, failures with long mean time to repair (due to parts lead time or specialist labour dependency) accumulate cost faster than short, easily-repaired failures. OxMaint's asset criticality ranking combines bottleneck status, MTTR, and failure frequency to identify the highest-cost-at-risk assets in your plant — focusing PM investment where it prevents the most expensive failures. Book a demo to see the asset criticality ranking and downtime cost attribution in action.
Stop Estimating Your Downtime Cost. Start Calculating It.
OxMaint tracks actual downtime duration per asset, calculates true cost against pre-configured hourly rates, and reports cost by asset, failure type, and cause — giving your maintenance team the financial data to prioritise PM investment and win every budget conversation.



.png)