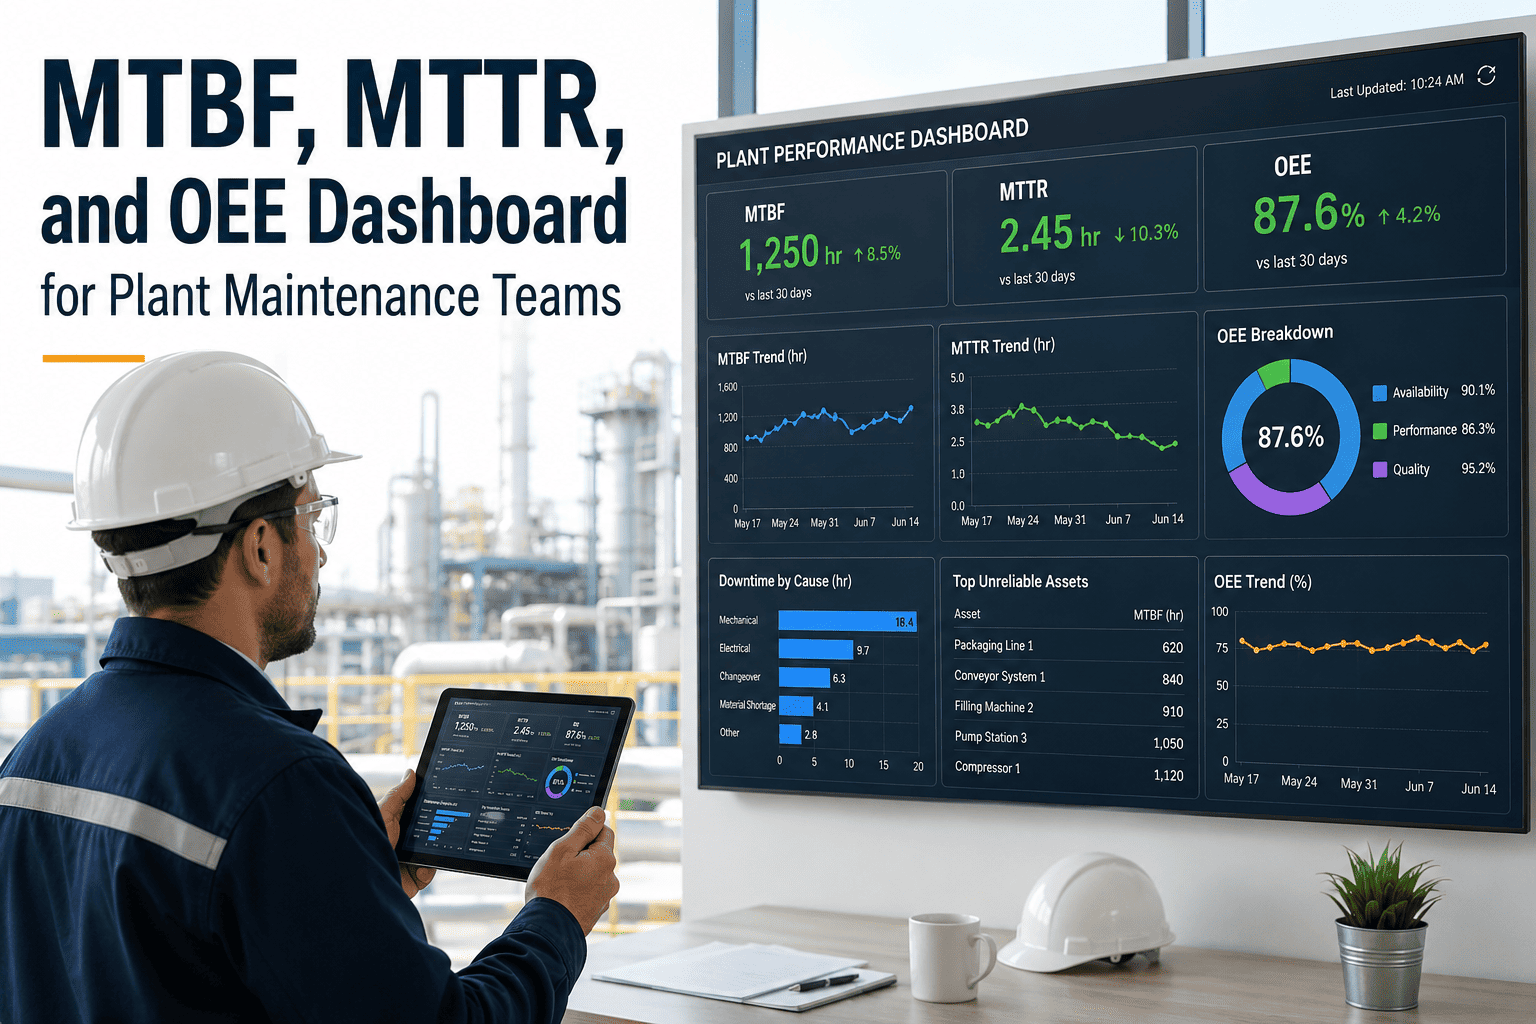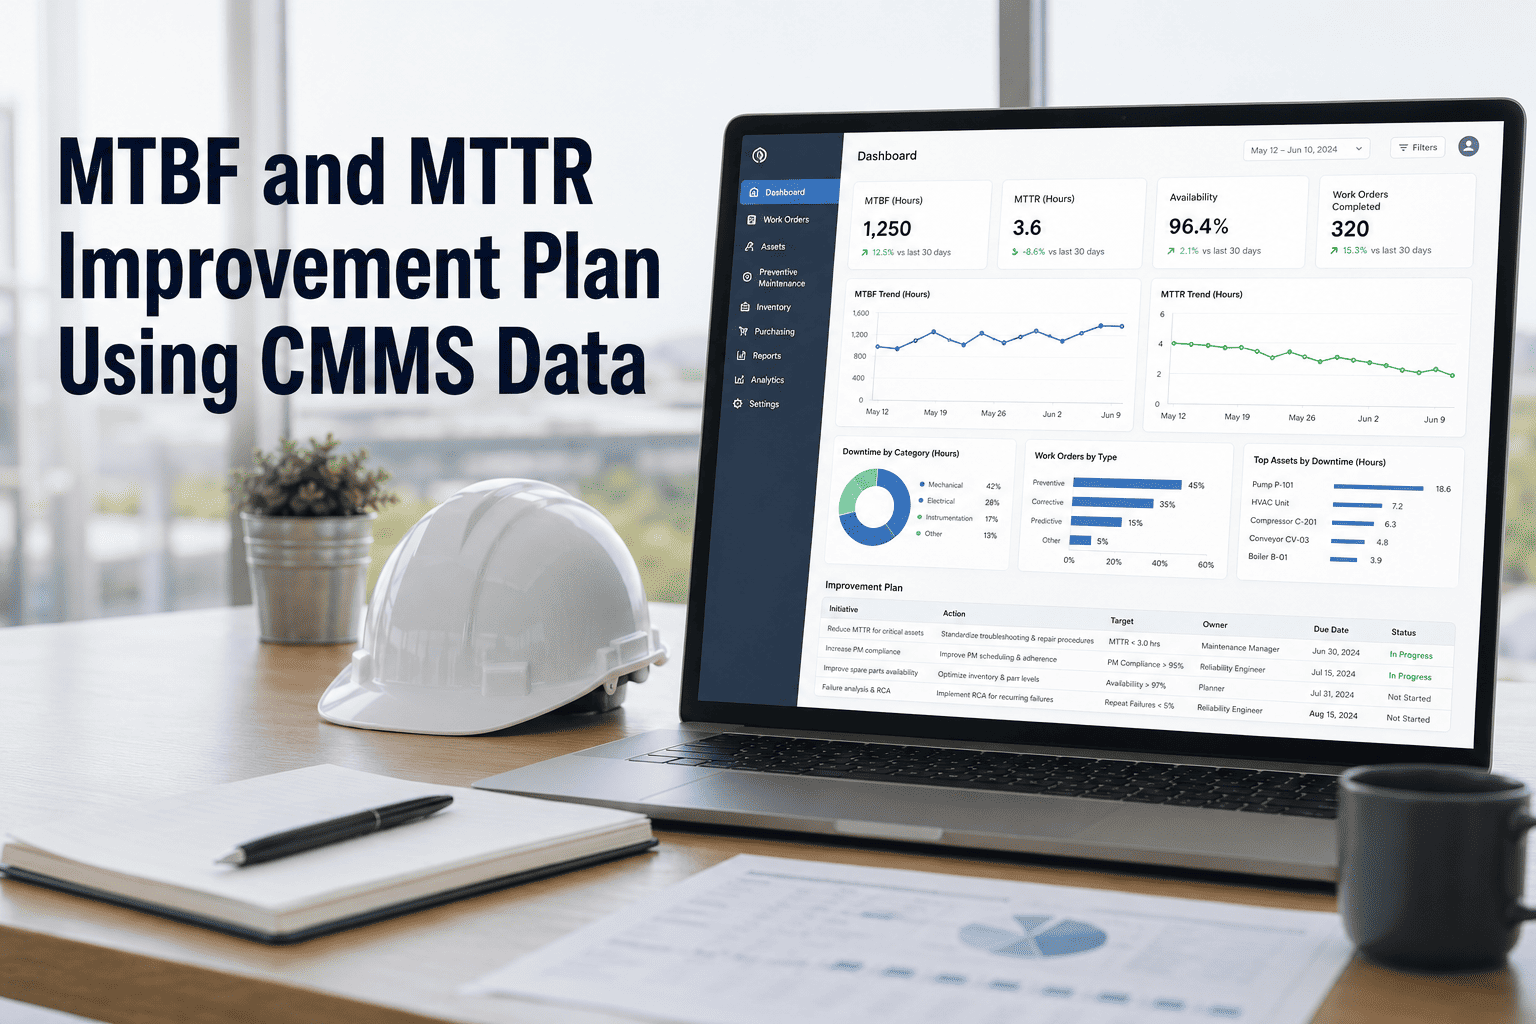
MTBF and MTTR are the two numbers that reveal whether your maintenance program is actually working. Mean Time Between Failures tells you how reliably your assets run. Mean Time To Repair tells you how efficiently your team responds when they don't. Most CMMS platforms collect the data needed to improve both — but very few maintenance teams know how to read it. OxMaint's analytics and reporting module surfaces MTBF and MTTR trends by asset, by technician, and by failure mode — so you can target improvements where they return the most uptime.
MTBF and MTTR Improvement Plan Using CMMS Data
Your CMMS already holds the failure patterns, repair delays, and PM gaps that are costing you uptime. Learn how to use that data to systematically improve MTBF and MTTR across every critical asset.
MTBF vs MTTR: What Each Metric Is Actually Telling You
Both metrics come from the same work order history in your CMMS — but they diagnose completely different problems. MTBF is a signal about asset health and PM effectiveness. MTTR is a signal about your maintenance system's responsiveness and resource readiness.
MTBF measures how long an asset runs between unplanned stops. A rising MTBF means your PM program is preventing failures. A falling MTBF means something is degrading — and your current maintenance approach is not catching it in time. MTBF is calculated from closed breakdown work orders in your CMMS over a defined period.
MTTR measures how quickly your team restores an asset after it fails. A high MTTR is rarely a technician skill problem — it is almost always a parts availability, diagnostic information, or dispatch speed problem. MTTR is calculated from the time between work order creation and work order completion in your CMMS.
The 6 CMMS Data Points That Drive MTBF Degradation
Low MTBF is a symptom. The cause lives in your CMMS data — in PM completion rates, failure mode recurrence, and lubrication compliance gaps. These six data points are where OxMaint's analytics module starts its MTBF diagnosis.
Every missed PM is a failure that was not prevented. CMMS data shows which assets have the lowest PM completion rates — and those assets consistently show the shortest MTBF intervals. Target 90%+ compliance on your critical asset tier first.
When the same failure code appears more than twice in 90 days on a single asset, your repair is addressing the symptom but not the cause. CMMS failure mode tracking identifies these chronic failures automatically if failure codes are used consistently.
Overdue lubrication and calibration work orders are among the strongest predictors of bearing and seal failure. OxMaint flags lubrication WOs that have been open more than 120% of their scheduled interval as a specific MTBF risk indicator.
Non-OEM part substitutions made under breakdown conditions are tagged in CMMS work orders. Assets with a high rate of part substitution in their repair history show statistically shorter subsequent MTBF intervals — a pattern most teams never see without analytics.
Many CMMS systems capture operator-initiated work requests. When these requests go unacknowledged for more than 48 hours and the asset subsequently fails, the pattern creates a detectable gap between request creation and failure work order creation.
A press running at 110% of design throughput degrades faster than one running at 70%. CMMS PMs scheduled at fixed calendar intervals do not account for utilization variance. Runtime-based PM triggers reduce this gap for high-utilization assets.
Where Repair Time Actually Goes — The MTTR Time Map
Most maintenance teams assume MTTR is dominated by actual repair work. CMMS data consistently shows the opposite. Across industries, active repair time represents less than half of total MTTR. The rest is delay — and delay is fixable.
| MTTR Component | Industry Average | Primary CMMS Lever | Potential Reduction |
|---|---|---|---|
| Fault Detection to Work Order | 38 min | IoT alert auto-generation, operator mobile reporting | Up to 80% |
| Work Order to Technician Dispatch | 54 min | Priority-based auto-assignment, shift scheduling integration | Up to 65% |
| Technician to Parts Retrieval | 47 min | Parts availability pre-linked to assets, storeroom CMMS integration | Up to 70% |
| Active Repair Time | 112 min | Digital SOPs, repair procedure libraries attached to work orders | Up to 25% |
| Testing and Handback | 28 min | Structured completion checklists in mobile CMMS | Up to 35% |
| Documentation and Closure | 19 min | Auto-populated work order fields, failure code dropdowns | Up to 85% |
The 5-Phase MTBF and MTTR Improvement Plan
Sustainable MTBF and MTTR improvement requires a structured sequence. Random interventions on individual assets produce temporary gains. This five-phase plan, executed in OxMaint, creates compounding reliability improvement across your entire fleet.
Pull the last 12 months of closed work orders from OxMaint. Calculate MTBF and MTTR for each asset using breakdown WOs only — exclude planned PMs. Sort by MTBF ascending and MTTR descending to identify your worst-performing assets. This baseline becomes your improvement benchmark and should be reviewed monthly.
For every asset with MTBF below target, extract all breakdown work orders from the past 18 months and group by failure code. Any failure code appearing more than twice is a chronic failure. For each chronic failure, trace the CMMS work order history to identify whether a preceding PM, operator request, or sensor alert existed but was not acted upon.
For assets with chronic failures, review the PM task list in OxMaint. Add failure-mode-specific inspection tasks for each chronic failure. Shift high-utilization assets from calendar-based to runtime-based PM triggers. Set minimum PM completion thresholds (90% for critical assets) and configure automated alerts when assets fall behind schedule.
For assets with MTTR above target, use OxMaint's storeroom integration to verify that critical spare parts are on-hand and linked to the asset record. Attach digital repair procedures and wiring diagrams to the asset in OxMaint so technicians have them at the point of repair without a trip to the office. This single step reduces MTTR by 25–40% on complex assets.
Set up MTBF and MTTR trend dashboards in OxMaint for your top 20 critical assets. Review monthly with your maintenance team and production supervisor. Any asset showing declining MTBF for two consecutive months triggers a root cause review — not a reactive response. This cadence is what separates teams that sustain reliability gains from those that achieve temporary improvements and regress.
Start Tracking MTBF and MTTR in OxMaint Today
OxMaint automatically calculates MTBF and MTTR from your closed work orders and surfaces trend dashboards by asset, by failure mode, and by technician — no manual spreadsheet analysis required.
MTBF and MTTR Targets by Industry and Asset Class
Use these industry benchmarks to evaluate whether your current MTBF and MTTR performance represents a reliability gap or a competitive advantage. Benchmarks sourced from reliability engineering industry surveys and CMMS dataset aggregations.
| Asset Class | Industry Avg MTBF | Top-Quartile MTBF | Industry Avg MTTR | Top-Quartile MTTR |
|---|---|---|---|---|
| Centrifugal Pumps | 1,100 hrs | 2,400 hrs | 3.8 hrs | 1.6 hrs |
| Electric Motors (>75kW) | 2,800 hrs | 5,500 hrs | 5.2 hrs | 2.1 hrs |
| Conveyor Systems | 920 hrs | 1,800 hrs | 2.4 hrs | 0.9 hrs |
| Air Compressors | 1,650 hrs | 3,200 hrs | 4.1 hrs | 1.8 hrs |
| CNC Machining Centers | 780 hrs | 1,500 hrs | 6.4 hrs | 2.8 hrs |
| Industrial Chillers | 2,100 hrs | 4,800 hrs | 7.2 hrs | 3.0 hrs |
Reliability Engineers on CMMS-Driven MTBF and MTTR Improvement
"We had been tracking MTBF on a spreadsheet for years and never saw meaningful improvement. The problem was we were calculating it once a quarter — by the time we acted on the trend, three more failures had already happened. OxMaint's automatic MTBF calculation on closed WOs let us move to weekly reviews. We improved average MTBF on our pump fleet by 44% in eight months without any major capital spend."
"MTTR was our bigger problem. We were losing 90 minutes per repair just waiting for parts and finding the right drawing. After we loaded our critical spare parts into OxMaint and attached repair procedures to each asset record, our average MTTR on electrical faults dropped from 6.8 hours to 3.1 hours in the first quarter. The data was always there — we just needed the right system to surface it."
Frequently Asked Questions
Your CMMS Holds the MTBF and MTTR Improvement Plan. OxMaint Reads It for You.
Stop calculating reliability metrics on spreadsheets. OxMaint automatically tracks MTBF, MTTR, PM compliance, and failure recurrence — and tells you exactly where to act first.