Manufacturers chase OEE numbers every shift — yet 73% of plants admit they cannot break a single OEE percentage point down to the asset, the loss type, or the responsible failure mode. Average global OEE sits between 40% and 60%, while world-class plants hold above 85% — and the difference is almost never about working harder. It is about visibility. When availability drops 4 points one Tuesday, can your team show whether it was a press changeover, a sealer micro-stop, or a packaging line breakdown? Without a CMMS-fed OEE structure, the answer is a shrug. Most plants lose 20-40% of maintenance budget chasing losses they have never accurately measured — start a free trial to see how Oxmaint maps every minute of downtime to an asset and a cause, or book a demo to walk through your current OEE bottleneck on a live dashboard.
Manufacturing · OEE & Asset Performance · 2026
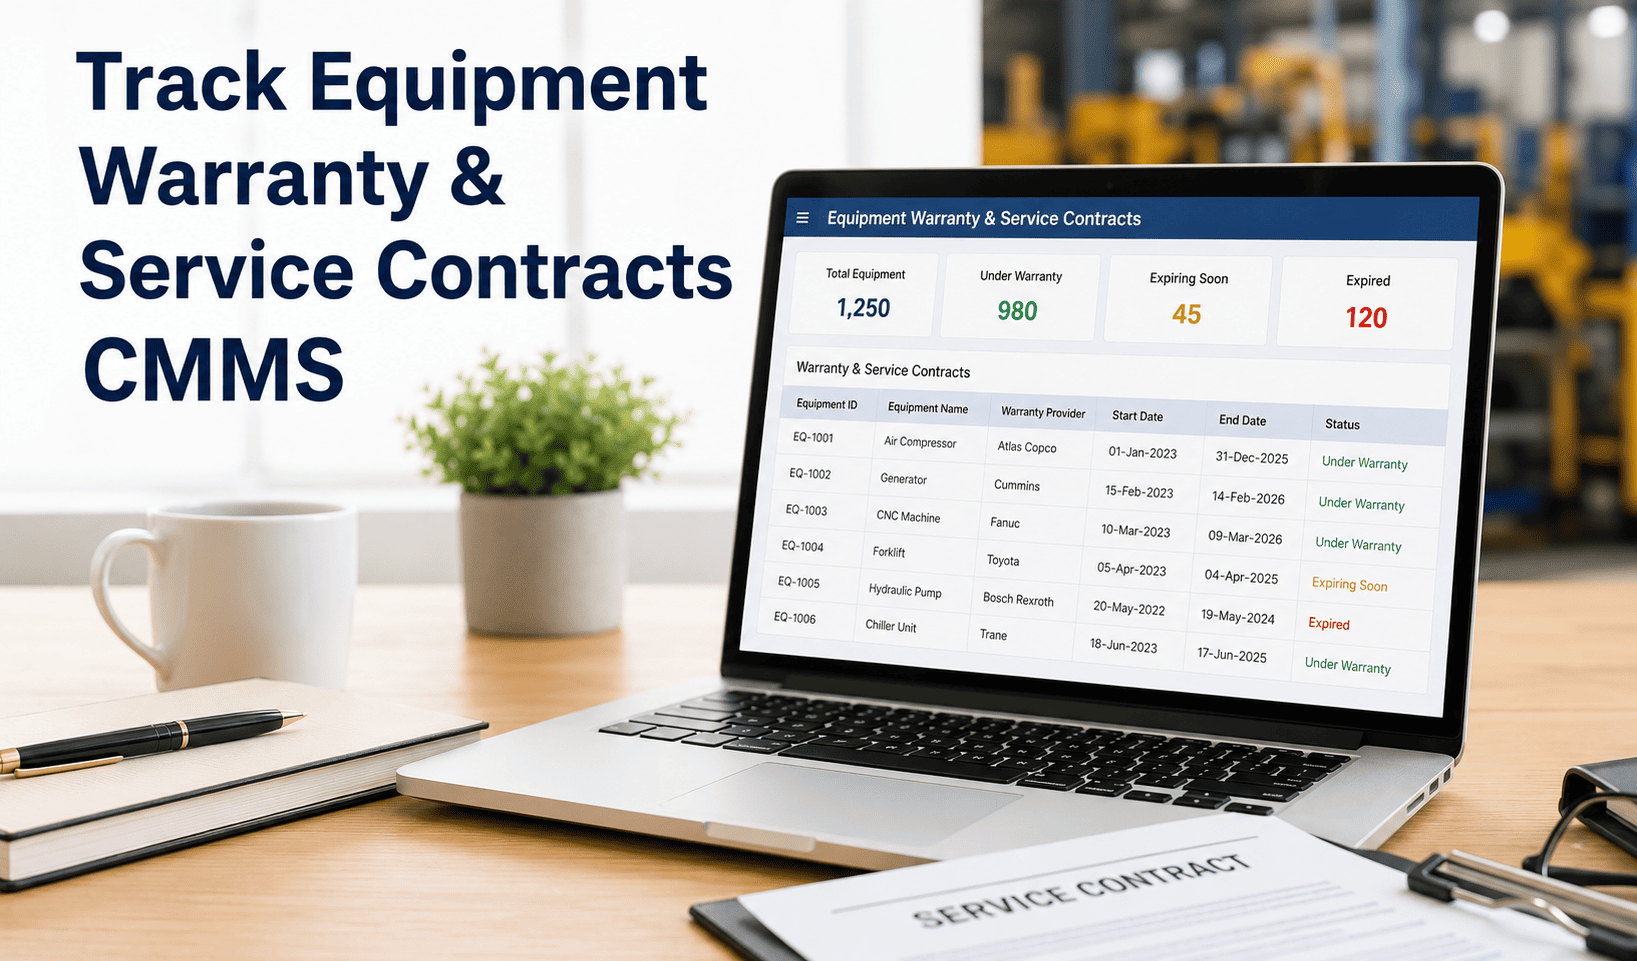
How CMMS Helps Manufacturers Break Down OEE Losses by Asset
Turn availability, performance, and quality losses into asset-level actions your team can fix this week — not next quarter.
Real-time asset visibility
Loss-type Pareto by line
Predictive failure alerts
See exactly where your OEE percentage points are leaking — by asset, by shift, by loss code.
weighted average machine runtime across 3,000+ tracked machines and 74M+ machine-minutes
34.2%
of OEE efficiency loss in discrete manufacturing comes from unplanned downtime alone
8.43%
of all unplanned downtime is linked to reactive (run-to-failure) maintenance practice
30-50%
of micro-stops are missed by manual logs versus automated CMMS capture
What is OEE loss breakdown by asset
OEE loss breakdown is the practice of taking a single OEE score and decomposing it across the three loss families — availability, performance, quality — and then attributing each loss minute to a specific asset, line, or component. A plant-wide OEE of 62% tells you nothing actionable. The same number broken into "Line 3 stretch wrapper lost 41 minutes to belt slippage, Line 5 capper lost 22 minutes to changeover overrun, Filler 2 produced 1.8% scrap during stable run" tells your maintenance manager exactly where Monday's work order priority lives.
A CMMS-driven OEE structure stamps every stop, slow cycle, and quality reject with an asset ID, a reason code, and a timestamp. Suddenly, OEE is not a board-meeting slide — it is a Pareto chart that points your team to the asset where one fix recovers 3 OEE points. Most plants discover that 60% of their losses concentrate in 15% of their equipment — try Oxmaint free for 30 days to see which 15% of your assets are quietly eating your shift.
The Six Big Losses, mapped to asset-level action
A1
Availability
Equipment Failure
Unplanned stops from breakdowns. Logged against the failed component with a failure mode code (bearing, motor, sensor, drive).
A2
Availability
Setup & Adjustment
Changeover overruns and tooling adjustments. CMMS times each event versus the target — exposing SMED gaps by line.
P1
Performance
Idling & Minor Stops
Micro-stops under 5 minutes — invisible to manual logs. Automated capture surfaces 30-50% more events.
P2
Performance
Reduced Speed
Machine running below nameplate. A press at 85% of rated speed silently bleeds 15% of daily output every shift.
Q1
Quality
Startup Rejects
Scrap produced before stable run is achieved. Standardized startup procedures cut these losses 50-80%.
Q2
Quality
Process Defects
Defects during stable production from drift or tool wear. Tracked by asset and shift to spot the drift before scrap spikes.
Most plants lose 20-40% of maintenance budget chasing losses they have never broken down to the asset.
Why traditional OEE tracking fails on the shop floor
Spreadsheet OEE Is a Postmortem
End-of-shift Excel files tell you what happened yesterday. By then, the line has already lost the production and the cause is forgotten.
No Loss Attribution by Asset
Plant OEE drops 3 points and nobody knows whether it was the filler, the capper, or the labeller. The data exists nowhere except in supervisor memory.
Micro-Stops Stay Invisible
Stops under 5 minutes rarely get logged manually — yet across a 12-hour shift they routinely add up to 60-90 minutes of lost run time per line.
Reactive Maintenance Loops
Reactive maintenance accounts for the highest unplanned downtime share of any strategy — and without asset-level history, plants stay locked in the loop.
When OEE numbers float without asset attribution, plant managers default to broad initiatives that touch every line — and recover nothing measurable. The teams that escape this loop shift their tracking to asset-level CMMS data within 90 days and start recovering 3-7 OEE points per quarter. Book a demo and we will show you the exact dashboard view that turns OEE from a number into an action queue.
How Oxmaint breaks down OEE losses by asset
Asset-tagged downtime capture
Every stop is logged against a specific asset in the registry — with reason code, duration, and the operator or technician who closed the event.
PLC and sensor integration
Connects to PLCs, sensors, and production counters so micro-stops and slow cycles are captured down to one-second resolution — zero manual entry needed.
Loss Pareto by line and shift
Auto-generated Pareto charts rank losses by minutes, by asset, by shift — surfacing the 15% of equipment that contains 60% of plant losses.
Work order from loss event
Repeated failures on the same asset auto-suggest a preventive work order — closing the loop from data to scheduled corrective action.
Quality loss tracking
Scrap and rework recorded against the producing asset with shift context — exposing drift patterns long before they trigger customer complaints.
OEE dashboards by hierarchy
Roll OEE up from Asset to Line to Plant to Portfolio — or drill down from a plant number to the single sensor that triggered yesterday's drop.
A press at 85% of rated speed silently loses 15% of potential daily output — every shift, every week, every quarter.
Spreadsheet OEE vs CMMS-driven OEE breakdown
Capability
Spreadsheet OEE Tracking
Oxmaint CMMS OEE Breakdown
Downtime data source
Manual end-of-shift entries
Live PLC, sensor, and operator capture
Micro-stop visibility
30-50% missed
Captured to 1-second resolution
Loss attribution
Plant or line level only
Asset, component, and failure mode
Reason coding
Free-text, inconsistent
Standardized reason codes per asset
Trending
Static weekly summary
Live Pareto by shift, line, asset
Action trigger
None — data sits in a file
Auto-suggested PM work order on repeats
Quality loss link
Tracked separately by QA
Scrap tied to producing asset and shift
Decision latency
24-48 hours behind reality
Live — visible the moment the loss occurs
ROI of asset-level OEE breakdown
3-7
OEE points recovered per quarter when losses are tracked at the asset level instead of the plant level
50-80%
reduction in startup quality losses through standardized procedures tied to asset-level checklists
60%
of plant downtime typically concentrates in 15% of assets — once you can see the breakdown
85%+
world-class OEE threshold reached by plants that combine asset-level loss tracking with disciplined PM execution
Plants that move to CMMS-driven OEE breakdown rarely return to spreadsheets. The reason is not the dashboard — it is the conversation in the daily review. Instead of "OEE was 61 yesterday," the supervisor leads with "we lost 47 minutes on Line 3 — micro-stops on the case sealer, here is the suggested PM." That shift, repeated every shift, is what moves a plant from 60% OEE to 75% in 12 months. Start a free trial and see your loss Pareto on day one.
Frequently Asked Questions
How does a CMMS calculate OEE differently from a spreadsheet
A CMMS calculates Availability, Performance, and Quality from live data sources — operator entries, PLC tags, sensor readings, and scrap entries — and stamps every loss minute against a specific asset. Spreadsheets aggregate the same numbers manually at end of shift, which compresses 8-12 hours of granular loss data into a single average and hides which asset caused which percentage point of loss.
Can Oxmaint capture micro-stops automatically
Yes. Oxmaint integrates with PLCs, production counters, and IoT sensors to record every machine state change with timestamp and duration. Micro-stops as short as a few seconds are captured automatically, which is critical because manual logs typically miss 30-50% of these events — and micro-stops often add up to more lost output than full breakdowns.
How quickly can a plant see asset-level OEE breakdown after implementation
Most plants see asset-level downtime Pareto charts within the first 14 days, once the asset registry is populated and reason codes are standardized. Performance and Quality components follow over 30-60 days as PLC tags and scrap entries normalize across shifts. By 90 days, plants typically have a full asset-level OEE structure feeding daily reviews.
Does Oxmaint integrate with existing MES or SCADA systems
Yes. Oxmaint connects to existing MES, SCADA, and historian systems through standard integrations and APIs, so OEE breakdowns pull from the same production data your operations team already trusts. No rip-and-replace is required — Oxmaint sits alongside your existing stack and adds the maintenance attribution layer.
Decision Point
Stop tracking OEE you cannot act on
Turn every percentage point into an asset, a loss code, and a work order. Used by operations teams managing 10,000+ assets across multi-site portfolios. Live in days, not months.
.png)