Work order cycle time — the elapsed time from work order creation to verified close-out — is the single most revealing KPI in maintenance management. Teams that measure and actively reduce work order cycle time spend 25–35% less on maintenance labor per asset and consistently hit PM compliance rates above 85%. Teams that don't measure it discover the problem only when production leadership asks why an asset that was "being worked on" took three weeks to come back online.
See your real work order cycle time data — and the bottlenecks driving it — on your own assets, in 30 minutes.
- Live cycle time tracking — every work order, every stage, every technician
- AI bottleneck detection — know where jobs stall before they stall again
- Smart scheduling — right tech, right parts, right time, every time
Trusted by 1,000+ teams who cut work order cycle time by up to 78% · Live in days, not months
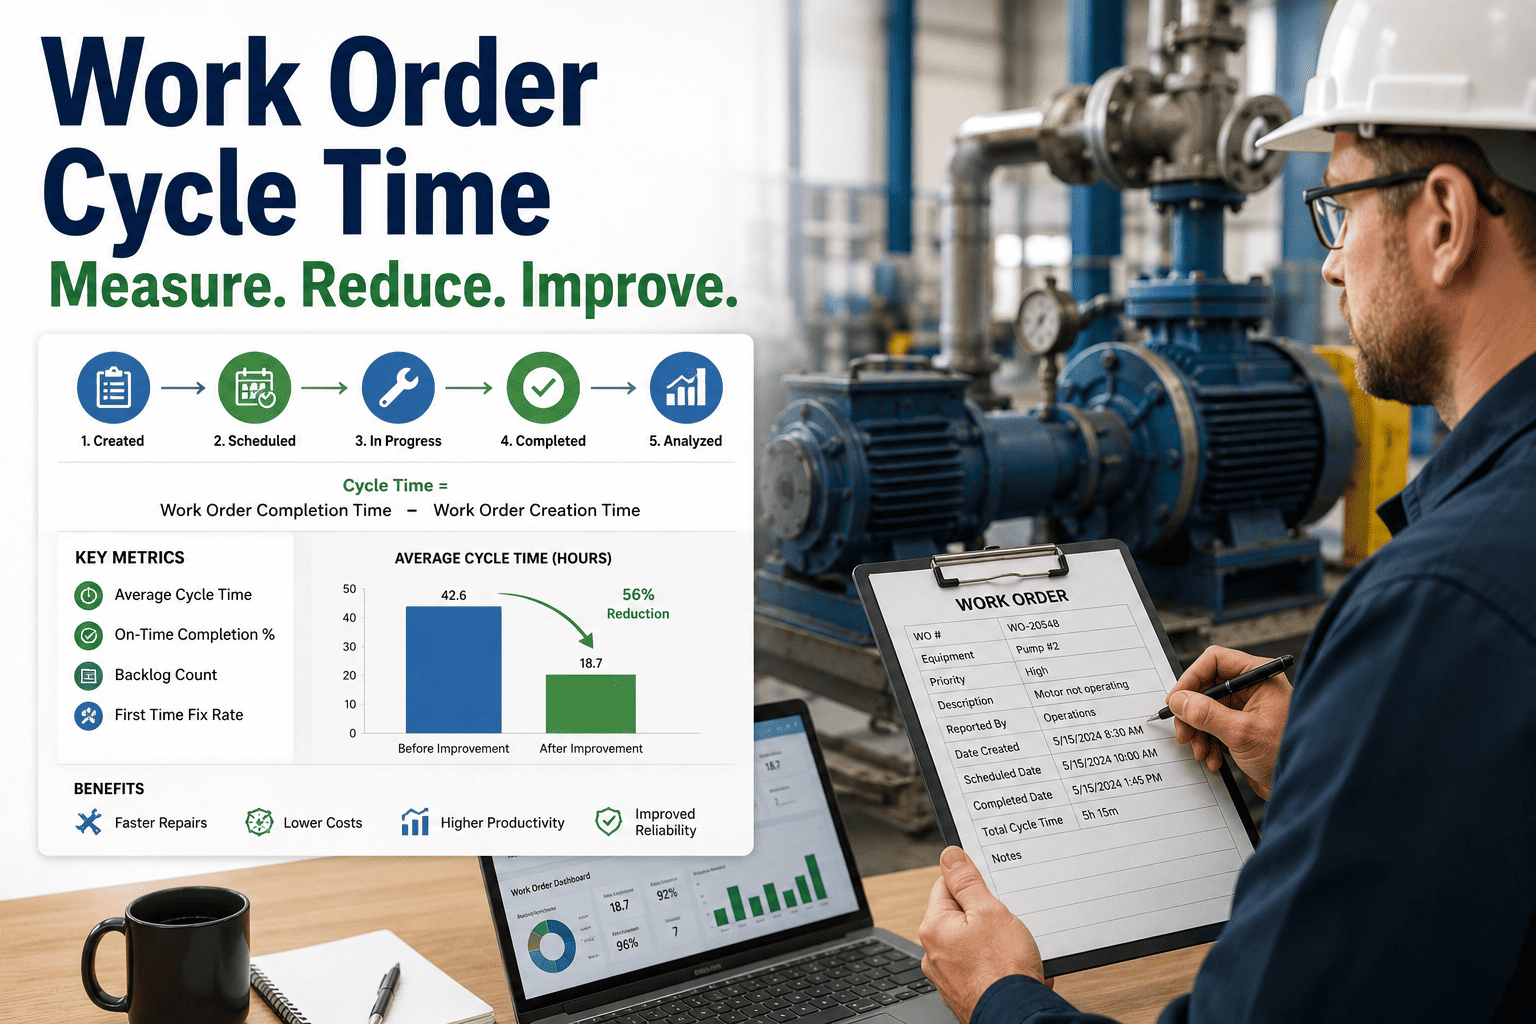
Work order cycle time: how to measure it and why it matters
Work order cycle time is the total elapsed time from the moment a work order is created — whether triggered by an inspection, a request, a sensor alert, or a PM schedule — to the moment it is verified closed with all required data captured. It is not simply "time a technician spent working." It includes every minute the work order exists: waiting in queue, waiting for parts, waiting for access, actual execution, and the close-out lag before a supervisor signs it off.
The distinction matters because most of the time in a long cycle time is not execution time — it is wait time. Industry data consistently shows that active wrench time accounts for only 25–35% of total work order cycle time in organizations without structured maintenance workflows. The rest is queue wait, parts retrieval, access coordination, and administrative lag. A CMMS that tracks cycle time by stage — not just total elapsed time — reveals exactly where the hours are being lost. See how Oxmaint tracks work order cycle time by stage, technician, asset type, and site.
Reducing work order cycle time has a direct financial payoff. Shorter cycle times mean faster return to production, lower emergency labor premiums, better PM compliance (because work orders close before the next one is due), and higher technician throughput per shift. Analytics and reporting that surfaces cycle time trends is what converts this KPI from a number into a management action.
8 components that make up total work order cycle time
Time between a fault or request being identified and a work order being formally opened. In paper-based or email-based systems, this can be hours or days. In QR-scan digital systems, it's under 60 seconds.
Time the WO spends in an unassigned or assigned-but-not-started state. Long queue wait times indicate either under-resourcing or poor prioritization. Should be visible in real time, not discovered at month-end review.
Time the WO is on hold waiting for parts to arrive, be located, or be requisitioned. This is the single most common bottleneck — accounting for 35–40% of total cycle time in facilities without integrated parts and inventory management.
Time waiting for production clearance, LOTO permits, confined space entry approval, or access to a secured area. Coordination failures here can add days to a work order that should take hours. Pre-staged permits for recurring tasks eliminate this.
Actual hands-on task duration. This should be the largest component of cycle time — if it isn't, you have a systemic wait-time problem, not an execution problem. Track estimated vs actual to identify chronic underestimation on specific task types.
Time for functional testing, commissioning checks, or quality verification after the repair is complete. Often skipped on short-cycle jobs, which is why repeat failures on the same asset are more common than they should be.
Time between the task being physically complete and the work order being formally closed in the CMMS with all required fields captured. This lag is invisible waste. Mobile close-out at the asset eliminates it. Paper-based systems routinely accumulate 1–3 day close-out lag per job.
In multi-level approval workflows, waiting for supervisor or manager sign-off before a WO is marked complete adds administrative cycle time. Configuring auto-approval for routine low-risk tasks removes this bottleneck without reducing oversight on critical jobs.
6 root causes of high work order cycle time
When parts are not confirmed in stock before a work order is dispatched, the technician discovers the shortage on-site. The job goes on hold. Parts are ordered. The WO sits in "waiting" status for days. Integrating live inventory checks at WO creation eliminates this entirely.
When every work order is defaulted to "normal" priority, technicians work in creation order rather than impact order. A critical production-line failure waits in queue behind three non-urgent lighting replacements. AI-driven priority scoring solves this without adding a dispatcher role.
Skills mismatch in assignment adds cycle time in two ways: the technician takes longer to complete a task outside their specialty, or the work order has to be reassigned entirely. AI routing to the nearest certified tech removes this from the equation.
Paper work packs require manual transcription, supervisor sign-off in person, and administrative filing. In high-volume maintenance environments, 1–3 days of close-out lag per work order is common. Across 300 WOs per month, that's 900 days of artificial cycle time added to your KPIs every month.
If you don't measure work order cycle time by technician, asset type, and stage, you can't identify where the bottleneck is and you can't hold anyone accountable for improvement. The act of measurement itself changes behavior — teams that see their cycle time tracked publicly consistently outperform teams that don't.
Emergency work orders bypass the queue and consume disproportionate resources — premium labor, expedited parts, and management attention. Every emergency event that a functioning predictive maintenance program would have caught is an unforced cycle time spike, plus a production loss event, plus an emergency parts cost premium.
The fastest way to discover your specific cycle time bottleneck is to map your actual work order data — start a free trial to see Oxmaint's cycle time analytics on your own WO history, or book a demo and we'll walk through your current workflow.
4 Oxmaint capabilities that directly reduce work order cycle time
Scan the QR tag on any asset to open a pre-populated work order in 30 seconds. All required fields, asset history, parts list, and safety procedures auto-load. When the task is complete, the mobile close-out flow captures labor hours, parts consumed, and failure codes on-site before the technician walks away. Close-out lag goes from 1–3 days to under 5 minutes. Work order management details.
When a part is added to a work order, Oxmaint checks live stock levels and flags shortages before dispatch. If a part is available at another site, it shows the transfer option. If ordering is required, a purchase request is triggered with one tap. The technician arrives on-site with parts already staged. Parts and inventory module.
Every incoming work order is automatically scored by AI against asset criticality, failure risk, production impact, and technician proximity. High-priority jobs don't wait in a flat queue — they go to the top and to the nearest qualified tech. The result is a faster response time on the jobs that matter most, and fewer emergency escalations from jobs that sat too long. AI and automation capabilities.
Oxmaint tracks cycle time by stage — creation to assignment, assignment to start, start to complete, complete to close — for every work order, every technician, and every asset type. When a specific task type consistently shows a parts-wait spike, or a specific technician consistently shows long queue wait, the dashboard surfaces it. Manage what you measure. Analytics and reporting module.
Reactive work order management vs cycle-time-optimized CMMS
| Cycle time factor | Reactive / unmanaged | Oxmaint CMMS managed |
|---|---|---|
| WO creation time | Minutes to hours after fault identified | Under 60 seconds via QR scan |
| Queue priority | Flat queue, creation order | AI-scored by criticality and impact |
| Parts readiness | Discovered on-site — hold placed | Confirmed at creation — staged before dispatch |
| Technician routing | Manual dispatch to available tech | AI routes to nearest certified tech |
| Close-out process | 1–3 days paper sign-off lag | Mobile close-out on-site, under 5 minutes |
| Average cycle time | 7–14 days (corrective) | 1–3 days (same corrective type) |
| Bottleneck visibility | Monthly report, always stale | Live by stage, by tech, by asset type |
| PM compliance | 52% average (WOs close late, next PM queued) | 88% achieved within 90 days |
What cycle time reduction delivers — in real numbers
These are real deployment results from teams that replaced paper work packs and spreadsheet queues with Oxmaint's digital work order system — calculate your own cycle time ROI, or book a demo to see where your current process is losing time.
Common questions about measuring and reducing work order cycle time
How do you calculate work order cycle time accurately in a CMMS?
What is a good work order cycle time benchmark?
What's the fastest single change that reduces work order cycle time?
How does work order cycle time affect PM compliance rate?
Cut Your Work Order Cycle Time by 78% — Starting With Your Next Job
Work order cycle time is not a reporting metric — it is a management lever. Oxmaint tracks every stage, surfaces every bottleneck, and gives you the tools to eliminate the wait time that makes up 65–75% of total cycle time in most maintenance operations. The teams that measure it and act on it consistently hit PM compliance above 85% and cut reactive maintenance spend by more than half.
- Live cycle time by stage, by technician, by asset — not just a total elapsed number
- Parts integration eliminates the #1 bottleneck before dispatch
- Mobile close-out replaces 1–3 day paper sign-off lag with 5 minutes on-site
Trusted by 1,000+ maintenance teams who went from 9.4-day average cycle time to 2.1 days · Live in days, not months