An AOG event isn't a single failure — it's a chain of un-scored risks (life-limit collisions, aging deferred defects, stock-out probabilities) that converged on the same dispatch window. This guide walks maintenance leaders through a CMMS-based risk scoring model that flags those collisions 72–120 hours before they ground an aircraft, turning reactive AOG response into planned, overnight intervention. Airlines that operationalize this model typically cut unscheduled ground time by 25–40% and recover six-figure annual savings per tail. You can Start Free Trial to deploy the dashboard described below, or read on for the full methodology.
Can your CMMS predict the next AOG — or does it only log it after the aircraft is already parked?
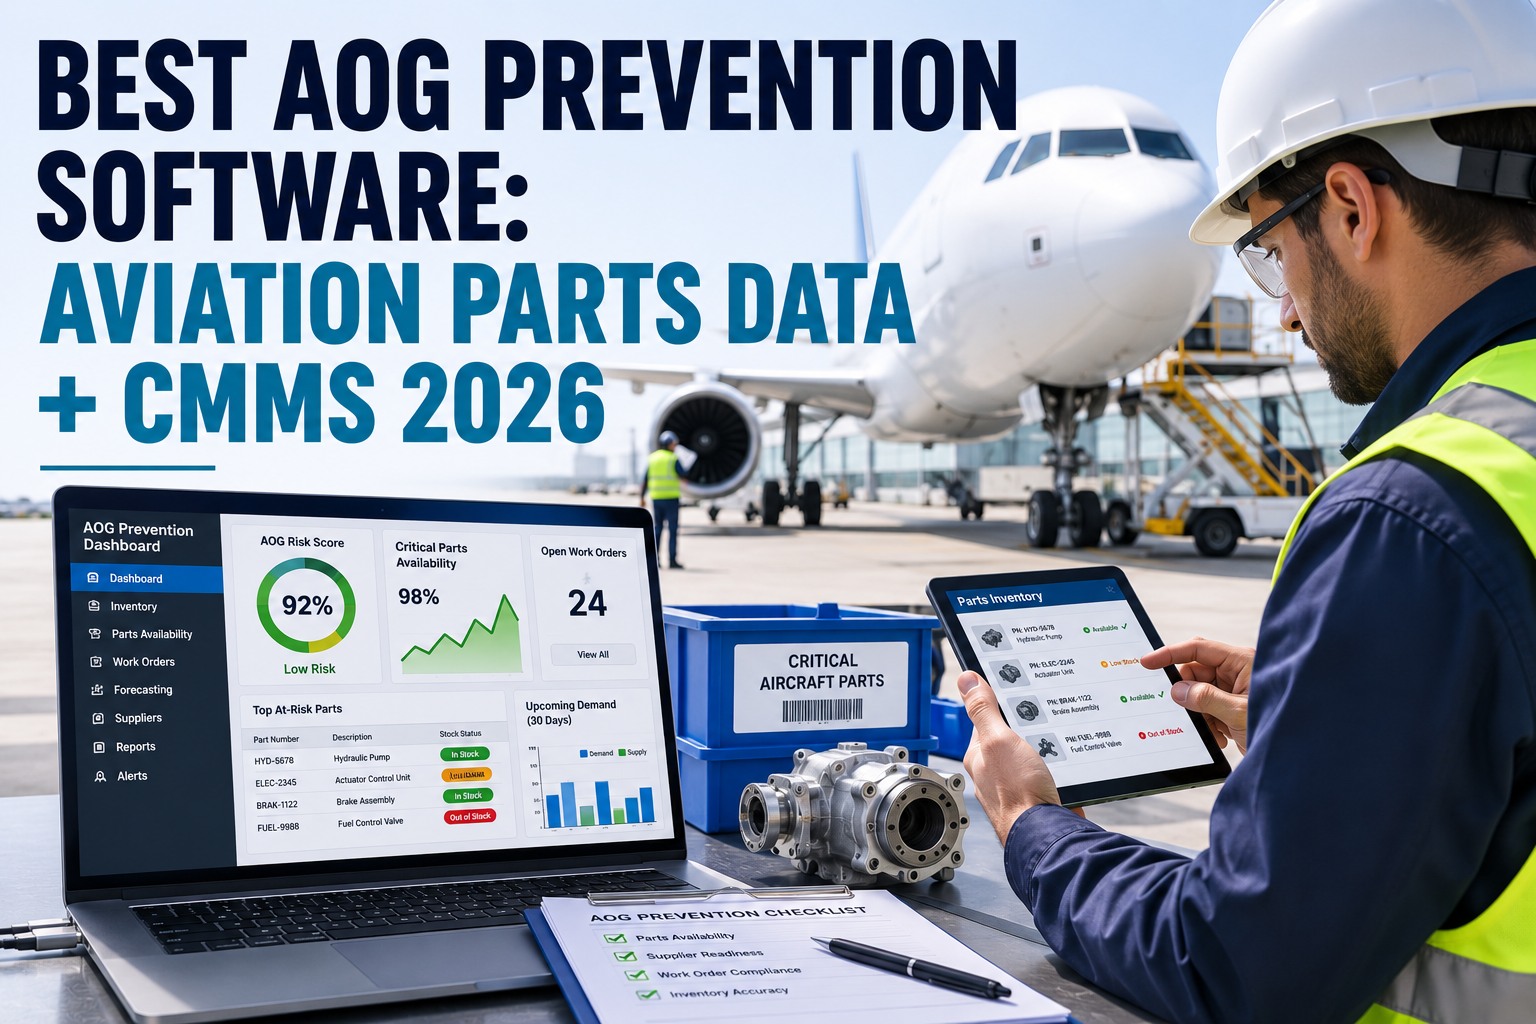
Most maintenance systems record an AOG event after the fact. A modern AOG risk-scoring layer does the opposite: it fuses component life-limit data, deferred-defect aging, and parts availability signals into a single risk index that flags trouble 3–5 days before dispatch impact — when you still have time to act.
What one unscheduled grounding actually costs you
A narrow-body AOG averages $10,000 per hour; a wide-body at a slot-constrained hub can hit $150,000 per hour once crew repositioning, passenger disruption, and missed connections compound.
Ground hours dominate the equation — so every hour of early warning translates linearly into recovered margin.
A 32-aircraft regional operator running a 14-day deferred-defect backlog was averaging 11 AOG events per quarter at an average ground time of 16 hours. At $18,000/hr (regional jet, secondary hub), that's $3.17M per year in avoidable ground cost. After deploying a CMMS-based risk dashboard with 72-hour lead scoring, unscheduled AOG events dropped to 4 per quarter and mean ground time fell to 9 hours — a $2.1M annual recovery on a $42K/yr CMMS subscription. Payback: under 9 days.
The five leading indicators your CMMS should be scoring
Reactive maintenance watches lagging indicators (MTBF, failure counts). Predictive AOG prevention scores leading indicators — signals that move before the failure does.
Approaching compliance deadline indicators
Track life-limited parts (LLP) against remaining cycles/hours and overlay the next 14 dispatch windows. When two life-limit replacements converge inside the same 72-hour window, the risk score spikes — because neither can be deferred and parts must be staged now, not at the next base check.
Deferred defect aging beyond MEL Category C
Every deferred defect carries a repair clock. Category C MEL items allow up to 10 days, but an aging stack of 4+ open deferrals on one tail doubles the probability that a new defect will exceed MEL limits and trigger an AOG. Score the stack, not just the individual item.
Spare parts availability prediction
A rotable with 22 remaining cycles, zero local stock, and an 11-day supplier lead time is an AOG waiting to happen. The CMMS should pull real-time inventory and supplier ETAs, then compute a "stock-out probability" for each critical part within the next 10 dispatch cycles.
Repeat removals on the same ATA chapter
Three component removals on the same ATA chapter within 90 days is a reliability red flag. The risk model weights this heavily because it signals an unresolved root cause — the next removal is statistically imminent and may not align with a maintenance window.
Line-station skill and bay availability
Even with parts and time on your side, an AOG fires if the right licensed engineer isn't on shift. Score the next 5 overnight windows against the roster: a critical task with no B1/B2 coverage on a given night inflates that dispatch window's risk score by up to 35%.
Building the AOG risk dashboard: a 4-week rollout timeline
A functional AOG risk dashboard doesn't require a multi-year digital transformation. Most operators go live inside 30 days when they sequence the build correctly.
Data foundation & integration
Ingest life-limit records, deferred-defect logs, current inventory positions, and supplier lead times into the CMMS. Cleanse ATA chapter mapping and normalize part numbers. Target: 95% data completeness on top-50 critical rotables.
Risk model calibration
Weight the five indicators against 24 months of historical AOG events. Run back-testing: the model should have flagged ≥80% of actual AOGs with a 72-hour lead. Tune thresholds until false-positive rate sits under 15%.
Dashboard build & alert routing
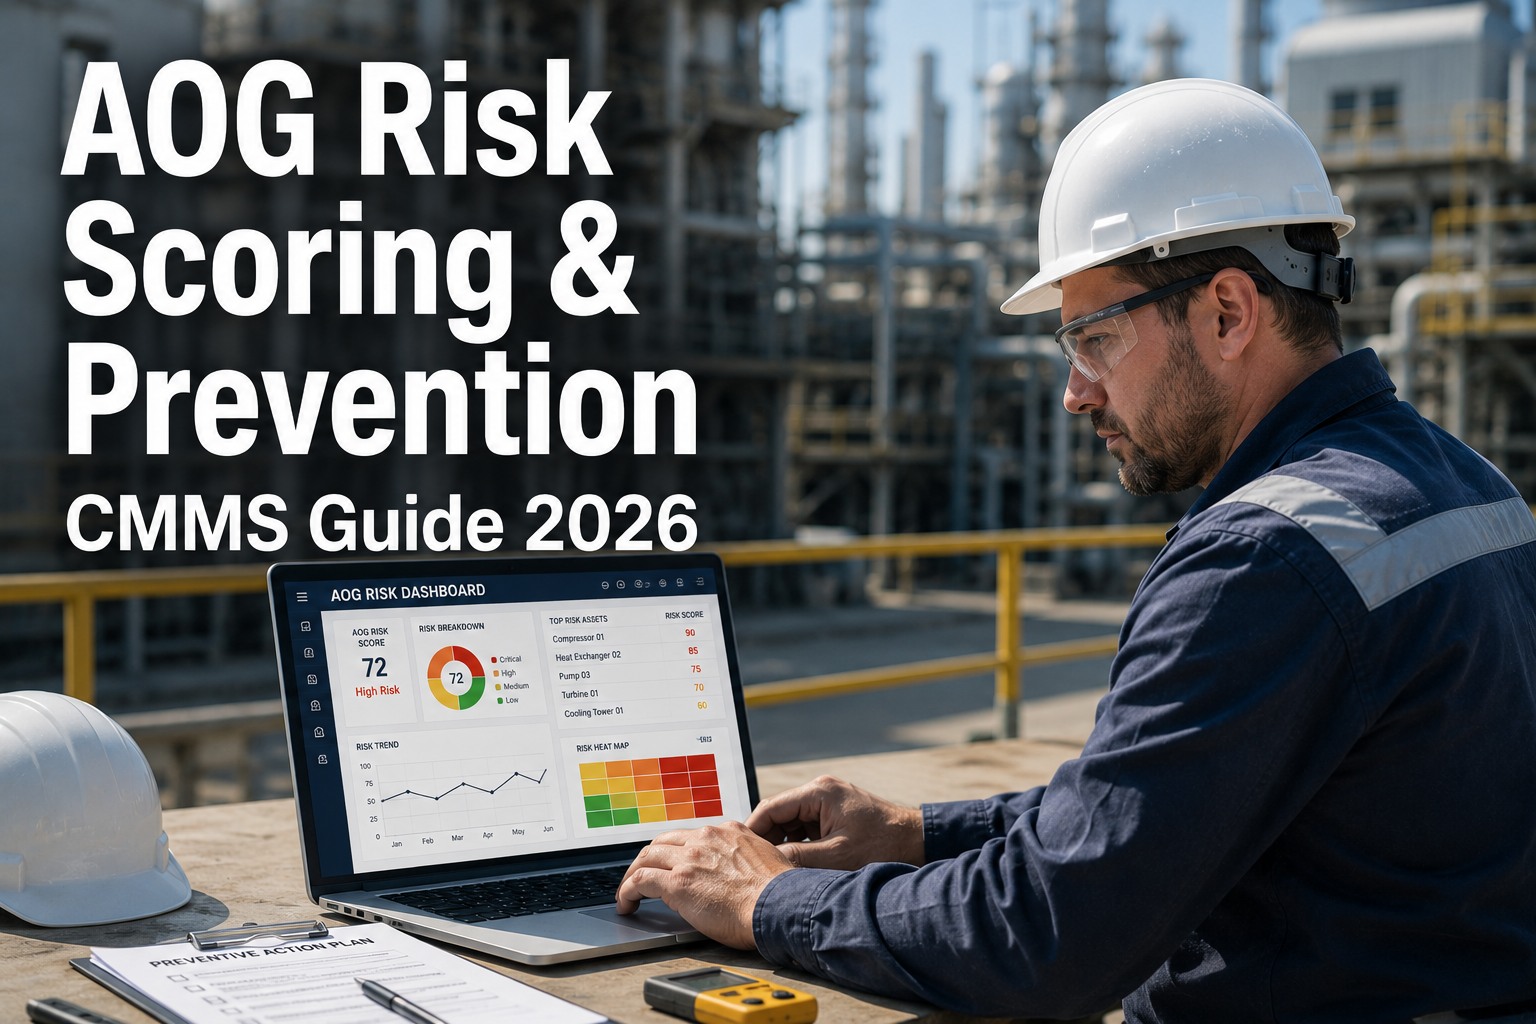
Deploy the live dashboard with tail-level risk scores (0–100), color-coded dispatch windows, and drill-down to the driving indicator. Route amber alerts to shift leads, red alerts to maintenance control, 72 hours before departure.
Pilot, refine, and scale
Run the model live on 10% of the fleet for 7 days. Compare predicted vs. actual AOGs. Refine indicator weights, then roll out fleet-wide with a weekly reliability review baked into the maintenance schedule.
How the AOG risk index is calculated
The composite score is a weighted sum normalized to 0–100. Every indicator contributes a sub-score; the composite drives the color band and the alert threshold.
Where LLP = life-limit collision sub-score, DDA = deferred-defect aging, PAS = parts availability, RDR = recurring-defect rate, RSC = resource/skill conflict. Each sub-score is 0–100. Composite ≥75 = RED (act now), 50–74 = AMBER (plan intervention), <50 = GREEN.
| Risk Band | Score | Lead Time | Action |
|---|---|---|---|
| GREEN | 0–49 | Normal monitoring | Continue scheduled checks; no intervention |
| AMBER | 50–74 | 72–120 hrs | Stage parts, assign engineer, pre-position tooling |
| RED | 75–100 | <72 hrs | Divert to maintenance base; cancel or swap aircraft |
What changes when AOG risk becomes a number, not a surprise
Operators who move from reactive AOG logging to predictive risk scoring report measurable shifts across reliability, cost, and schedule integrity within the first quarter.
Within the first month our risk dashboard flagged a life-limit collision on tail 4-AX that would have grounded the aircraft at an outstation with no LLP stock. We pre-positioned the part for $3,200 in logistics and avoided an estimated $86,000 AOG. The dashboard paid for itself on that single catch.
Stop logging AOGs. Start preventing them.
Deploy a CMMS that scores AOG risk 72 hours before it grounds your aircraft — and recover six figures per tail, per year.
AOG risk scoring — your questions answered
What exactly is an AOG risk score?
It's a composite 0–100 index that fuses five leading indicators — life-limit collisions, deferred-defect aging, parts availability, recurring-defect rate, and resource conflicts — into a single number per aircraft per dispatch window. A score of 75+ means an AOG is probable within 72 hours and you should act now. It replaces gut-feel "this tail feels risky" conversations with a number everyone can rally around.
How much historical data do we need to calibrate the model?
A minimum of 12 months of deferred-defect logs, removal records, and AOG event history produces a usable model; 24 months produces a robust one. The calibration step back-tests the weighted formula against your actual AOG events — if the model would have flagged ≥80% of them with a 72-hour lead, the weights are sound. Most operators hit that threshold inside the second calibration pass.
Can the dashboard integrate with our existing MRO and inventory systems?
Yes — OxMaint connects to standard MRO/EAM platforms, inventory databases, and supplier portals via REST API. The parts-availability sub-score depends on real-time stock and lead-time feeds, so that integration is the highest-value data pull during Week 1. You can Book a Demo to see a live integration map for your stack.
What's the false-positive rate, and how do we keep it manageable?
A well-calibrated model targets a false-positive rate under 15% — meaning fewer than 1 in 7 amber alerts results in no AOG. You control this by tuning indicator weights during back-testing and by setting the amber threshold at 50 (not 40). If false positives climb, the fix is almost always tighter deferred-defect aging weights, not looser thresholds.
How quickly can we go live, and what does it cost?
The standard rollout is 4 weeks from data ingestion to fleet-wide go-live. Pricing scales with fleet size and starts well below the cost of a single wide-body AOG hour. A 32-aircraft operator typically recovers the annual subscription inside the first 9 days of deployment. You can Start Free Trial to pilot the dashboard on a subset of tails before committing.
Your next AOG is already forming in your data. See it before it lands.
Join the operators using OxMaint to score AOG risk, pre-position parts, and keep tails flying. Free 14-day trial, full dashboard access, no credit card required.
Free 14-day trial · No credit card