When a baggage handling system (BHS) conveyor stops at 05:40 on a Monday, the repair invoice is the smallest part of what it costs. There is the call-out, the overtime, the rush-ordered spare, the bags being hand-carried to the aircraft, the airline asking for an explanation, and the next three jams caused by the same worn component. Preventive maintenance (PM) looks like extra spend until you put the two costs side by side. This guide shows how to compare reactive BHS repairs against planned maintenance in a way finance will accept: what to count, how to measure it, and how to build the baseline from your own records in OXMAINT AI, the AI-powered CMMS for airport and aviation maintenance teams.
Airport BHS Maintenance · Cost Comparison · OXMAINT AI-Powered CMMS
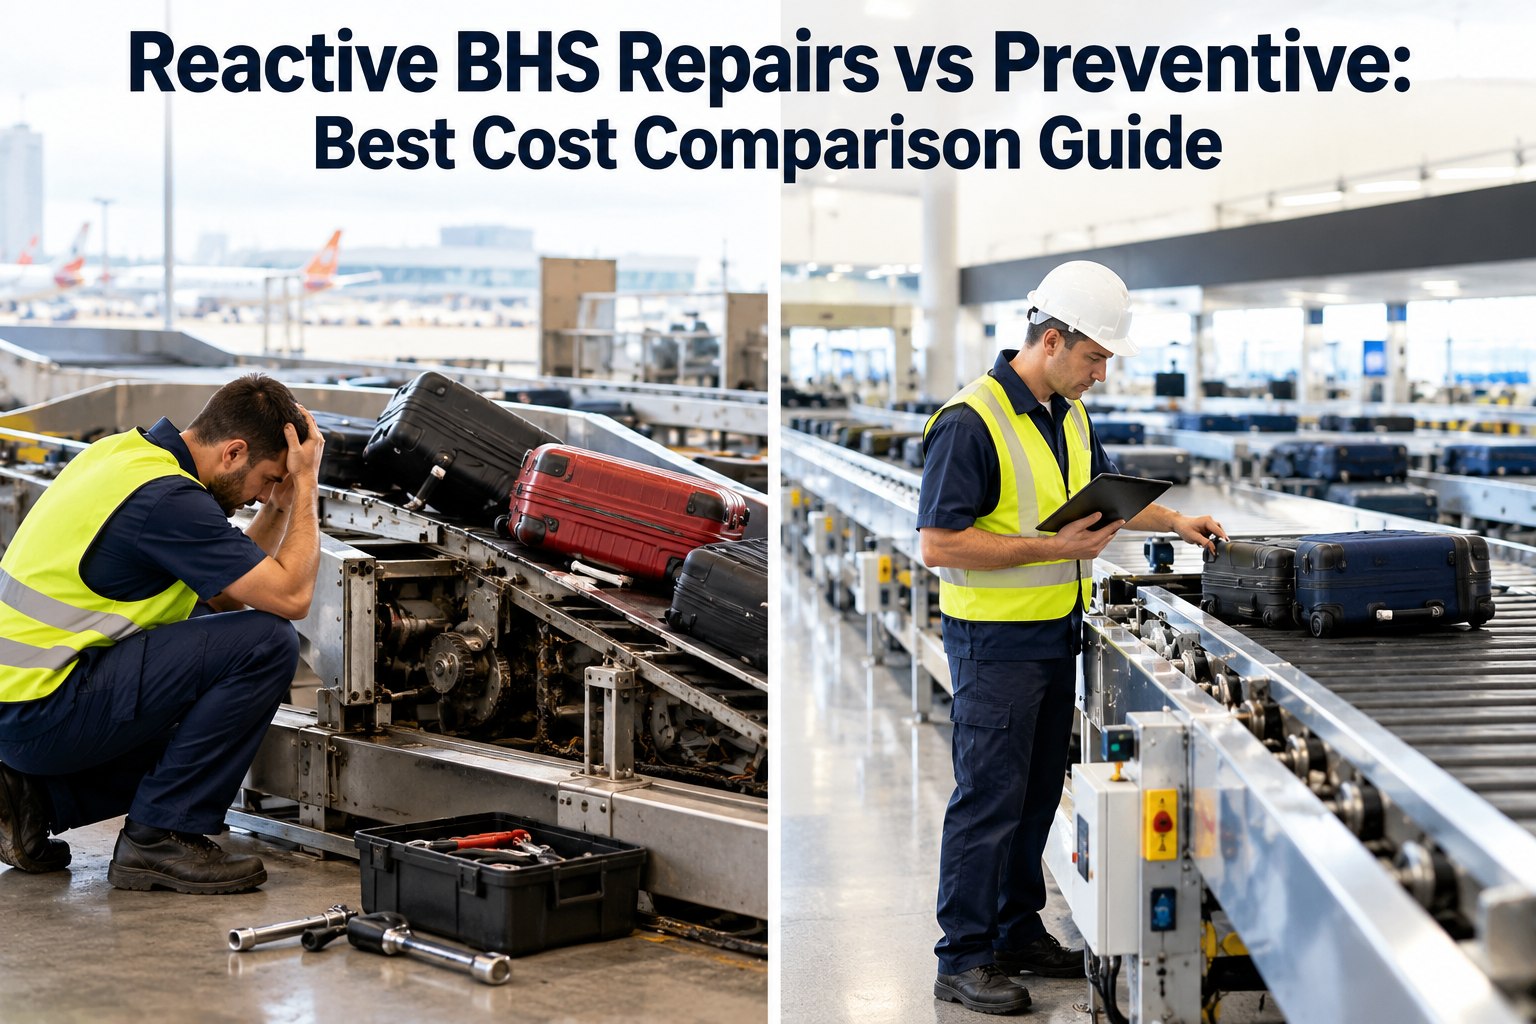
Reactive BHS Repairs vs Preventive: Best Cost Comparison Guide.
Breakdown requests on paper, spares chased by phone, downtime nobody timed: this is why the cost of reactive BHS work is hard to prove. OXMAINT AI connects requests, inspections, work orders and PM schedules in one platform, so your cost baseline comes from records, not guesses.
One connected workflow
1
Request & InspectFaults and findings logged on mobile
▼
2
Issue or DefectTied to the conveyor, motor or diverter
▼
3
Work OrderLabour, parts and downtime recorded
▼
4
PM & PredictiveRecurring faults become scheduled tasks
The BHS Cost Iceberg: What the Invoice Doesn't Show
Most reactive-versus-preventive comparisons fail because they only count what is visible: parts and technician time. The larger share sits below the waterline. Sign up free and start capturing the hidden costs on every work order.
VISIBLE
Replacement partsTechnician hours
waterline: where most business cases stop
HIDDEN
Overtime & call-out premiums
Expedited freight & rush spares
Secondary damage to nearby parts
Manual bag handling labour
Delayed or mishandled bags
Airline or service-level penalties (per contract)
Lost capacity at peak waves
Repeat failures from the same root cause
Conceptual illustration, not to scale. Your own records show the real proportions.
Same Fault, Two Paths
Picture a worn belt drive on an outbound conveyor. Follow the same fault through both approaches. Book a demo to see planned and reactive work side by side.
REACTIVE PATH
1 Belt slips, line stops mid-wave
2 Call-out, technician diagnoses on the spot
3 Spare not in stock, rush order placed
4 Bags are hand-carried while the line is down
5 Repair in a hurry, no time to inspect neighbours
PLANNED PATH
1 Inspection spots wear on a scheduled round
2 Work order raised with parts and procedure
3 Spare drawn from stock or ordered at standard lead time
4 Work done in a quiet window, no bag disruption
5 Time to check related components while access is open
The 4 Cost Drivers to Measure
Skip the industry averages. Your cost comparison is strongest when every driver comes from your own work order history. Here is what each one means and how to measure it. Start free and capture these fields from the first work order.
Labour Multiplier
Reactive work often needs more people, premium hours and longer diagnosis time than the same task done as planned work.
Reactive labour cost per task ÷ planned labour cost per similar task
Spare Escalation
Emergency purchases bring rush freight, premium supplier pricing and over-ordering "just in case".
Price paid on urgent orders ÷ price on standard orders for the same part
Downtime Cost
Every minute of stoppage carries manual handling, delays and operational knock-on effects.
Downtime minutes × your cost per minute of BHS unavailability
Repeat & Secondary Damage
A rushed fix may leave the root cause in place, so the same fault returns or damages the next component.
Repeat failures on the same asset within a set period ÷ total failures
Pull Your Baseline From the CMMS
A credible business case starts with a clean 12-month snapshot. These six pulls give finance the evidence it asks for. Book a demo to see these reports built.
Planned vs reactive split
What share of BHS work orders is emergency or breakdown?
Labour hours by type
How many hours, and how many at overtime rates, go to reactive work?
Parts cost and urgency
Which spares were bought on rush orders, and at what premium?
Downtime minutes by asset
Which conveyors, diverters or motors stop the system most?
Repeat failures
Which faults keep returning after repair?
PM completion rate
Is existing PM actually being done on schedule?
Where to Start: Rank BHS Assets by Impact and Frequency
You do not need to preventively maintain everything at once. Place assets on this grid using your failure and downtime data, and invest in the top-right first.
HIGH IMPACT
Plan carefullyRare but severe: critical drives, controls, key diverters. Use inspections and spares planning.
PM firstFrequent and severe: busy conveyors, motors, gearboxes, photo-eyes. Biggest payback potential.
LOW IMPACT
Run on conditionRare and minor: inspect occasionally and fix when needed.
StandardiseFrequent but minor: simplify fixes, stock common parts, automate checks.
LOW FREQUENCY
HIGH FREQUENCY
Show Finance the Numbers From Your Own Work Orders.
OXMAINT AI keeps labour, parts, downtime and failure history on the same record, so your reactive-versus-preventive case is built on evidence.
5 Mistakes That Weaken a PM Business Case
1 Counting PM labour as new cost while ignoring the reactive labour it replaces
2 Leaving downtime out because nobody timed it
3 Using industry averages instead of your own history
4 Comparing one dramatic failure rather than a full year of data
5 Overlooking that some PM tasks are not worth doing and should be dropped
How OXMAINT AI Supports the BHS Cost Case
OXMAINT AI is an AI-powered CMMS and EAM platform with workflows for airports and aviation. It turns everyday BHS maintenance into the cost evidence your business case needs. Start free and load your BHS assets into OXMAINT AI.
Request Maintenance
Operations staff raise faults quickly, so every breakdown starts as a timed, traceable record.
Work Order Management
Capture labour hours, parts used and failure codes on the same work order.
Automated PM Scheduling
Time-based and usage-based triggers create recurring tasks without manual planning.
Parts & Inventory
Stock critical BHS spares, so you are not paying rush rates when a belt fails.
Predictive Maintenance
Connect vibration, temperature and cycle data from conveyors and motors to raise alerts as tasks.
Offline-First Mobile
Technicians update work orders at the belt or in the baggage hall, even with weak signal.
Frequently Asked Questions
Is preventive maintenance always cheaper than reactive repair for a BHS?
Not automatically. Over-maintaining low-risk assets wastes effort. The goal is to put PM where failures are frequent or costly and to run the rest on condition. Your own work order history shows which is which.
Sign up free and start building that history.
What is the labour multiplier in maintenance cost comparisons?
It is the ratio between what a task costs in labour when done reactively and what a similar task costs when planned. It reflects overtime, call-outs, extra people and longer diagnosis. Measure it from your records rather than assuming a figure.
Book a demo to see labour tracked by work order type.
How do I put a cost on BHS downtime?
What data do I need for a PM business case?
Twelve months of work orders split by planned and reactive, labour hours, parts costs, downtime minutes and repeat failures by asset. A CMMS makes this a report rather than a research project.
Book a demo to see the reports.
Where should we start if our BHS records are incomplete?
Begin with your most critical or most failure-prone assets, standardise how breakdowns are logged, and build the baseline over the next few months while PM starts on the highest-impact items.
Sign up free and begin with one conveyor line.
Prove the Cost of Waiting. Plan the Work Instead.
Connect requests, inspections, work orders and PM in one workflow. OXMAINT AI gives your BHS team the baseline to make the case, and the schedule to act on it.