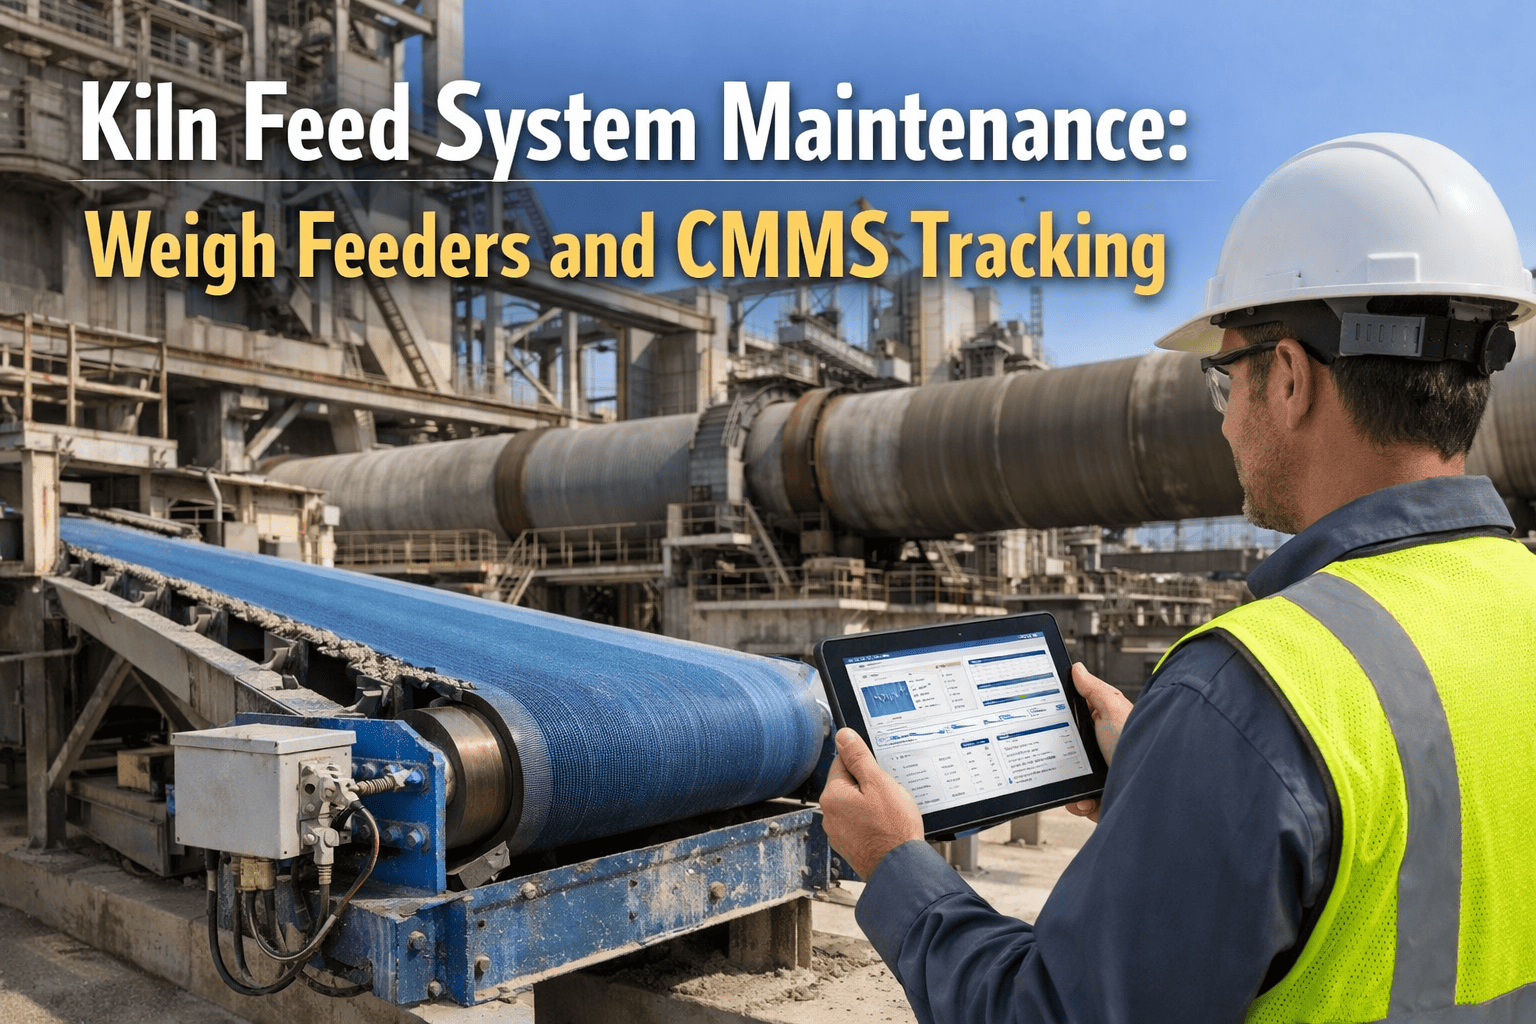
Walk onto the feed floor of any dry-process kiln line and ask the shift supervisor how tight their kiln feed rate control really is, and most will quietly admit the number drifts wider than the plus-or-minus 2 percent band the process actually demands. A weigh feeder that has drifted by just 2 percent can shift raw meal LSF by more than a full point, pushing free lime past the range where clinker quality holds and forcing burning zone temperature up to compensate. Left undetected for a full quarter, that single drifting feeder routinely costs a 5,000 TPD kiln line between $480,000 and $920,000 in excess fuel, downgraded clinker, and rejected cement — losses that almost never show up clearly in a daily SCADA trend. A cement CMMS built around calibration discipline, bin flow monitoring, and feed rate stability tracking closes that gap long before it reaches the kiln. If your plant still calibrates weigh feeders only when lab results start looking strange, Oxmaint's kiln feed uniformity module gives your team a structured calibration and bin flow tracking system built to catch drift weeks before it reaches the burning zone.
CMMS GUIDE · KILN FEED UNIFORMITY 2026
Best Cement Plant CMMS for Kiln Feed Uniformity and Bin Flow Control 2026
Calibration discipline, bin flow visibility, and feed rate stability tracking are what keep a kiln inside its process band instead of chasing free lime swings shift after shift. Here is how the best cement CMMS platforms manage kiln feed uniformity in 2026.
THE REAL COST OF FEED RATE DRIFT
±2%
Industry accuracy band for kiln feed rate
Kiln feed systems are designed to hold the set feed rate within roughly 2 percent across the full operating range. Anything wider destabilizes burning zone temperature and free lime almost immediately.
$480K-$920K
Annual loss from one uncalibrated feeder
A single raw meal weigh feeder left drifting for a full quarter can cost a 5,000 TPD kiln this much in excess fuel, rejected clinker, and cement strength downgrades — usually invisible in routine SCADA trends.
0.2%
Feeder error right after a fresh drop test
A freshly zeroed and span-verified weigh feeder should hold error below 0.2 percent. Watching how fast that number climbs is the earliest warning sign a CMMS can track.
5-12%
Kiln feed lost to preheater exhaust dust
A meaningful share of kiln feed exits with preheater exhaust gas as dust with a different chemistry than the main stream, which means feed rate has to be biased and tracked, not just set and forgotten.
FEED PATH VISIBILITY
From silo to burning zone: how CMMS tracks kiln feed uniformity
1
Blending Silo Homogenization
Controlled-flow and loss-in-weight silo extraction rates are logged continuously, with aeration pattern checks flagging the dead zones and short-circuiting that quietly break down blend consistency before material ever reaches the feeder.
2
Weigh Feeder Calibration
Rotor and belt weigh feeders follow a tiered calibration schedule — daily zero checks, weekly mechanical inspection, monthly span verification, and a full drop test on a fixed interval — logged per feeder, not per plant memory.
3
Feed Rate Stability Monitoring
Real-time deviation against the accuracy band is trended per feeder, with belt tension, idler wear, and splice condition logged alongside so mechanical causes of drift are visible before the number itself moves.
4
Kiln Response Correlation
Feeder error trends sit next to free lime, specific energy consumption, and burning zone temperature in one dashboard, so a drift that operators would otherwise chase for weeks gets traced to its actual source in one view.
See your own feed rate drift trend before it reaches the kiln
Oxmaint maps your weigh feeders, blending silos, and feed bins into one hierarchy and starts flagging calibration drift within the first 30 days — no line stoppage required to get started.
FEED-PATH ASSET TRACKING
Every asset in the feed path, tracked in one hierarchy
Rotor & Belt Weigh Feeders
Calibration cycle: daily to quarterly
Zero and span drift logged per shift
Load cell health tracked against baseline
Splice and idler condition inspected monthly
Drift above 0.6% triggers a maintenance work order automatically
Kiln Feed & Surge Bins
Inspection cycle: weekly flow check
Bridging and rat-holing incidents logged
Discharge gate wear tracked by tonnage
Level sensor accuracy verified monthly
Flow interruption history feeds bin design review decisions
Blending & Storage Silos
Homogenization index: target 5-10
Aeration pattern and pressure logged per zone
Outlet composition sampled against blend target
Fabric and airslide condition inspected quarterly
Dead-zone trends flagged before homogenization drops
Bucket Elevators & Airslides
Condition check: continuous
Motor current and bucket wear trended
Chain tension measured on fixed intervals
Fluidization pressure monitored per segment
Feed stoppage risk scored ahead of unplanned trips
Feed Rate Control Loop
Response window: seconds, closed-loop
Setpoint deviation logged against elevator power
Feedforward correction accuracy reviewed weekly
Controller self-check alerts routed automatically
Closed-loop correction history tied to feeder work orders
Kiln Dust Insufflation System
Bias review: per production shift
Dust return rate tracked against raw mill status
Composition bias logged against kiln feed target
Surge bin transfer events time-stamped
Chemistry bias data feeds the free lime correlation view
CALIBRATION DISCIPLINE
The four-tier calibration schedule that keeps feeders honest
Tier 1
Daily Zero Check
Quick zero verification at shift start catches the fastest-moving drift before it reaches the lab report.
Tier 2
Weekly Mechanical Check
Belt tension, idler alignment, and splice condition inspected to catch mechanical causes before they show up as feed error.
Tier 3
Monthly Span Verification
Full-scale span check confirms the feeder reads accurately across the entire operating range, not just at zero load.
Tier 4
Quarterly Drop Test & Full Calibration
Complete drop test recalibrates the feeder from scratch and resets the drift clock with a documented, auditable record.
| Feeder Error |
What It Usually Means |
CMMS Action |
| Under 0.2% |
Fresh calibration, feeder healthy |
Routine monitoring only |
| 0.2% to 0.6% |
Normal drift from belt stretch or buildup |
Flagged for next scheduled check |
| 0.6% to 1.2% |
SEC and free lime start trending up |
Work order generated automatically |
| Above 2% |
Clinker quality risk, downgrade likely |
Priority alert to shift and quality team |
SYSTEM INTEGRATION
How feed uniformity data connects to SCADA, quality, and ERP
SCADA & DCS Feed Sync
Feed rate setpoints and actuals pull directly from the control system, so feeder deviation trends in the CMMS always match what the control room is seeing in real time.
Quality Lab Crosslink
Free lime, LSF, and XRF composite sample results are linked against feeder drift timelines, turning a lab alert into a traceable feed-path root cause instead of a mystery.
ERP Maintenance Cost Sync
Labor, parts, and calibration service costs from every feeder work order post to the correct ERP cost center automatically, closing the loop between reliability spend and asset performance.
Shift Alert Routing
Deviation alerts route to the right shift supervisor or reliability engineer by feeder and severity, so a 1.2% drift never sits unnoticed for a full production run.
FREQUENTLY ASKED QUESTIONS
What plant teams ask about kiln feed uniformity CMMS
Stop chasing free lime swings after the fact
Oxmaint gives your feed floor team calibration discipline, bin flow visibility, and feed rate stability tracking in one hierarchy — so drift gets caught in the feed path, not in the lab report three shifts later.