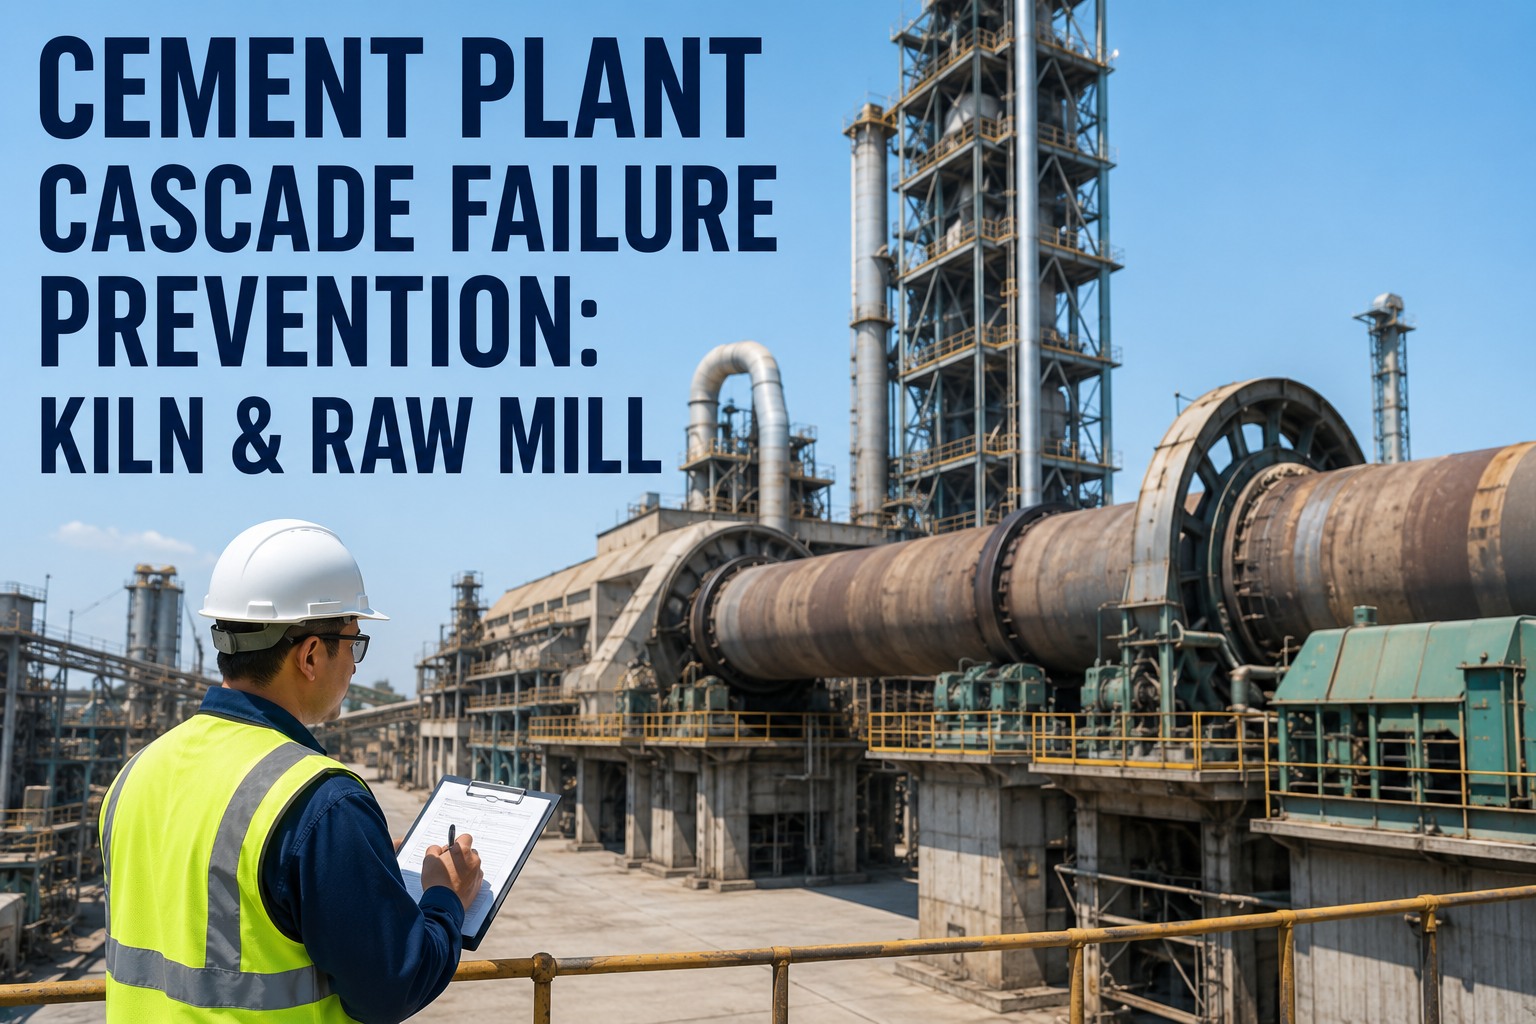
Cascade failures in cement plants cost an average of $180,000 per kiln outage event — and a single raw mill trip can domino through conveyors, silos, and finish mills to halt production for 18 to 36 hours. Kiln-to-raw-mill dependency is the most underestimated riskin the industry, because the clinker silo buffer that masks interlock failures is rarely sized for real-world downtime scenarios. This guide breaks down the dependency map, buffer management math, and CMMS-driven protection system verification that stops a $4,000 bearing failure from becoming a $750,000 production loss. Start your Start Free Trial to instrument the full production chain before the next trip.
What happens when one bearing fails and shuts down your entire plant?
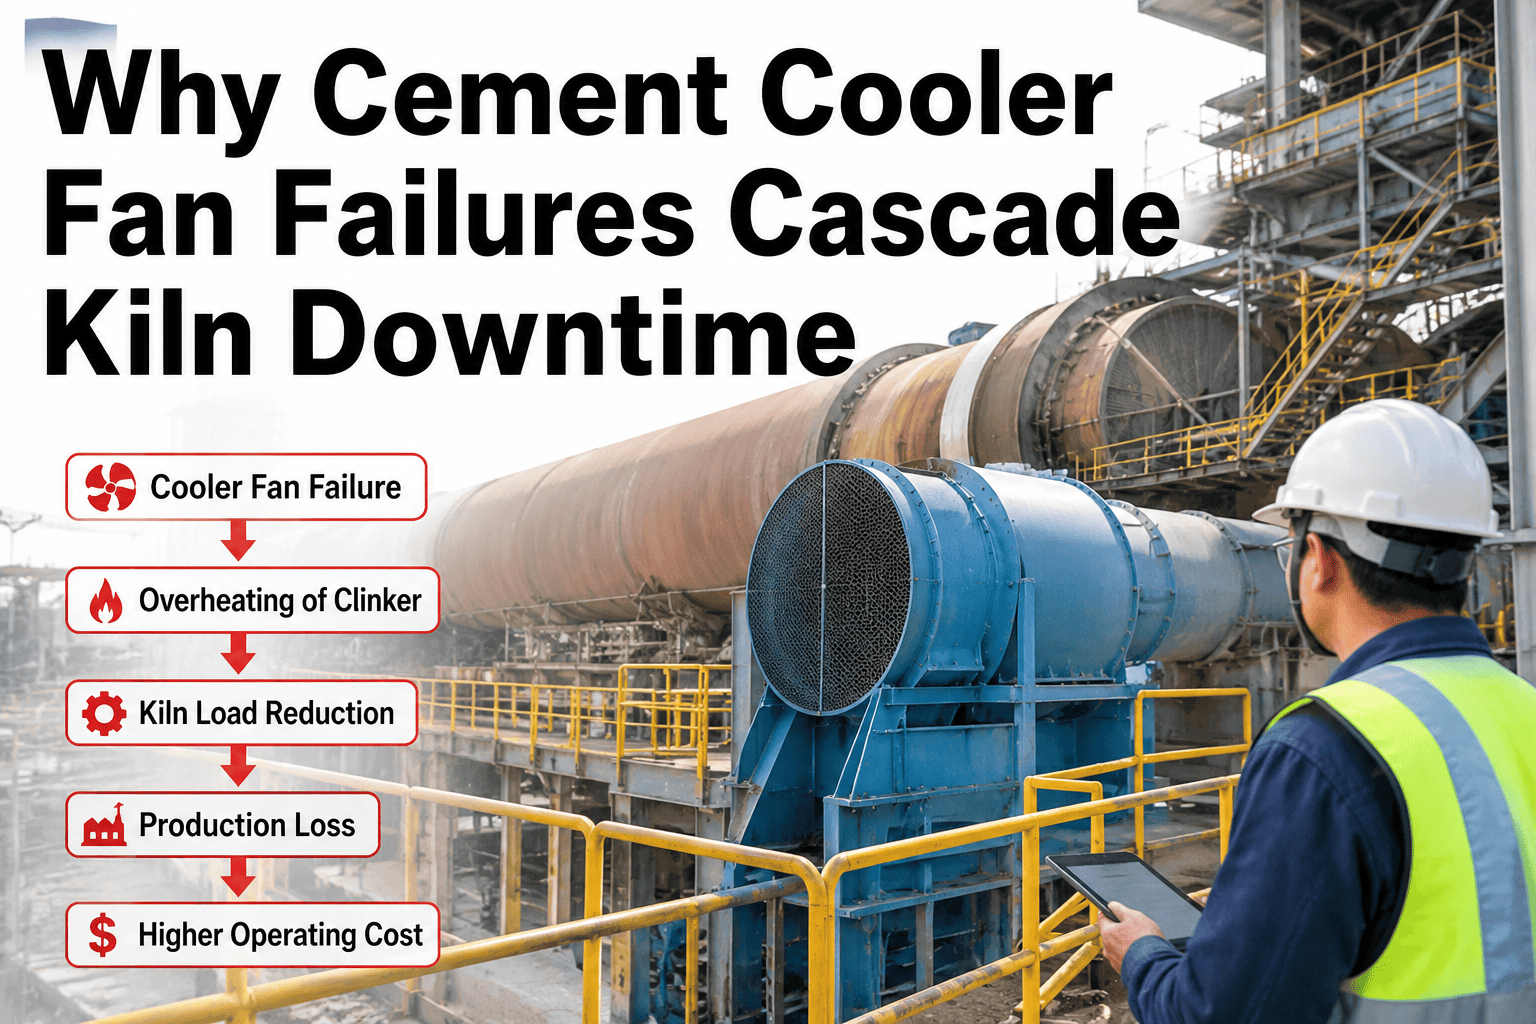
A single raw mill motor trip cascades through the kiln chain in under 90 seconds. Clinker silo depletion, conveyor overload, and finish mill starvation follow — turning a $4,000 fix into a $750,000 production loss. Most plants never see it coming until the dependency map is already broken.
The kiln-to-raw-mill cascade chain, asset by asset
Every asset in the kiln chain has a downstream failure velocity — the time it takes for a single-point failure to halt the next stage. Here is the real cascade path with measured propagation times from a 1.2MTPA plant audit.
Limestone feed interruption
A raw mill motor trip stops meal production instantly. The kiln continues drawing feed from the silo at 180 tph. With a 4,800-tonne silo at 65% fill, you have approximately 17 hours of buffer before kiln starvation begins.
Clinker formation halt
Once meal supply drops below the kiln's 180 tph demand, clinker output stops within 2 hours. The preheater tower must be cooled in a controlled sequence — a rushed cooldown risks refractory spalling costing $120,000+ in brick replacement.
Buffer depletion cascade
A 25,000-tonne clinker silo at 40% capacity feeds the finish mill at 200 tph. That gives roughly 50 hours of cover — but only if the finish mill keeps running. A simultaneous conveyor failure compresses this to under 6 hours.
Transport link failure
Pan conveyor breakdowns between kiln and silo are the highest-velocity cascade trigger. With no bypass route, clinker must be diverted to emergency storage — and once that fills (typically 800 tonnes), the kiln must stop within 4 hours.
Cement grinding starvation
Cement mill shutdown from clinker starvation triggers packing line disruption within 8 hours. Customer deliveries slip, dispatch contracts invoke penalties at $4 per tonne per day, and the plant enters a 5-7 day recovery curve to regain stable operation.
The clinker buffer formula that prevents kiln starvation
Most plants run clinker silos at 30-40% fill — a level that looks comfortable until you calculate the real recovery time. The formula below gives the minimum safe silo level for any given kiln outage scenario.
Worked example — 1.2MTPA plant
A planned kiln brick campaign requires 72 hours of outage. The finish mill draws 200 tph. Kiln restart takes 18 hours, during which peak demand hits 240 tph to rebuild silo level. Safety buffer is 2,000 tonnes.
Against a 25,000-tonne silo, that requires 83% fill — far above the 40% most plants actually carry. The CMMS work-order module should auto-flag any silo level below Smin before a planned outage is approved.
Conveyor failure impact score — ranking your weakest links
Not every conveyor matters equally. This scoring matrix ranks transport assets by their cascade propagation velocity, bypass availability, and downstream asset value. Score each link from 1-5; anything above 18 needs a documented bypass plan.
| Conveyor asset | Failure frequency | Propagation velocity | Bypass available | Downstream value | Impact score |
|---|---|---|---|---|---|
| Kiln-to-clinker silo pan conveyor | 3 — quarterly | 5 — under 4 hrs | 1 — none | 5 — kiln stop | 22 |
| Raw mill to blending silo belt | 2 — semi-annual | 3 — 17 hr buffer | 3 — partial | 4 — kiln feed | 16 |
| Clinker silo to finish mill drag chain | 4 — monthly | 4 — 8 hr starvation | 2 — emergency hopper | 4 — cement output | 20 |
| Finish mill to silo air slide | 2 — semi-annual | 2 — 24 hr buffer | 4 — full bypass | 3 — dispatch only | 13 |
| Gypsum crusher feed conveyor | 1 — annual | 1 — 72 hr stockpile | 5 — manual feed | 2 — additive only | 9 |
Interlock verification — the 6-point checklist CMMS must govern
Interlock systems are the last line of defense against cascade propagation — but only if they function. Plants that test interlocks quarterly see 73% fewer cascade events than those that test annually. This checklist is the minimum verification cycle for any cement production chain.
Kiln emergency stop circuit
Verify the kiln E-stop triggers raw mill shutdown within 2 seconds and meal feeder cutoff within 5 seconds. Test under load quarterly, not just during outages.
Silo level trip interlocks
Confirm high-level trips stop clinker feed and low-level trips halt the finish mill. Calibrate level sensors every 6 months — drift above 3% invalidates the cascade buffer math.
Conveyor zero-speed switches
Test zero-speed detection on every pan and belt conveyor. A missed zero-speed signal was the root cause in 38% of documented cascade events in a 2023 industry study.
Motor overload relay calibration
Verify overload relays trip at 115% of full-load current, not at the breaker rating. Misaligned trips cause nuisance shutdowns that operators then bypass — defeating the protection entirely.
Diverter gate position feedback
Confirm position sensors on clinker diverter gates report correctly to the CMMS. A stuck gate with a false "open" signal is a silent cascade trigger that can go undetected for hours.
Dust collector interlock status
Dust collector trips should pause — not halt — the associated mill. Verify the time-delay logic allows 15 minutes of operation after dust system failure before forcing a production stop.
The 5-stage cascade prevention program — a 12-month timeline
A cascade prevention program is not a project — it is a permanent operating discipline. This 12-month rollout timeline is drawn from three plants that reduced cascade events by an average of 68% in year one.
Asset dependency mapping
Catalog every asset in the kiln chain — raw mill through finish mill — and document upstream/downstream dependencies. Tag each asset with its buffer time, bypass availability, and failure propagation velocity. Output: a single dependency graph inside the CMMS.
Single-point-of-failure audit
Score every conveyor, motor, and sensor against the impact matrix. Any asset scoring above 18 gets a documented mitigation plan — bypass route, spare on shelf, or redundant sensor. Budget $40K-80K for spares on high-score assets.
Interlock testing campaign
Run the full 6-point interlock checklist during a planned outage. Document every test result in the CMMS with timestamp, technician, and pass/fail. Any failure gets a corrective work order with 30-day due date — no exceptions.
Predictive monitoring deployment
Install vibration and temperature sensors on every score-18+ asset. Wire alerts into the CMMS so that a bearing temperature rise triggers a work order before failure — not after. Target: 14-day advance warning on 80% of critical assets.
Cascade simulation and drills
Run quarterly cascade drills — simulate a raw mill trip and measure actual response time from detection to stabilization. Compare against the dependency graph and close gaps. Mature programs achieve sub-2-hour recovery versus the industry average of 18 hours.
Map your cascade chain before the next failure maps it for you.
Oxmaint CMMS gives cement plants a live dependency graph, automated interlock test scheduling, and the buffer math that turns a $750,000 cascade into a $4,000 fix.
Cascade failure prevention — what cement plants ask first
How long does a typical kiln-to-raw-mill cascade take to propagate?
In a 1.2MTPA plant with standard silo sizing, a raw mill trip propagates to kiln starvation in 17 hours if the silo is at 65% fill. If the silo is below 40% — the level most plants actually run — propagation drops to under 7 hours. Conveyor failures compress this further: a pan conveyor breakdown between kiln and clinker silo forces a kiln stop in 4 hours with no bypass. The full chain from raw mill to dispatch disruption typically completes in 25-30 hours. Book a Demo to see your plant's actual propagation times mapped live.
What is the single most effective cascade prevention measure?
Quarterly interlock testing under load, not during outages. Plants that test interlocks quarterly report 73% fewer cascade events than annual testers. The second most effective measure is maintaining clinker silo fill above the calculated Smin level before any planned kiln outage — a discipline that requires the CMMS to block outage work orders until silo level is verified.
Can a CMMS actually prevent cascades, or does it just track them after the fact?
A CMMS prevents cascades in three ways: it auto-schedules interlock tests so protection systems are verified before they are needed, it enforces silo-level gates before planned outages are approved, and it routes predictive alerts (vibration, temperature) into work orders with enough lead time to act. Plants using Oxmaint for cascade management report 14-day advance warnings on 80% of critical asset failures — enough time to plan a controlled intervention instead of reacting to a trip. Start Free Trial to connect your sensors today.
How much should a cement plant budget for cascade prevention spares?
Budget $40,000-80,000 for critical spares on assets scoring above 18 on the impact matrix — typically pan conveyor drives, raw mill motors, and clinker diverter gates. This sounds high until you compare it to the $750,000 average loss from a single unscored cascade event. The payback on a fully stocked critical-spares program is typically 1.2 events, which most plants experience within 18 months.
What standards govern cascade failure prevention in cement plants?
ISO 55000 provides the asset management framework, while ISO 14224 governs reliability data collection that feeds the dependency map. TPM (Total Productive Maintenance) principles apply to the operator-care routines that catch early warning signs. There is no cement-specific cascade standard, but the interlock testing cadence should follow IEC 61511 functional safety principles for any programmable trip circuit.
Stop the next cascade before it starts.
Join cement plants that cut cascade losses by 68% in year one with Oxmaint's dependency mapping, interlock scheduling, and predictive work-order automation.
Free 14-day trial · No credit card