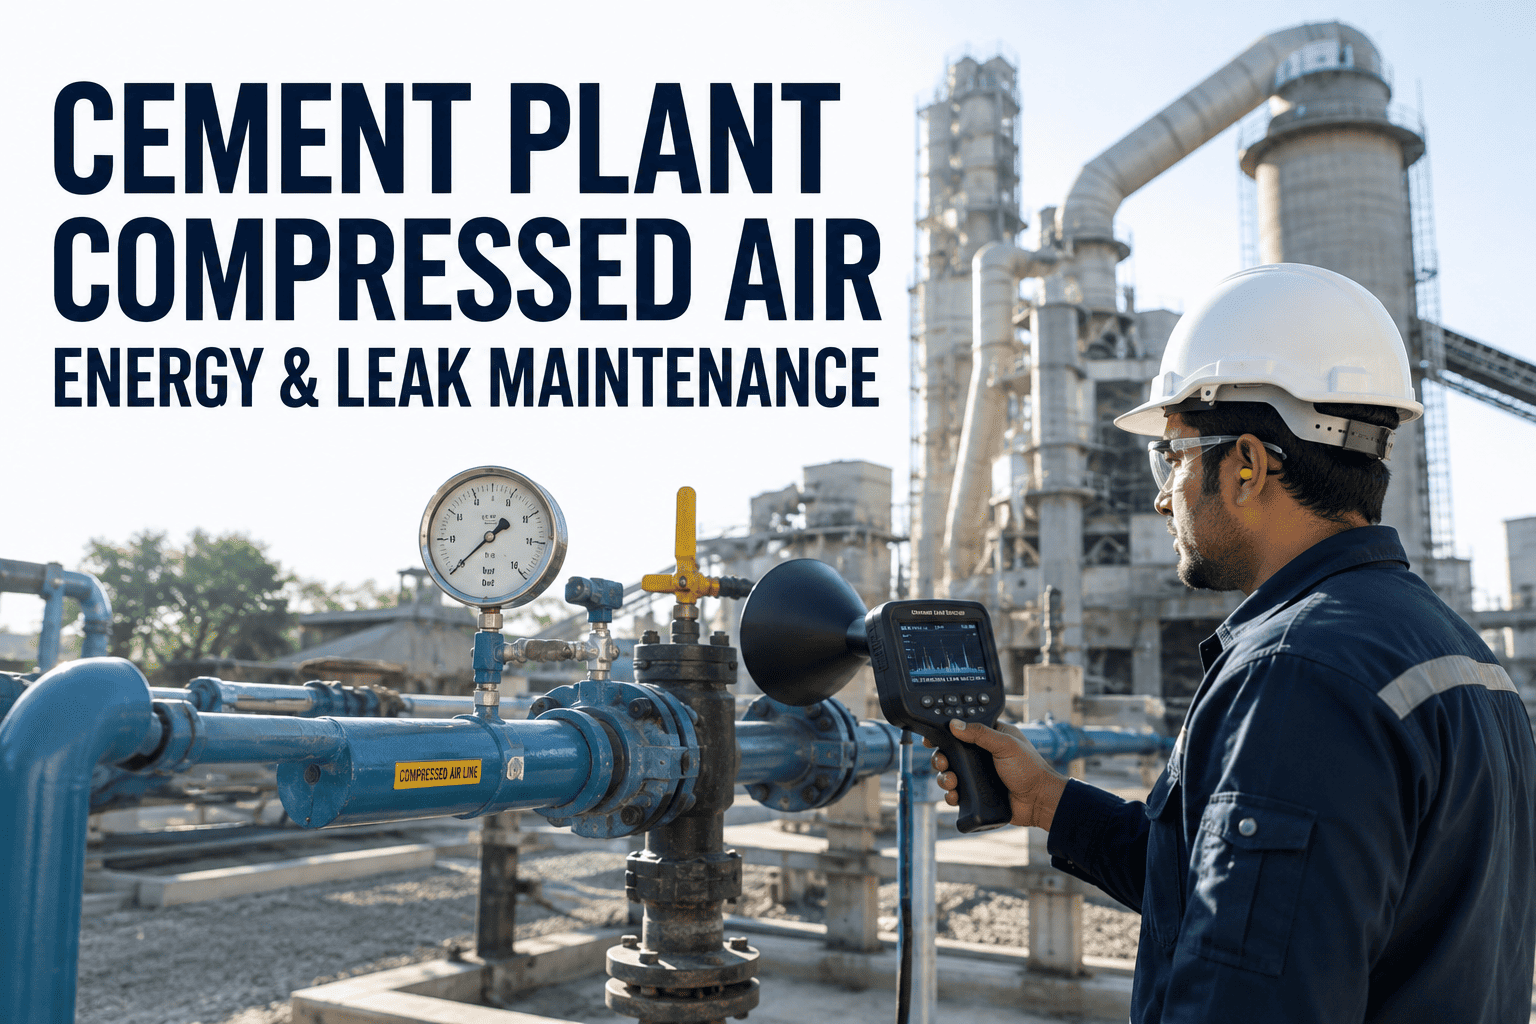
Compressed air is the most expensive utility in a cement plant — typically $0.18–$0.30 per 1,000 cubic feet delivered, three to five times the cost of electricity itself. Industry audits consistently show that 20–30% of all compressed air production in cement facilities is lost to undocumented leaks, worn couplings, and unoptimized pressure bands, which translates to tens of thousands of dollars in wasted energy every year on a single kiln line. This guide walks maintenance and reliability teams through a practical, CMMS-driven compressed air program: ultrasonic leak surveys, compressor PM, receiver and dryer service, and pulse-jet demand control. Stop bleeding cash through invisible leaks and Start Free Trial to put every air asset, work order, and leak tag on one auditable record.
Is 30% of your compressed air budget leaking into the atmosphere?
In a typical cement plant, hidden air leaks, unoptimized compressor staging, and failing pulse-jet solenoids quietly drain energy budgets year after year. A CMMS-driven air program captures every leak tag, PM task, and pressure reading in one auditable record — cutting compressed air waste by 50–80% within the first 12 months.
Why compressed air is cement's most expensive utility
Compressed air accounts for 10–20% of total electrical demand in a cement plant, yet most sites treat it as a fixed overhead rather than a controllable cost center.
A mid-size cement plant running two 500 HP rotary-screw compressors at 110 psig spends roughly $186,000/year on compressed air electricity. A 25% leak load means $46,500 is wasted annually. After a 12-week CMMS-tracked leak survey and repair program, that same plant recovers $32,000–$37,000 in the first year — a payback of under 4 months on survey and repair labor.
A structured ultrasonic leak survey in 5 phases
A leak survey is not a walk-through with soapy water. Modern cement plants use ultrasonic detectors, CMMS-issued leak tags, and pressure-decay verification to find, size, and prioritize every leak.
Establish baseline demand
Log kW, pressure, and flow at each compressor for 7–14 days using data loggers. Without a true baseline you cannot quantify savings or validate repairs — every downstream decision depends on this number.
Ultrasonic scanning across 7 zones
Scan kiln baghouse, raw mill, clinker cooler, cement mill, packhouse, truck loading, and quarry/pneumatic conveyance. Tag every leak with a CMMS QR sticker carrying zone, tag ID, and estimated CFM loss.
Estimate CFM loss and annual cost per leak
Convert ultrasonic dB readings to estimated CFM using the orifice equation. Multiply by operating hours and $/kWh to rank leaks by dollar impact — not just by sound volume, which can mislead.
Prioritized repair by dollar impact
Generate CMMS work orders ranked by annual cost. Top 20% of leaks typically represent 70–80% of total loss — fix those first. Close each work order with a pressure-decay verification photo.
Re-scan and re-baseline quarterly
New leaks develop every 90–120 days in high-vibration cement environments. Schedule recurring CMMS surveys, compare kW/ton to the original baseline, and alert the team when waste exceeds 5%.
Quantifying what a leak actually costs you
Every untagged leak is an invisible meter running 24/7. Use these standard formulas to convert dB readings and orifice sizes into dollars — then prioritize repair by payback, not by convenience.
3.547 is the approximate CFM-per-kW for a typical rotary-screw compressor at 100 psig. A single 5 CFM leak running 8,000 hours at $0.09/kWh wastes roughly $760/year.
Every 2 psi of unnecessary pressure increases compressor power consumption by about 1%. A 1,000 kW compressor running 10 psi above true demand wastes $48,000/year in extra electricity.
| Leak Size (CFM) | Equivalent Orifice | Annual Waste (kWh) | Annual Cost @ $0.09/kWh | Priority |
|---|---|---|---|---|
| 2 CFM | 1/32″ pinhole | 3,370 kWh | $303 | Low |
| 8 CFM | 1/16″ orifice | 13,480 kWh | $1,213 | Medium |
| 20 CFM | 3/32″ orifice | 33,700 kWh | $3,033 | High |
| 45 CFM | 1/8″ orifice | 75,825 kWh | $6,824 | Critical |
| 100 CFM | 3/16″ orifice | 168,500 kWh | $15,165 | Critical |
Compressor, receiver & dryer PM checklist
Leaks are half the battle — the other half is keeping compressors, air receivers, and dryers within their original efficiency envelope. A CMMS schedule prevents the slow efficiency drift that adds 5–15% to annual energy cost.
Compressor PM
- Inspect and replace intake filters every 2,000 hours
- Change oil and oil filter at 4,000-hour intervals
- Clean cooler fins quarterly to prevent overheating derate
- Calibrate pressure switches and VFD ramp rates annually
- Log kW, discharge temp, and loading hours weekly in CMMS
Receiver & Dryer PM
- Drain receiver tanks weekly; verify auto-drain function
- Inspect pressure relief valves and test release annually
- Replace refrigerated dryer coalescing filters every 6 months
- Check dewpoint sensor reading against reference monthly
- Clean condenser coils and verify hot gas bypass operation
Pulse-Jet & Demand
- Audit pulse-jet solenoids and diaphragm valves quarterly
- Set pulse interval and duration to minimum effective dose
- Replace leaking diaphragm valves during planned outages
- Verify header pressure stability within ±2 psig at peak demand
- Log artificial demand events caused by over-pressurization
Building a CMMS-driven compressed air program
A leak survey without a CMMS is a spreadsheet that dies in a month. The program only sustains when every leak tag, PM trigger, and pressure reading lives on a single auditable asset record.
Register every air asset in a parent-child hierarchy
Map compressors, dryers, receivers, headers, and pulse-jet manifolds as a navigable tree so work orders, costs, and leaks roll up to a single system view. Without hierarchy, savings cannot be attributed — and attributed savings are what fund next year's program.
Issue QR-coded leak tags tied to CMMS work orders
Each tag carries zone, estimated CFM, dollar impact, and repair priority. Scanning the tag opens the work order, closes it with a verification photo, and updates the baseline kW chart — closing the loop from detection to confirmed savings.
Automate PM triggers by runtime, not calendar
Trigger filter changes at 2,000 compressor hours and oil changes at 4,000 hours — not "every quarter." Runtime-based scheduling prevents both premature parts spend and the efficiency drift that comes from overdue service on standby compressors.
Track kW/ton of cement and $/1,000 SCF monthly
Normalize compressed air energy against production output. When kW/ton rises, the dashboard flags either a leak surge, a degrading compressor, or a demand spike — and routes the alert to the right technician before it becomes a budget line item.
After moving our air leak program into Oxmaint, we cut compressed air kWh by 23% in the first year. The QR-tag-to-work-order loop alone recovered $31,000 we didn't know we were losing.
Stop paying for air you never use
Deploy a CMMS-driven compressed air program in days — leak tags, PM schedules, and KPI dashboards included.
Compressed air maintenance, answered
How often should a cement plant run an ultrasonic leak survey?
A full plant survey should run every 90–120 days, with high-vibration zones (kiln baghouse, raw mill, clinker cooler) scanned monthly. Cement environments generate new leaks faster than most industries because of vibration, dust ingress, and thermal cycling. A CMMS recurring schedule ensures no zone goes more than one quarter without a scan — Start Free Trial to automate the cadence.
What pressure should a cement plant compressed air system run at?
Most cement plants can operate effectively at 90–100 psig at the compressor, with header pressure stabilized within ±2 psig at the farthest demand point. Running above true demand wastes 1% per 2 psi of unnecessary pressure. The correct target is the lowest pressure at which every pulse-jet baghouse and pneumatic conveyor still meets its cleaning cycle.
How much can a CMMS-driven air program actually save?
Plants that execute a structured leak survey, repair the top 20% of leaks, and enforce runtime-based PM typically recover 50–80% of compressed air waste within 12 months. For a plant spending $150,000–$200,000 annually on compressed air energy, that equals $18,000–$48,000 in year-one savings with a payback under 4 months.
Are pulse-jet baghouses a major source of air waste?
Yes — pulse-jet solenoids and diaphragm valves are among the top three leak sources in cement plants. A single stuck-open 1/8″ pulse valve wastes roughly $6,800/year. Quarterly solenoid audits and diaphragm replacement during planned outages prevent the slow demand creep that forces an extra compressor online unnecessarily.
What KPIs should we track for compressed air efficiency?
Track three core KPIs monthly: kWh per 1,000 SCF delivered, dollars per ton of cement for compressed air, and percentage of compressor loading hours versus total run hours. When kWh/1,000 SCF rises above your baseline, it signals either a leak surge, degrading compressor efficiency, or artificial demand — Book a Demo to see the dashboard live.
Turn compressed air from a cost center into a controlled asset
Leak tags, PM schedules, pressure logs, and KPI dashboards — all on one CMMS record. Start your free trial today.
Free 14-day trial · No credit card