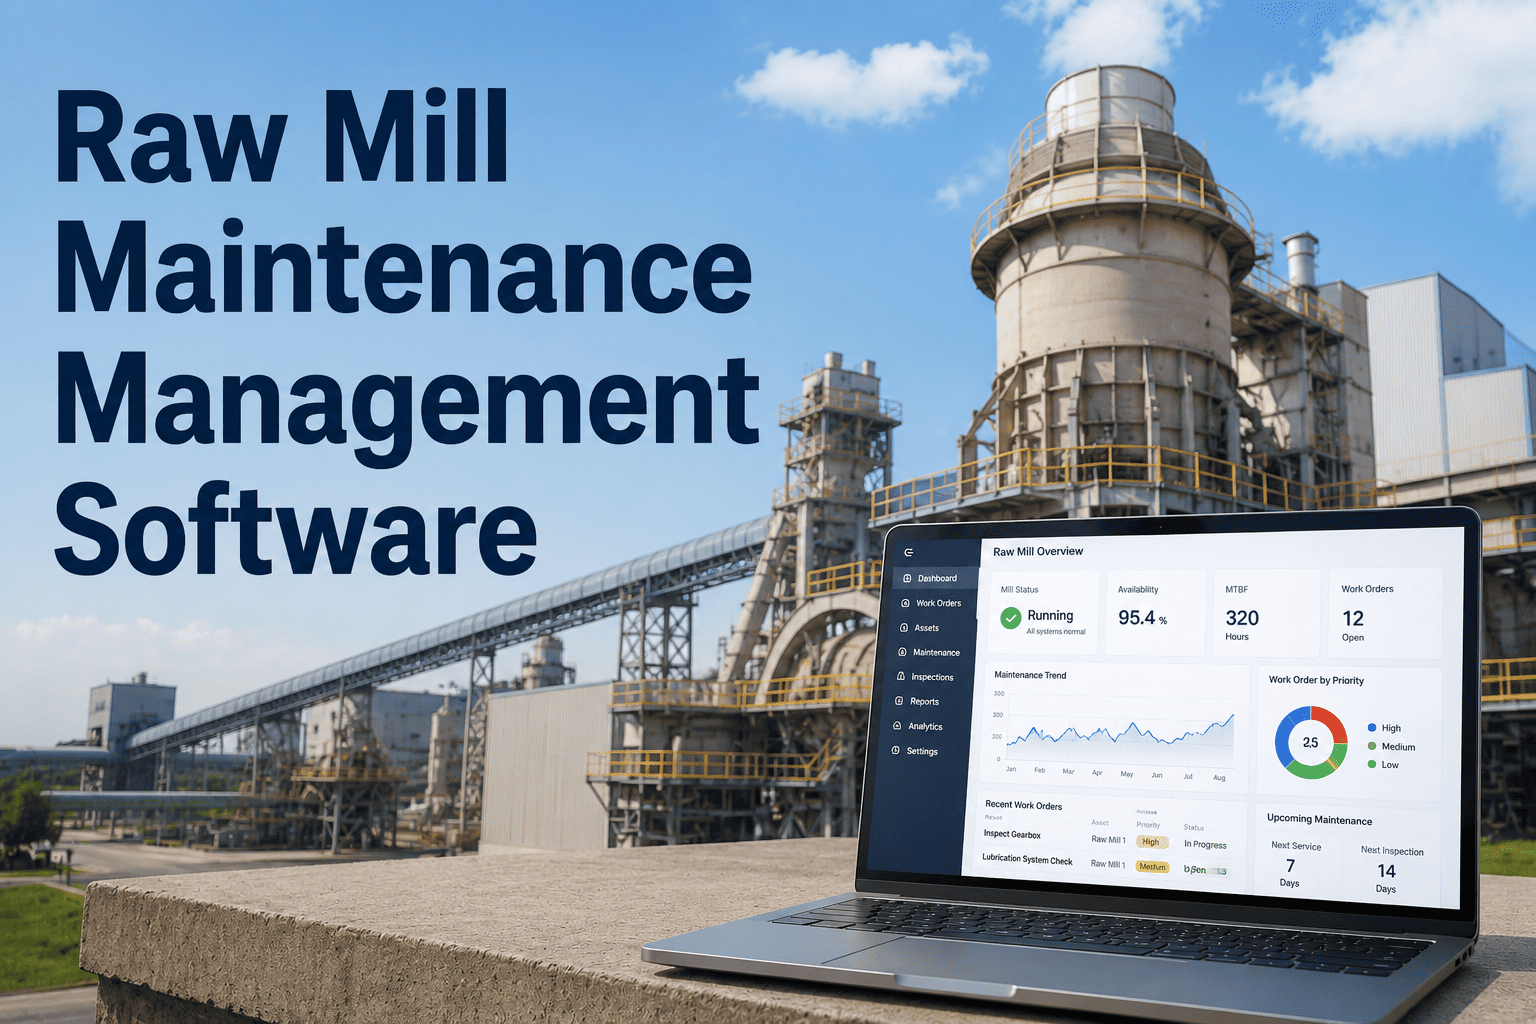
Raw mill performance determines your cement quality. When particle size varies, moisture fluctuates, or grinding efficiency drops—your entire production line suffers. Predictive Cp/Cpk monitoring transforms reactive maintenance into proactive quality control, catching process drift before it becomes costly downtime. With raw mills running 24/7 and processing thousands of tons daily, even small variations compound into major quality issues. Traditional monitoring misses the early warning signs. AI-powered SPC detects capability shifts in real-time—giving you hours of advance notice instead of surprise failures. --Schedule a personalized demo
Why Raw Mills Need Predictive Monitoring
Raw mills are the heartbeat of cement production—and when they fail, everything stops. Here's why traditional monitoring falls short.
Your raw mill operates under relentless conditions: abrasive materials grinding 24/7, constantly shifting feed compositions, and temperatures that swing with kiln exhaust fluctuations. Every hour of unplanned downtime costs upwards of $100,000 in lost production, emergency repairs, and quality rejections downstream.
Traditional SPC methods—hourly lab samples, daily reports, reactive maintenance—simply cannot keep pace. By the time a quality deviation shows up in lab results, thousands of tons of off-spec material may have already passed through. Predictive Cp/Cpk monitoring changes the equation entirely by detecting capability drift in real-time, before defects occur.
Variable Raw Materials
Limestone moisture can swing 3-8% between deliveries. Clay silica content varies by quarry zone. These fluctuations hit your mill every hour—and traditional monitoring only catches them after the damage is done.
Invisible Wear Progression
Grinding media loses 0.1-0.3% mass daily. Liner wear is gradual but relentless. By the time visual inspection reveals the problem, your Cpk has been drifting for weeks—silently producing inconsistent output.
Thermal Instability
Kiln exhaust gas temperatures fluctuate 50-100°C throughout the day, directly impacting drying efficiency and particle size distribution. Without real-time correlation, these variations go undetected until quality suffers.
Detection Delay = Production Loss
Lab sample turnaround takes 1-4 hours. In that window, your raw mill processes 200-500 tons of material. Late detection means late correction—and costly rework or rejected batches.
Don't wait for the next quality crisis. Start your free trial and see your raw mill's real-time Cpk within minutes.
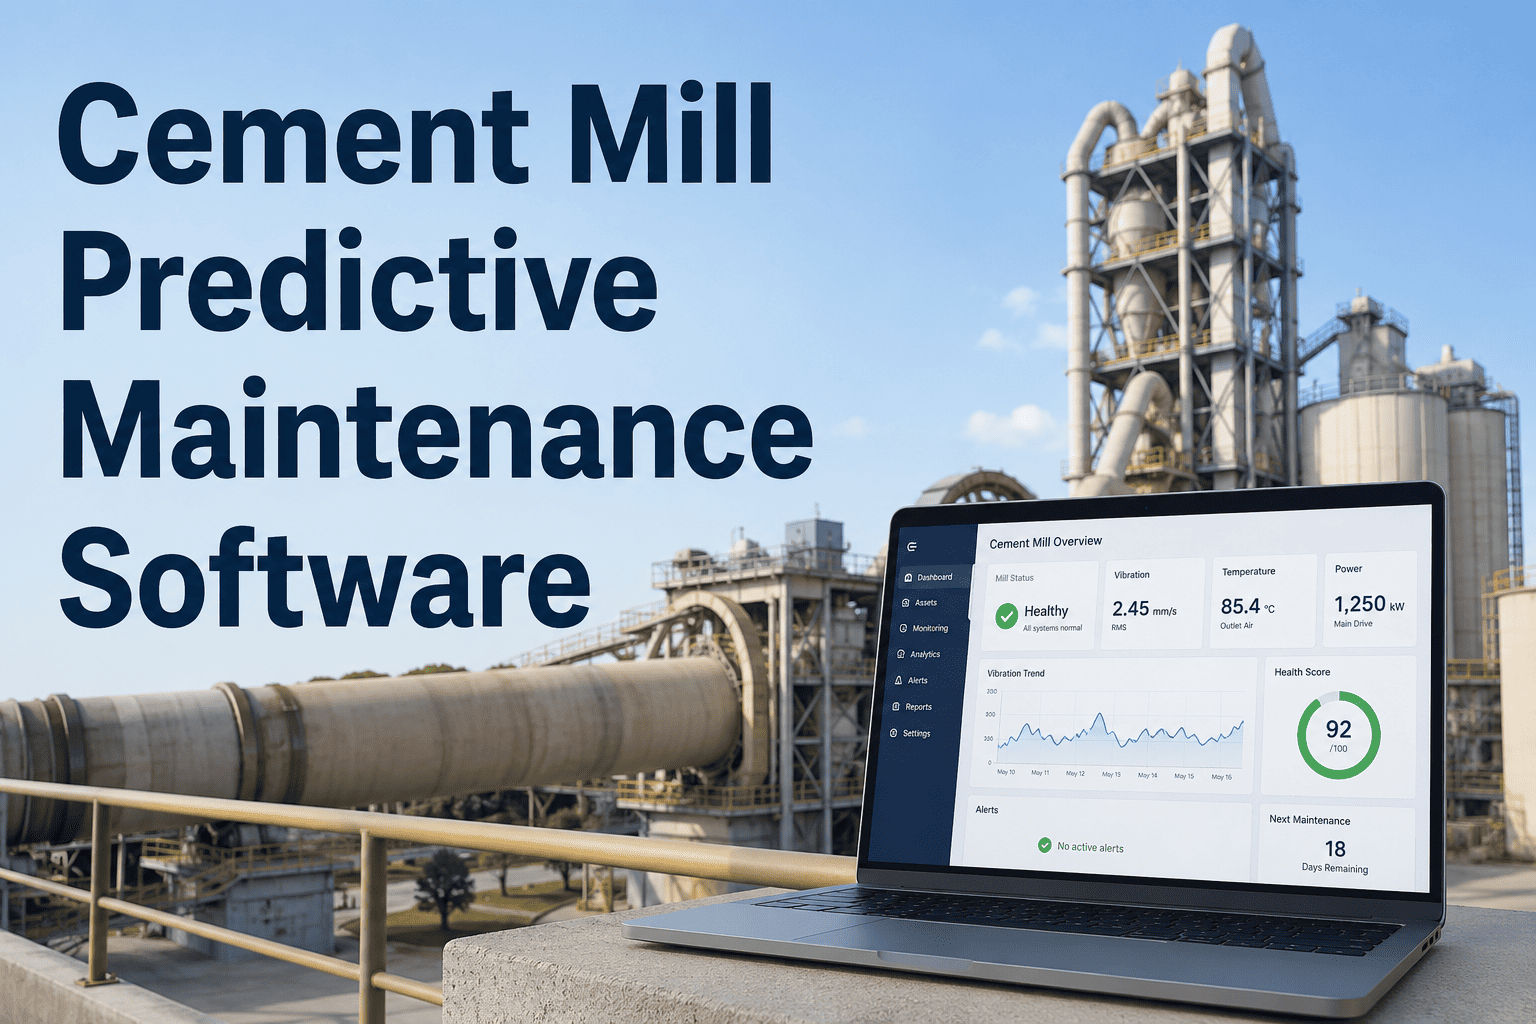
What is Cp/Cpk Monitoring?
Process capability indices measure how well your raw mill output fits within specification limits—the foundation of statistical process control.
Not Capable
Process cannot meet specifications consistently. Immediate action required.
Barely Capable
Marginal performance—process needs improvement to ensure consistent quality.
Capable
Industry standard target. Process reliably meets specifications.
World Class
Excellent process control with minimal variation. Best-in-class performance.
Want to see where your raw mill stands on the Cpk scale? Start your free trial and get instant process capability insights.
What Causes Cpk Drift in Raw Mills
Variable Raw Materials
Limestone, clay, and silica arrive with inconsistent moisture and composition—causing grinding efficiency to fluctuate hourly.
Wear Progression
Grinding media and liners degrade gradually, shifting Cpk values before visible damage appears.
Thermal Variations
Temperature changes from kiln exhaust gases affect drying efficiency and particle size distribution.
Late Detection
Traditional methods detect problems after quality defects occur—too late to prevent waste.
Stop losing money to preventable quality issues. Schedule a demo to see how predictive monitoring catches drift before it costs you.
Predictive Cp/Cpk in Action
Continuous Sampling
Sensors capture particle size, moisture, and throughput data every second
SPC Analysis
AI calculates Cp/Cpk in real-time, detecting capability drift instantly
Predictive Alerts
System warns of declining capability hours before failure occurs
Auto Work Orders
OxMaint generates maintenance tickets with root cause analysis
Traditional vs Predictive Monitoring
What We Monitor in Raw Mills
Particle Size Distribution
Target: 90% passing 90μm with Cpk goal of ≥1.33 for consistent grinding output.
Moisture Content
Target: <1% residual moisture with Cpk goal of ≥1.50 for optimal drying efficiency.
Feed Rate Consistency
Target: ±5% variation with Cpk goal of ≥1.67 for stable throughput control.
Chemical Composition
Target: LSF 92-96% with Cpk goal of ≥1.33 for consistent clinker reactivity.
Proven Impact on Cement Operations
Plants implementing predictive Cp/Cpk monitoring report significant improvements in quality consistency and equipment reliability.
Measurable improvements with predictive SPC
Connected Quality & Maintenance
Cpk Drift Detected
System identifies capability trending below 1.33 threshold with real-time alerts.
Root Cause Analysis
AI correlates drift with wear patterns, material changes, and environmental factors.
Work Order Created
Automatic maintenance ticket generation with priority level and all relevant data.
Continuous Learning
Model improves prediction accuracy over time through machine learning optimization.
Connect SPC monitoring with your CMMS. Book a consultation to see how it works.
Predict Quality Issues Before They Cost You
Transform your raw mill operations with AI-powered Cp/Cpk monitoring that catches capability drift hours before failures occur.
No credit card required • Setup in under 30 minutes • See results in days
Frequently Asked Questions
What is the difference between Cp and Cpk in raw mill monitoring?
Cp measures potential capability—how well the process spread fits within specification limits, assuming perfect centering. Cpk measures actual capability—accounting for how centered the process is. A high Cp with low Cpk indicates a centering problem that predictive monitoring can detect and correct.
How does predictive Cp/Cpk monitoring prevent raw mill failures?
OxMaint's system continuously calculates capability indices and uses trend analysis to detect gradual drift. When Cpk trends downward—indicating wear, material changes, or calibration drift—the system alerts maintenance teams hours before the process becomes incapable, enabling proactive intervention.
What Cpk value should a raw mill maintain?
Industry standards recommend Cpk ≥1.33 for capable processes and Cpk ≥1.67 for critical parameters. World-class cement plants target Cpk ≥2.0. OxMaint helps you establish baselines, set appropriate targets, and maintain consistent capability through predictive maintenance.
Can this integrate with existing cement plant control systems?
Yes. OxMaint integrates with DCS, SCADA, and existing quality management systems. The platform collects data from your existing sensors, applies SPC analytics, and connects insights directly to your CMMS for automated work order generation.
How quickly can I get started with OxMaint?
Most cement plants are up and running within 2-4 weeks. Start your free trial today to explore the platform, or schedule a demo to get a customized walkthrough with our implementation team who specialize in cement industry deployments.