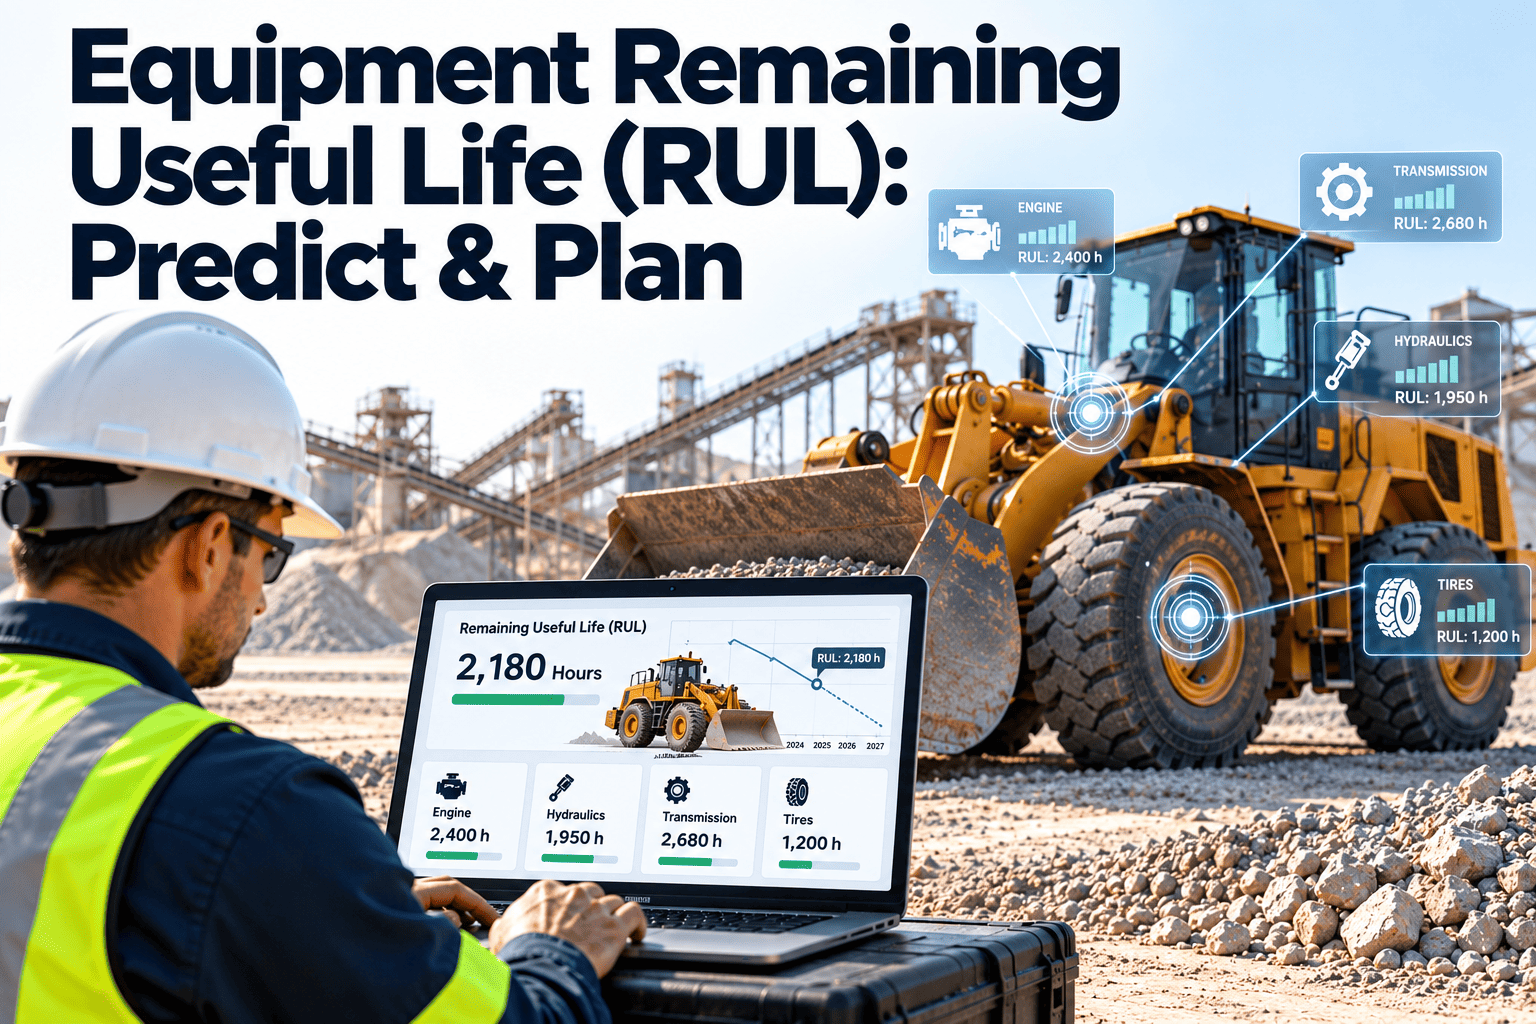
Most facility asset plans still run on age: a chiller is due for replacement at twenty years, an air handler at fifteen. Age is easy to track, but two identical units can reach the same birthday in very different condition. Remaining useful life, or RUL, estimates how much service an asset has left before it can no longer perform its function to an acceptable standard. A good RUL estimate moves planning from reaction to preparation, giving capital teams time to budget and maintenance teams time to intervene. This guide covers the main prediction models, the data each needs, and how a maintenance management platform supplies it.
Equipment Remaining Useful Life (RUL): Predict and Plan
Replace age-based guesses with evidence-based forecasts. See how statistical, machine learning and hybrid RUL models work, what data they need, and how to turn a prediction into a planning decision.
Three Ways to Think About Asset Life
Teams often use these ideas interchangeably. They answer different questions, and RUL only makes sense once the difference is clear.
Design or rated life
Current condition
Remaining useful life
RUL Prediction Models: Statistical, Machine Learning and Hybrid
No single model suits every facility asset. The right choice depends on how much failure history you have, whether condition data is available, and how costly a wrong forecast would be.
| Model Family | How It Works | Data Needed | Strengths | Limits |
|---|---|---|---|---|
| Statistical and reliability | Fits failure-time distributions such as Weibull to historical lives, or extrapolates a degradation trend to a threshold | Install dates, failure and replacement dates, or periodic readings | Transparent, works with modest data, easy to explain to finance | Treats similar assets alike and reacts slowly to changing conditions |
| Machine learning | Learns the relationship between sensor features or condition history and time to failure | Large volumes of labeled data covering full run-to-failure cycles | Captures complex patterns and adapts to each asset | Needs a lot of data, can be hard to explain, and can mislead outside its training range |
| Hybrid or physics-informed | Combines an engineering degradation model with data to update the estimate as readings arrive | Engineering knowledge plus moderate condition data | Credible with limited failures and easier to trust and audit | Takes engineering effort to build for each asset class |
The Data Maturity Ladder for RUL
You do not need continuous sensors to start. Each step on the ladder unlocks a more capable model, and most facilities can begin at the first or second step using records they already hold.
Clean asset register
Structured failure and repair history
Periodic condition readings
Continuous monitoring data
Read RUL as a Range, Not a Single Date
An estimate that says "14 months" hides uncertainty. A useful forecast gives a window and a confidence level, so planners can choose how cautious to be for each asset.
From Prediction to Action: Planning Windows
A forecast has value only when it changes a decision. The table links the remaining life estimate to the work that should happen at each stage. Treat the windows as examples and adjust them to the lead time of each asset.
| Estimated RUL | Planning Stage | Typical Actions | Owner |
|---|---|---|---|
| More than 24 months | Monitor | Keep the asset in the capital forecast, continue PM and readings | Maintenance planner |
| 12 to 24 months | Budget | Run repair or replace analysis, request capital funding, define scope | Facility manager |
| 6 to 12 months | Procure | Confirm specification, order long-lead equipment, plan the outage window | Engineering and procurement |
| Under 6 months | Mitigate | Install or approve a replacement date, set up spares and a contingency plan, increase checks | Facility manager and operations |
Signals That Feed RUL by Asset Class
Each type of equipment degrades differently, so the useful inputs differ. Start with the signals your team can already collect reliably.
| Asset | Degradation Signals | Typical Failure Drivers |
|---|---|---|
| Chillers | Approach temperature, power per unit of cooling, oil and refrigerant condition, tube fouling checks | Compressor wear, heat exchanger fouling, refrigerant and oil contamination |
| Boilers | Combustion readings, stack temperature, water chemistry, tube and burner inspections | Scale, corrosion, burner and control wear |
| Air handlers and fans | Motor current, vibration, belt and bearing condition, filter pressure drop | Bearing wear, misalignment, imbalance, belt failure |
| Pumps and motors | Vibration, temperature, current draw, seal leakage | Bearing and seal wear, cavitation, insulation breakdown |
| Elevators and lifts | Door and ride faults, call-back history, wear measurements, trip counts | Door system and control wear, rope and sheave wear |
| Transformers and switchgear | Thermal imaging, dissolved gas and oil tests, load history, partial discharge checks | Insulation aging, overheating, moisture ingress |
Build the Data Foundation That RUL Depends On
A Simple Trend Example: Fan Bearing Vibration
Trend extrapolation is the easiest RUL method to understand, and it works with periodic readings. Record each reading with the same instrument, location and operating condition, because a change in method can look like a change in health. Review the slope after every reading and flag any month where the rate of change shifts noticeably. The numbers below are illustrative, not guidance for any specific machine.
| Item | Value | How It Is Used |
|---|---|---|
| Monthly vibration readings | 2.8, 3.2, 3.6, 4.0 mm/s | Recorded on the same point with the same method each month |
| Observed rate of change | 0.4 mm/s per month | Slope of the recent readings |
| Alarm limit for this asset | 7.2 mm/s | Defined with engineering and the equipment manufacturer |
| Expected RUL to the limit | (7.2 minus 4.0) divided by 0.4, which is 8 months | Central estimate for scheduling |
| If degradation speeds up to 0.6 mm/s per month | About 5.3 months | Conservative end of the range |
| If degradation slows to 0.3 mm/s per month | About 10.7 months | Optimistic end of the range |
Where RUL Estimates Change Real Decisions
A forecast earns its keep when it feeds a specific process. These are the decisions that benefit most in a commercial facility portfolio. In each case the aim is the same: more time to choose, and less pressure to act after something has already failed.
Capital planning
Spare parts and lead times
Maintenance interval tuning
Who Owns the RUL Forecast?
A forecast without an owner becomes a chart nobody opens. Assign roles so each prediction leads to a recorded decision.
Reliability or maintenance engineer
Maintenance planner
Facility manager
Finance and capital committee
Reactive Planning Versus RUL-Driven Planning
The difference shows up in how far ahead the team can see and how much choice it still has when a decision is needed.
Age-based and reactive
- Replacement years come from a standard table
- Failures arrive without warning and drive emergency purchases
- Healthy assets may be replaced early and weak ones too late
- Capital requests are rushed and hard to defend
- Maintenance effort is spread evenly regardless of condition
RUL-driven and proactive
- Replacement timing reflects measured condition and trend
- Risk is visible months ahead of a likely failure
- Capital is directed to assets that need it first
- Requests include evidence and a forecast range
- Maintenance effort shifts toward assets with the least life left
Validating an RUL Model Before You Trust It
A model that has never been tested against real outcomes is only an opinion. Build a simple validation habit so confidence is earned.
A 90-Day Starting Plan for Facility RUL
Start small, prove value on a few critical asset classes, then extend. The plan below avoids large upfront investment and keeps engineering effort focused.
Pitfalls That Undermine RUL Predictions
Most weak forecasts fail because of data and process problems, not mathematics. Review these before investing in a more advanced model. Fixing the basics usually improves accuracy more than switching to a more complex algorithm, and it costs far less. A short data quality review of your top critical assets is often the most valuable first step.
- Failure causes recorded as "repaired" with no component or reason
- Assets replaced before failure counted as if they had failed
- Duplicate or renamed asset IDs breaking the history
- Readings taken at irregular intervals or by different methods
- Training a model on too few run-to-failure examples
- Ignoring changes in duty, load or operating hours
- Treating a single number as certain
- Letting forecasts sit in a report with no assigned owner
- Skipping engineering review of surprising results
- Never comparing forecasts with real outcomes
How Oxmaint Supports RUL and Condition-Based Planning
Oxmaint does not replace engineering judgment or specialist analytics. It gives facility teams the organized records and workflows that make any RUL approach practical.
Asset management
Work orders and failure history
Inspections and condition readings
Dashboards and reporting
Questions to Ask Before Buying a Predictive Tool
Many vendors promise accurate life predictions. Use the questions below to separate evidence from marketing and to confirm the tool fits your data and your team.
- Which asset types has it been validated on, and how?
- What data does it need, and can we supply it today?
- Does it give a range and a confidence level or a single date?
- Can an engineer see why it produced a given forecast?
- How does it handle assets with very few recorded failures?
- How are forecasts connected to work orders and planning?
- Who owns the data and can we export it freely?
- What happens to accuracy when equipment or duty changes?