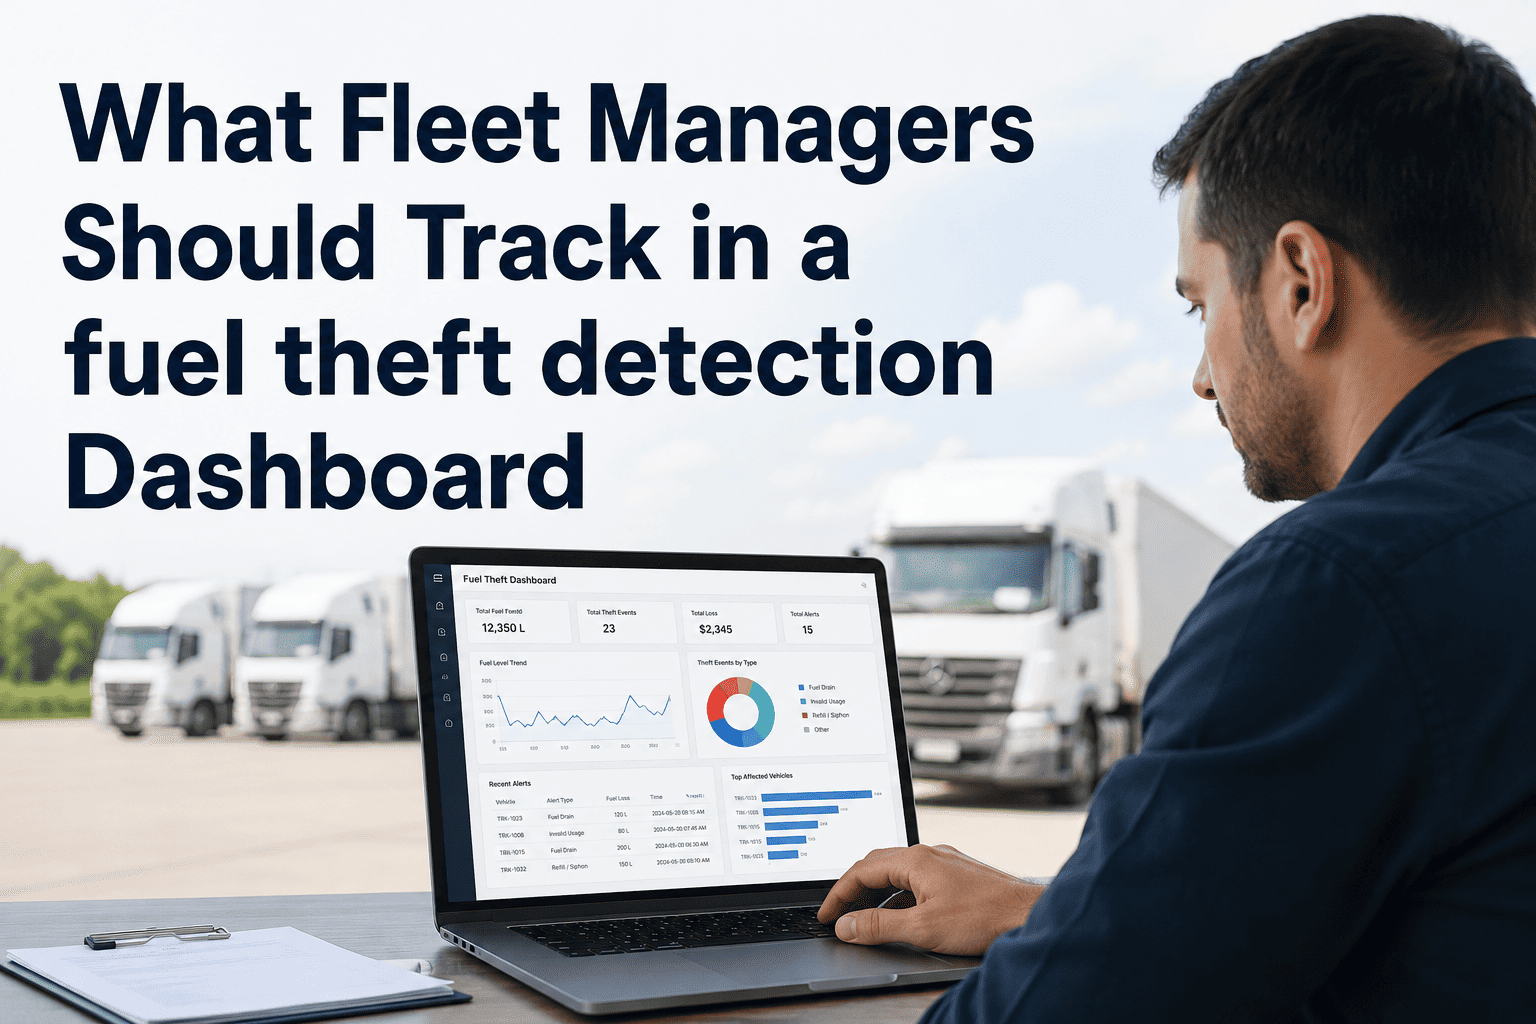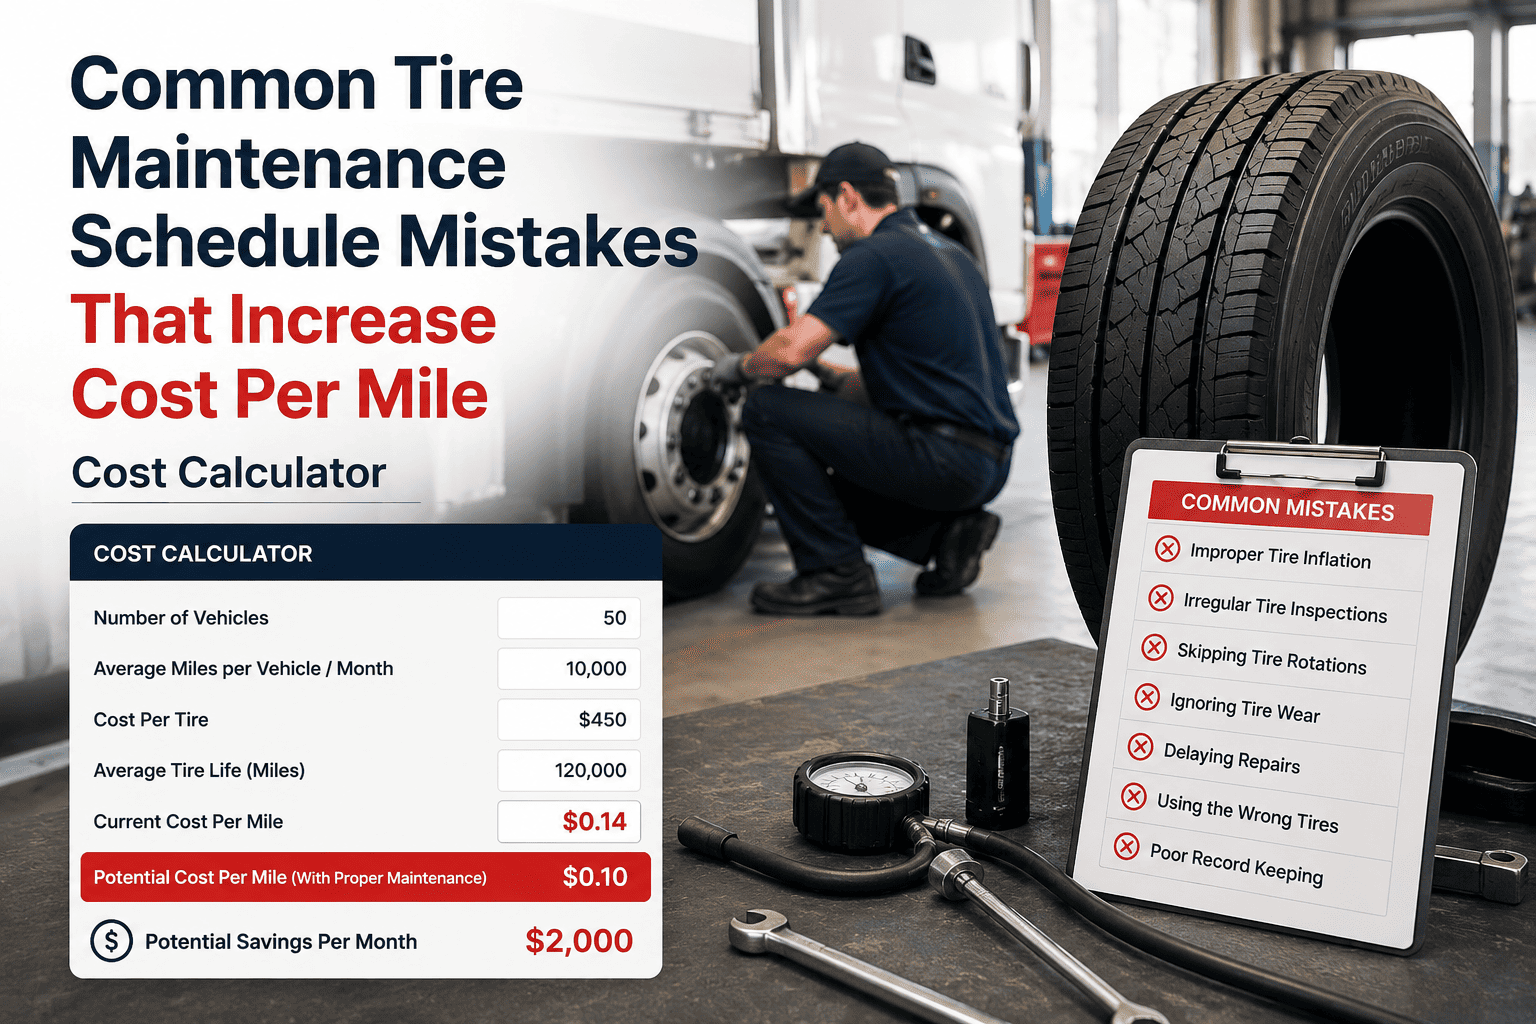
Most fleet managers know tires are expensive — but few can pinpoint exactly how much bad tire habits are costing them per mile. Underinflation, missed rotations, wrong tire specs for the route, and delayed replacements all silently inflate your cost per mile figure without appearing on any single invoice. The damage compounds across hundreds of tires and thousands of miles until the number becomes impossible to ignore. Fleets that track tire cost per mile through a CMMS like Oxmaint consistently find they were spending 20–30% more per tire than necessary. Use the calculator below to estimate what common tire maintenance mistakes are costing your fleet — then book a demo to see how to fix them.
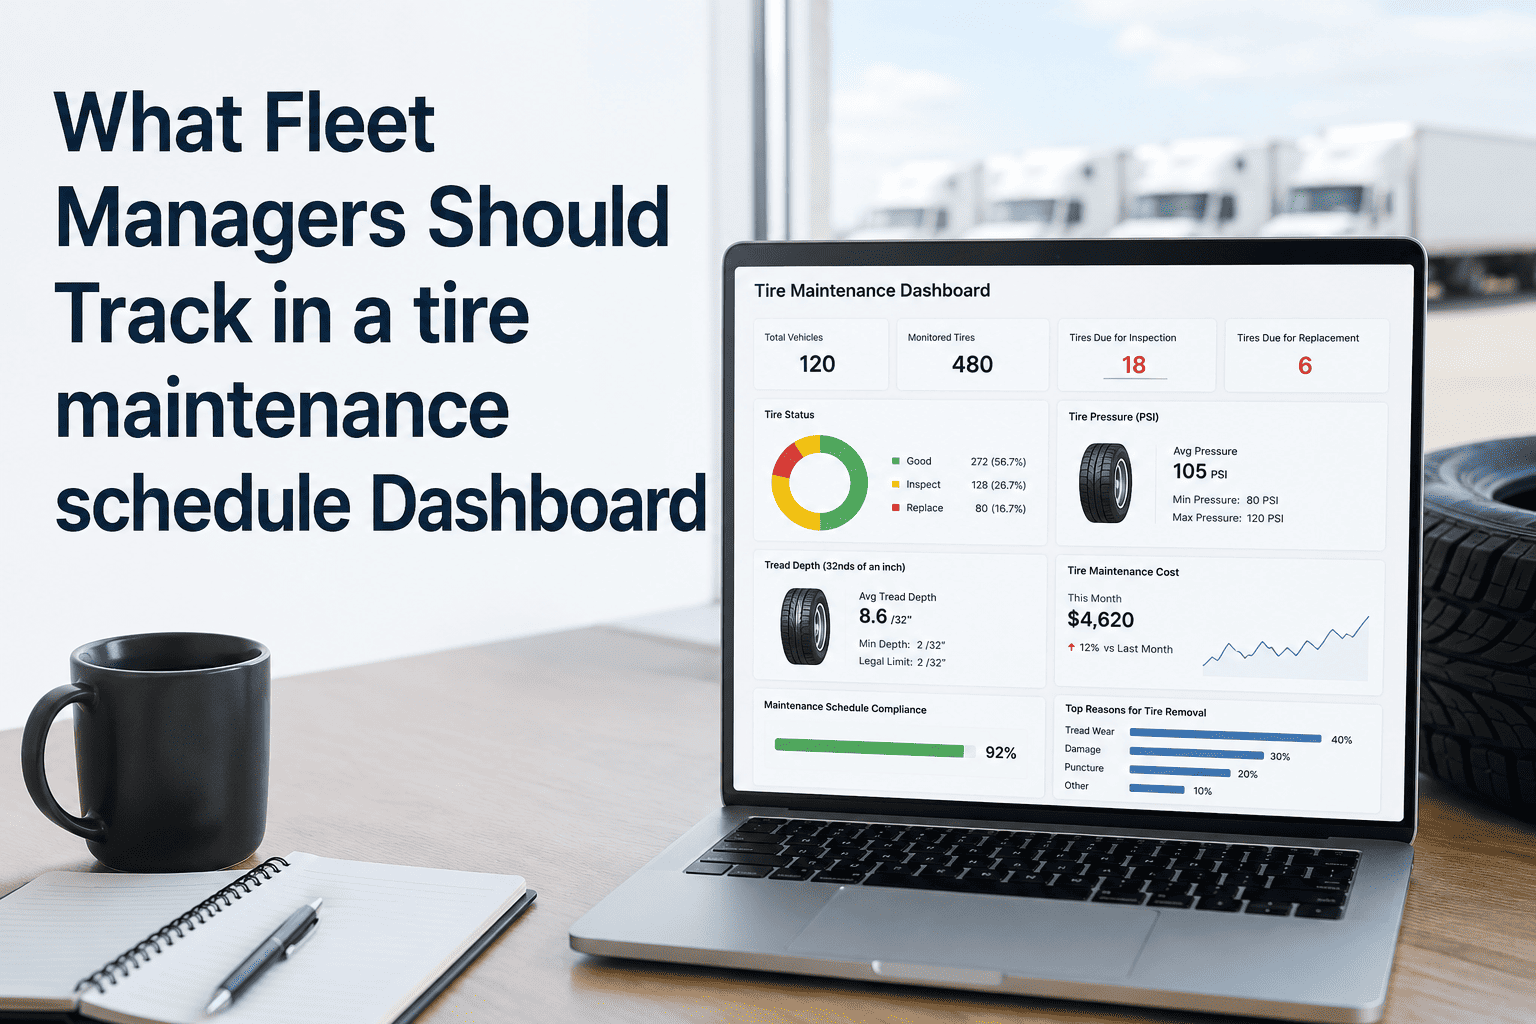
Common Tire Maintenance Mistakes That Increase Cost Per Mile
Calculate what your tire mistakes are really costing — then learn the fixes that bring cost per mile down by 20% or more.
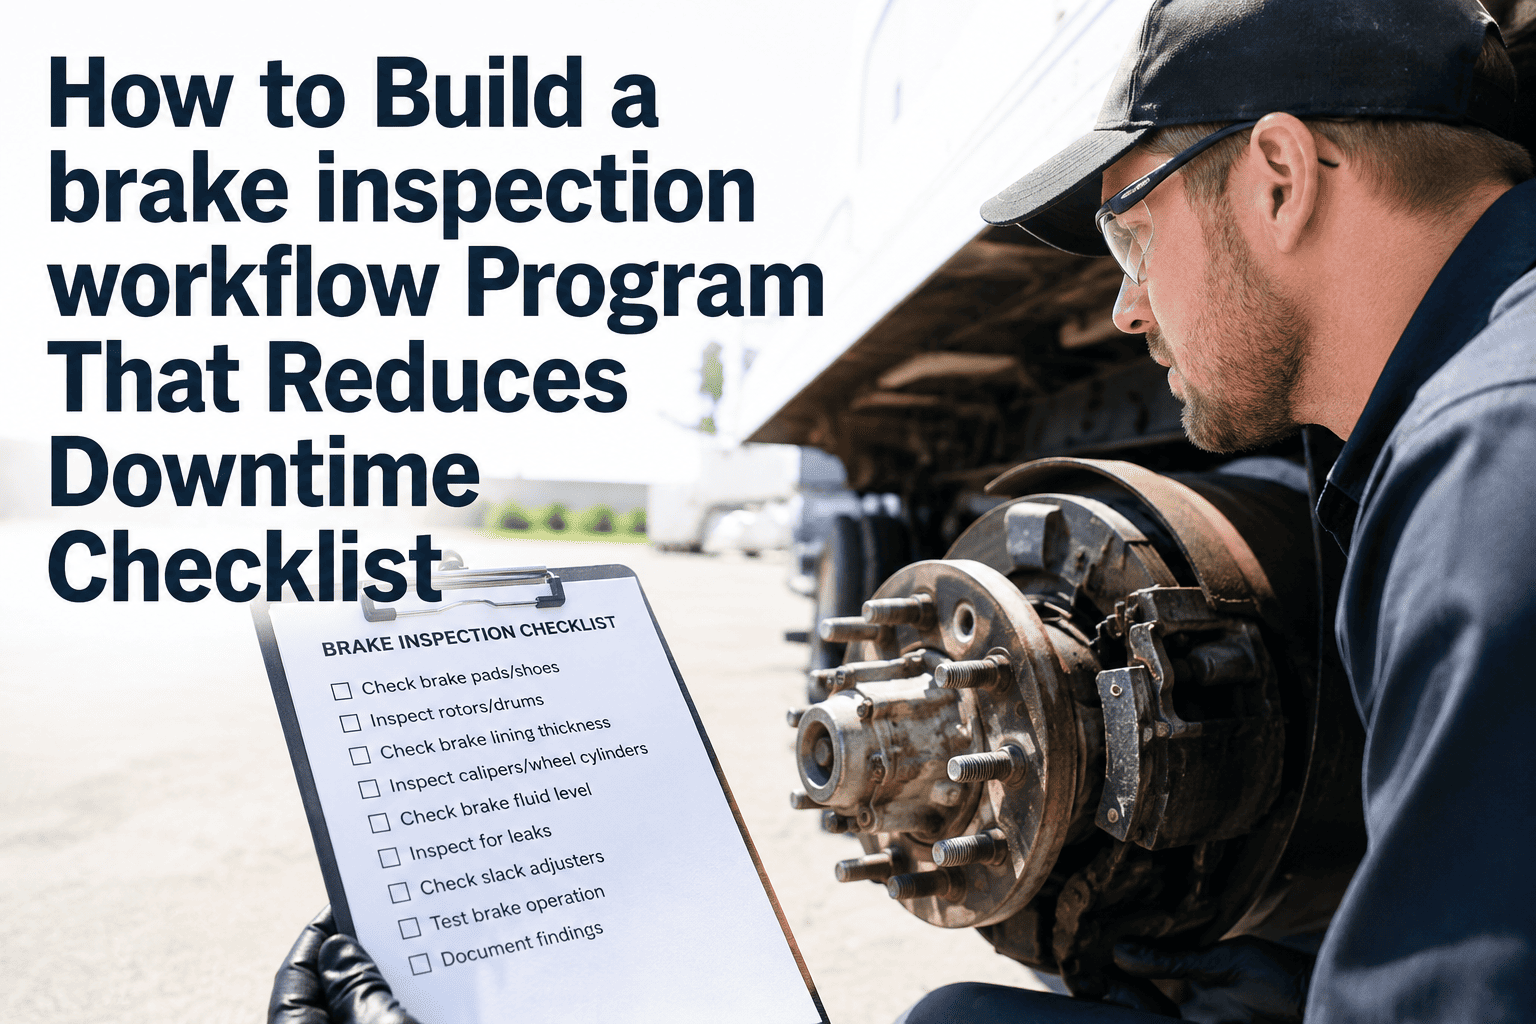
7 Tire Maintenance Mistakes Costing Fleets the Most Money
These are not hypothetical risks — they are the mistakes fleet managers across North America report as their biggest tire cost drivers. Each one is preventable with the right system.
10 PSI below spec increases tire wear by 15% and fuel consumption by up to 3%. Across a 100-vehicle fleet, this compounds into tens of thousands of dollars in avoidable spend annually.
Daily pre-trip pressure checks logged in a mobile CMMS, with automatic alerts when variance exceeds 8 PSI from spec.
Uneven wear from missed rotations reduces tire life by 20–40%. Front tires wear faster on steer-heavy routes — without rotation, you replace them twice as often as rear positions.
Mileage-based rotation work orders triggered automatically from telematics data — no manual tracking or calendar reminders required.
Without accurate tread depth records, technicians and drivers call replacements conservatively. Tires with 5–6/32" remaining are pulled when they could safely run to 4/32". This is pure waste.
Per-position tread depth logs on every inspection, stored in the vehicle's maintenance history, so replacement decisions are data-backed not guesswork.
Using highway tires on mixed-surface routes or vice versa cuts expected tire life by 30–50%. Many fleets never analyze tire brand performance by route type, leaving easy savings on the table.
Track tire brand, spec, and achieved mileage by route segment in your CMMS. Route-match tire specs using actual wear data, not vendor recommendations alone.
Cupping, feathering, and edge wear signal underlying suspension or alignment problems. Fixing tires without addressing the root cause means the next set wears out just as fast — often faster.
Log wear pattern type on every tire removal. Auto-trigger alignment and suspension inspection work orders when irregular wear patterns repeat on the same vehicle.
Tires degrade chemically after 6 years regardless of tread depth. Keeping aged tires in service to avoid replacement cost is a liability risk — and an insurance and DOT compliance issue.
Record DOT week codes at installation. Configure automated alerts for tires approaching the 6-year threshold, giving you lead time to budget replacements without emergency purchases.
Buying cheaper tires feels like saving money — until you calculate they lasted 35,000 miles instead of 60,000. Without cost-per-mile data by brand, procurement decisions are based on price tags, not value.
Track tire brand, purchase cost, install date, and final mileage in every work order. Generate cost-per-mile reports by brand to inform supplier negotiations with hard data.
Oxmaint automates rotation triggers, pressure alerts, wear logging, and brand performance tracking — the exact fixes for every mistake listed above. Most fleets see measurable cost reduction within 60 days.
The Real Cost of Tire Mistakes at Scale
| Mistake | Cost Driver | Annual Waste (50 Vehicles) | Fix Complexity |
|---|---|---|---|
| Underinflation | Increased wear + fuel loss | $4,000 – $11,000 | Low — daily digital inspection |
| Missed rotations | Accelerated uneven wear | $6,000 – $15,000 | Low — mileage-based auto trigger |
| Early replacement | Usable tire life wasted | $3,000 – $9,000 | Low — tread depth logging |
| Wrong tire spec | Shortened service life | $4,500 – $10,000 | Medium — route performance analysis |
| No brand cost tracking | Poor procurement decisions | $7,500 – $20,000 | Low — CMMS work order data |
Frequently Asked Questions
What is a good cost per mile for commercial fleet tires?
How much can I realistically save by fixing tire maintenance practices?
Does a CMMS track tires differently than regular maintenance items?
Can I use the calculator results to justify a CMMS investment to management?
What is the fastest tire maintenance improvement a fleet can make?
Tire waste is one of the most controllable costs in fleet management — but only if you have the right system tracking it. Oxmaint gives you automated rotation scheduling, pressure alert workflows, per-tire cost tracking, and brand performance reports all in one platform.