Tire failures account for nearly 35% of all roadside breakdowns in commercial fleets — yet most fleet managers still track tires through spreadsheets or gut instinct. A purpose-built tire maintenance schedule dashboard changes that by giving you real-time visibility into tread depth, rotation schedules, pressure variance, and cost per tire across every vehicle in your fleet. When every tire data point lives in one place, you stop reacting to blowouts and start preventing them. Platforms like Oxmaint's fleet CMMS centralize tire tracking alongside full vehicle maintenance history, so nothing slips through the cracks. Ready to take control of your tire program? Book a free demo and see how it works for your fleet.
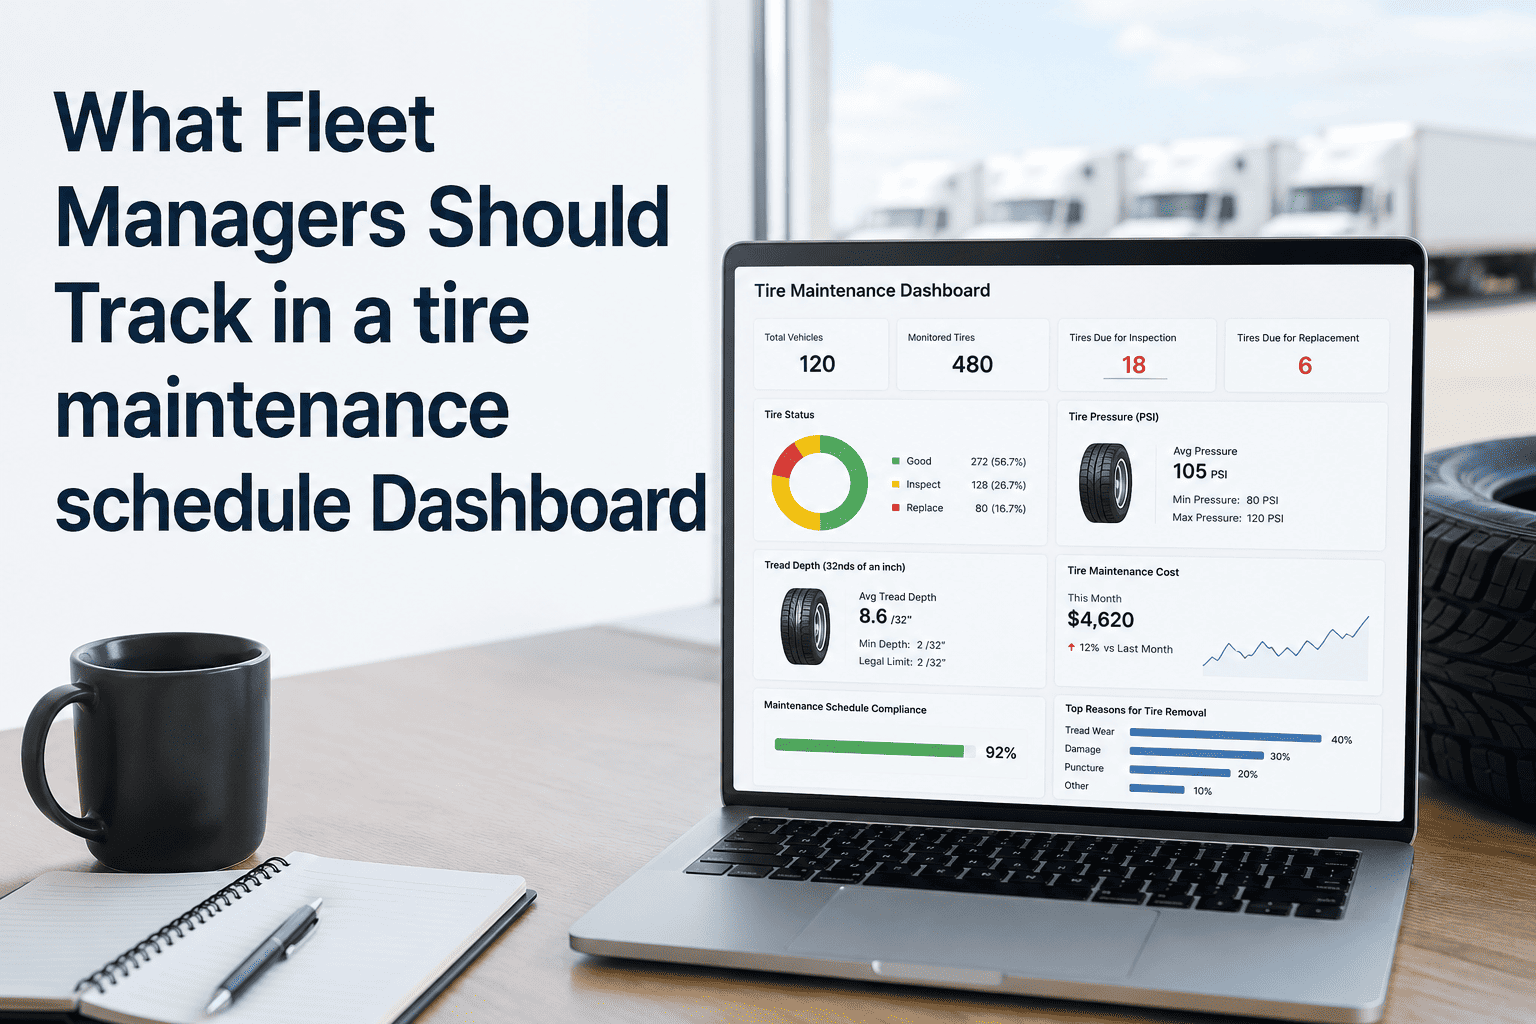
What Fleet Managers Should Track in a Tire Maintenance Schedule Dashboard
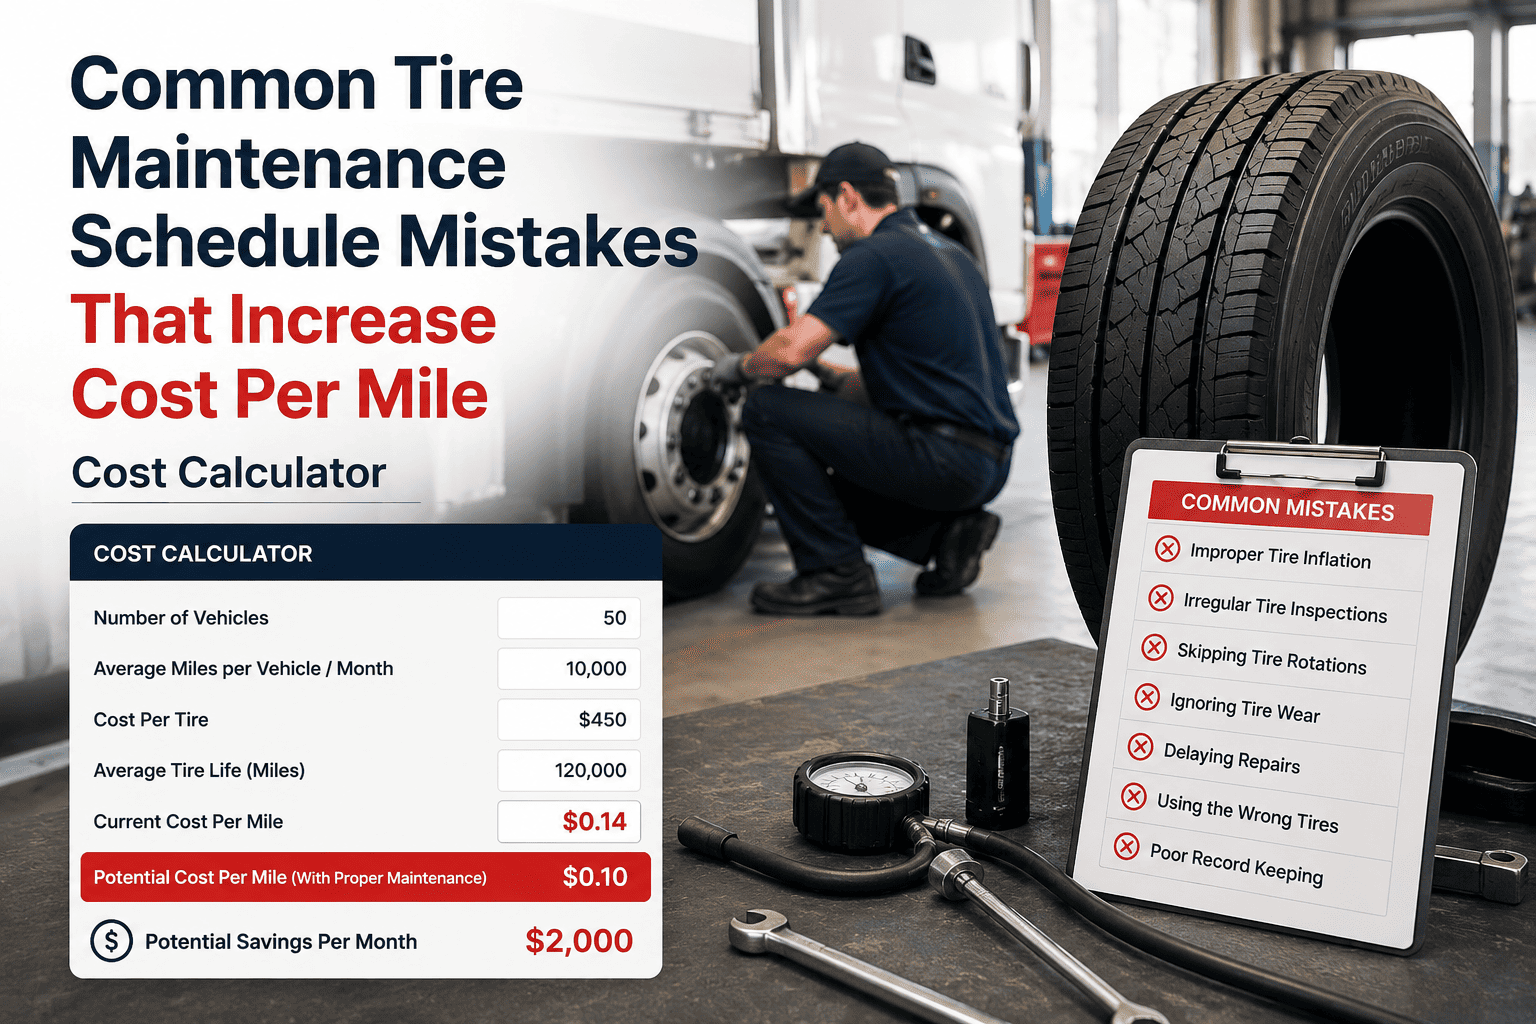
Stop guessing. Start tracking. Here is every metric, alert, and workflow your tire dashboard needs to reduce costs and keep vehicles moving.
The 6 Core Metrics Every Tire Dashboard Must Show
A tire dashboard is only as valuable as what it tracks. These six metrics form the foundation of a data-driven tire program — skip any one of them and you have blind spots that cost money.
Track current tread depth against legal minimum thresholds and replacement triggers for every tire on every axle. Flag tires approaching 4/32" well before DOT inspection catches them.
Pressure deviating by just 10 PSI below spec increases wear by 15% and cuts fuel efficiency. Your dashboard should show real-time PSI per position and flag outliers automatically.
Overdue rotations are silent tire killers. Track rotation status by mileage and date for each vehicle, with automated work orders generated when a vehicle hits the rotation threshold.
Tires degrade chemically over time regardless of tread depth. Any tire over 6 years old is a safety risk even if it looks fine. Your dashboard must surface age by DOT week code, not just visual inspection.
This is the number that ties tire decisions to finance. Track total spend per tire — purchase, repairs, retread — divided by miles driven to identify which brands and specs deliver best value across your routes.
Center wear means overinflation. Edge wear means underinflation. Cupping signals suspension problems. A dashboard that logs and categorizes wear patterns on removal catches root causes, not just symptoms.
Oxmaint's fleet CMMS gives you a live tire dashboard with automated alerts, rotation triggers, and cost tracking — no manual data entry required.
Tire Dashboard Workflow: From Inspection to Action
A great dashboard is not just a display — it is a trigger system. Here is how a modern tire management workflow should connect inspection data to action without manual follow-up.
Driver completes a digital DVIR on mobile, recording tire pressure and visible condition at each position. Any anomaly auto-creates a flagged alert in the dashboard.
The CMMS compares reported values against spec thresholds and generates a maintenance alert or work order, routed to the right technician based on priority.
Tech receives work order on mobile, performs the service, logs the tire position, action taken, and new readings. Parts usage is deducted from inventory automatically.
The tire dashboard reflects the completed service, resets the rotation counter, logs cost to the vehicle's lifecycle record, and schedules the next PM automatically.
Dashboard View: What Good Tire Data Looks Like
This is the kind of at-a-glance visibility fleet managers should have on their tire dashboard — status, alerts, and action items all in one view.
| Vehicle ID | Position | Tread Depth | PSI | Last Rotation | Status |
|---|---|---|---|---|---|
| TRK-041 | Front Left | 8/32" | 105 PSI | 7,200 mi ago | Good |
| TRK-019 | Rear Right | 3/32" | 98 PSI | 12,400 mi ago | Replace Soon |
| VAN-007 | Front Right | 6/32" | 88 PSI | 6,100 mi ago | Pressure Alert |
| TRK-033 | All Positions | 5/32" | 106 PSI | 8,050 mi ago | Rotate Due |
Tire Dashboard by Fleet Size: What to Prioritize
| Fleet Size | Top Dashboard Priority | Most Common Gap | Expected Saving |
|---|---|---|---|
| 10–30 Vehicles | Rotation compliance tracking | No alert system for overdue rotations | Up to $12K/year in early replacements |
| 30–100 Vehicles | Pressure monitoring and cost per mile | Manual pressure logs with no variance alerts | 8–15% fuel cost reduction |
| 100–300 Vehicles | Brand performance analysis by route | No link between tire spend and vehicle lifecycle data | 20–30% reduction in tire spend annually |
| 300+ Vehicles | Predictive wear modeling and supplier benchmarking | Siloed data across depots with no consolidated view | $100K+ annual savings at scale |
Frequently Asked Questions
What is the most important tire metric to track first?
Can a CMMS handle tire tracking or do I need a separate tool?
How do drivers submit tire condition data without paperwork?
How quickly can I see ROI from a tire tracking dashboard?
Does tire tracking integrate with telematics or GPS systems?
Every blowout, every premature replacement, every DOT violation linked to tires is preventable with the right dashboard in place. Oxmaint gives you the tire tracking, rotation automation, and cost visibility to run a proactive tire program — starting today.