Fuel theft is one of the most underreported losses in commercial fleet operations. According to NAFA, up to 6% of a fleet's total fuel cost disappears to theft and misallocation each year — and 73% of commercial fleets have already experienced it. The problem is rarely dramatic. It compounds quietly through buddy fueling, card fraud, after-hours siphoning, and manipulated logs until a quarterly fuel report finally shows a number nobody can explain. A fuel theft detection dashboard changes this from a monthly surprise into a daily operational control. Platforms like Oxmaint's fleet CMMS connect fuel data, telematics, and inspection records in one place — so managers can act in minutes, not months. If your fleet spends over $100,000 a year on fuel, book a demo to see exactly what you should be watching.
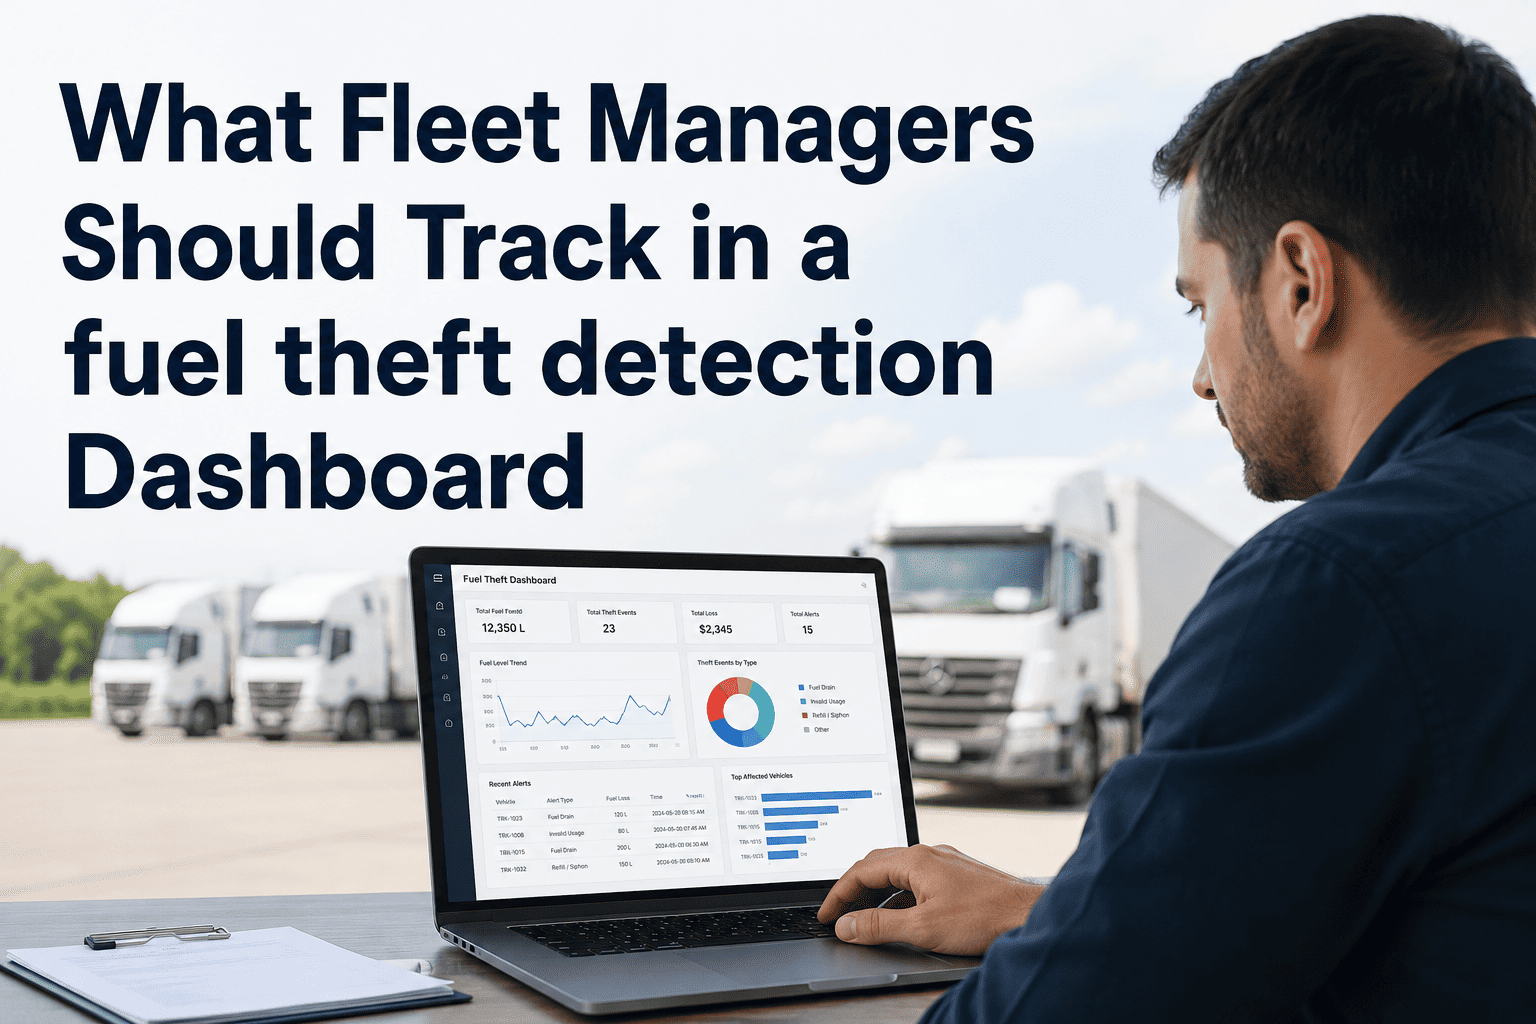
What Fleet Managers Should Track in a Fuel Theft Detection Dashboard
The exact metrics, alert types, and dashboard views that separate fleets losing 6-15% of fuel spend from those recovering it — backed by 2026 industry data.
Why Spreadsheets Hide What Dashboards Expose
Most fleet managers discover fuel theft the same way — a fuel budget that keeps missing despite no change in routes or vehicle count. Paper logs and monthly fuel card reports create a 30-day blind spot. By the time the anomaly is visible, the loss is already permanent. A real-time dashboard closes that gap by monitoring six interconnected data streams simultaneously. Missing even one creates exploitable gaps.
Tank levels drop overnight with no engine activity. Undetected without real-time sensor monitoring.
One driver fuels two vehicles — company and personal — on a single card transaction.
Fuel purchased at a location the vehicle never visited. GPS cross-reference exposes this instantly.
A 90-gallon tank charged for 130 gallons. Automated capacity checks flag this in seconds.
The 7 Metrics Every Fuel Theft Dashboard Must Track
Not all dashboard data is equal. These seven metrics form the detection layer that separates operational waste from deliberate theft — and most fleet software only covers two or three of them.
Every fuel card transaction should match what actually entered the tank. If a 100-gallon purchase shows up while tank sensors record only 60 gallons added, that 40-gallon gap is a live fraud signal — not a reporting lag. This is the single most powerful theft indicator available.
A transaction at a station in a different city than where the vehicle's GPS places it is an automatic red flag. Modern CMMS platforms cross-reference telematics coordinates with fuel card merchant locations for every single transaction, eliminating geographic fraud.
Every vehicle has a predictable fuel consumption profile for a given route type. When a truck burns 18% more than its route-adjusted benchmark with no change in load, weather, or traffic, that deviation triggers an investigation alert — not a month-end budget concern.
Fuel transactions occurring outside shift windows or on non-operational days are among the clearest theft signals in fleet data. A dashboard that time-stamps every transaction against the vehicle's operational schedule flags these automatically, with no manual audit required.
Each vehicle has a documented tank capacity. Any transaction recording a fill volume above that capacity is mathematically impossible — and therefore a direct indicator of fraud. This check should be automated and instant, triggering a manager notification before the transaction clears.
A diesel truck burns roughly 0.8 gallons per idle hour. For a 50-truck fleet idling two unnecessary hours daily, that exceeds 29,000 gallons per year in waste — over $60,000 at current diesel prices. An idle-time dashboard view shows which vehicles, which drivers, and which locations are driving this loss.
Aggregating fuel data by driver — not just by vehicle — reveals patterns invisible in vehicle-level reports. A driver who consistently ranks in the top 5% of fuel spend across different assigned vehicles is a behavioral signal worth investigating. This view directly supports accountability conversations with specific evidence.
Is your fleet losing $15,000–$45,000 a year to undetected fuel theft?
Oxmaint connects fuel card data, telematics, and tank sensors into one dashboard — with automated alerts for every metric above. Most fleets detect their first theft event within 30 days.
How a Smart Dashboard Escalates Alerts
Not every anomaly is a theft. Effective dashboards use a three-tier alert system that distinguishes between a mechanical variance worth noting, a suspicious pattern worth watching, and a confirmed fraud event requiring immediate action.
Consumption 5–10% above route benchmark. Could be load, weather, or driver behavior. Logged automatically, reviewed in weekly reporting. No immediate action required.
Consumption variance above 10%, repeated off-hour transactions, or same-day multi-fill events. Manager notified within 1 hour. Driver record reviewed before next shift.
Tank capacity exceeded, GPS-location mismatch confirmed, or tank level drop while vehicle is stationary and engine is off. Instant push notification to fleet manager with GPS coordinates and transaction record.
What to Prioritize by Fleet Size
Fuel theft risks and detection priorities shift with fleet scale. A 15-vehicle operation has different exposure than a 300-vehicle enterprise. Here is where to focus your dashboard first.
| Fleet Size | Highest Theft Risk | Top Dashboard Priority | Estimated Annual Loss Without Monitoring |
|---|---|---|---|
| 10–50 Vehicles | Card sharing, buddy fueling | Driver-level spend ranking, capacity checks | $8,000–$30,000 |
| 50–150 Vehicles | After-hours siphoning, internal fraud | After-hours alerts, GPS-location cross-reference | $30,000–$90,000 |
| 150–500 Vehicles | Systematic internal theft, depot fraud | Tank sensor integration, depot fill reconciliation | $90,000–$300,000 |
| 500+ Vehicles | All categories at scale, organized fraud | All 7 metrics with API-level telematics integration | $300,000+ |
What Changes When You Actually Track This
Frequently Asked Questions
Do I need tank sensors to use a fuel theft dashboard?
How quickly will a fuel dashboard start detecting theft?
What is the difference between fuel theft and fuel waste?
Can a fuel dashboard help with compliance reporting?
What is a realistic ROI timeline for fleet fuel monitoring?
Your Fuel Dashboard Is One Setup Away
Oxmaint brings together fuel card data, GPS telematics, tank-level sensors, and driver records in one connected dashboard. Set automated alerts for all 7 metrics above — and know about the next fuel theft event in minutes, not months. No heavy implementation. No dedicated data team required.