Fleet budgets fail for one consistent reason: they are built on last year's numbers plus a percentage increase, rather than on data-driven forecasts tied to actual asset conditions, age profiles, and utilization patterns. A 2024 NAFA study found that 58% of fleet managers exceed their annual maintenance budget by 15% or more — not because they are poor planners, but because their planning tools cannot connect vehicle age, condition, and historical cost data into a reliable forecast. The result is budget conversations with CFOs where fleet managers defend overruns instead of presenting data-driven projections. This fleet budget planning template provides the framework to forecast annual maintenance, fuel, insurance, depreciation, and staffing costs per vehicle and per fleet — with built-in cost trending that accounts for vehicle aging and historical spending patterns. Download it to build a credible budget, or deploy Oxmaint's fleet CMMS where budget forecasts update automatically as maintenance costs are recorded, giving you a living financial model that CFOs trust because it is based on real operational data. Book a demo or start a free trial to see data-driven fleet budgeting.
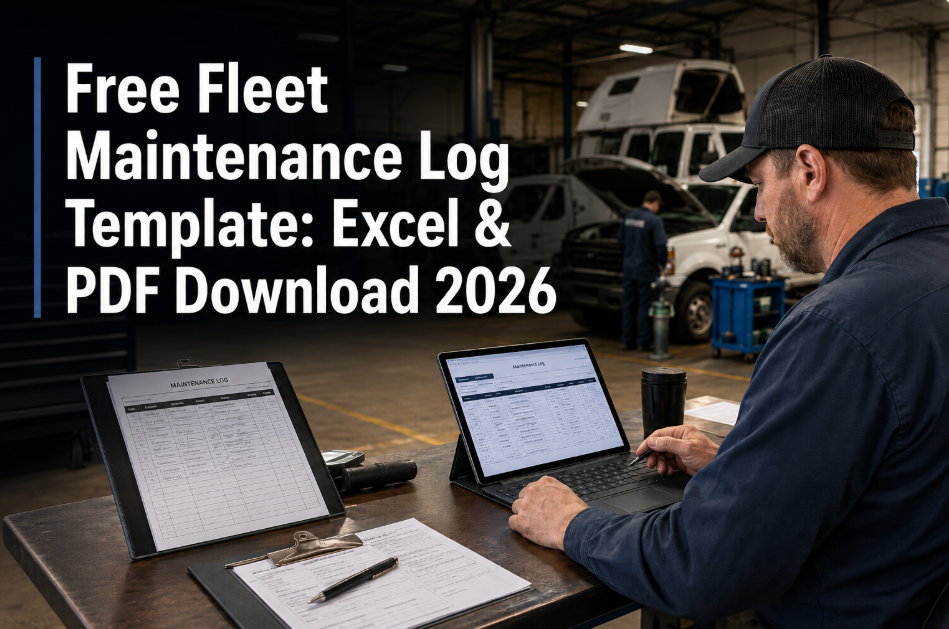
Fleet Budget Planning Template: Annual Maintenance and Operating Cost Forecast
Forecast annual maintenance, fuel, insurance, depreciation, licensing, and staffing costs per vehicle and per fleet. Excel format with built-in cost trending, variance tracking, and CFO-ready summary reports.
Build a Budget Your CFO Will Trust
Use the Excel template to structure your annual fleet budget with data-driven forecasts. For budgets that update automatically from actual maintenance spending, Oxmaint provides real-time budget-to-actual tracking that eliminates end-of-year surprises.
Budget Categories Covered in This Template
A complete fleet operating budget covers six major cost categories. This template provides forecasting models for each category at both the individual vehicle and fleet-wide level, with historical trending to improve accuracy year over year.
PM costs by vehicle class based on scheduled service intervals, historical parts costs, and labor rates. Accounts for aging vehicles requiring more frequent PM. Typically 35-45% of total maintenance budget for a well-managed fleet.
Repair budget based on historical breakdown rates, vehicle age, and mileage. Template applies aging multipliers — vehicles over 7 years typically require 2.4x the repair budget of vehicles under 3 years. Separating PM from repair budgets reveals fleet health trends.
Fuel budget by vehicle based on projected mileage, current MPG, and fuel price scenarios (low/mid/high). Includes fuel efficiency degradation factor for aging vehicles. Fuel typically represents 28-35% of total fleet operating cost.
Insurance premium allocation per vehicle, registration fees by state, IFTA and IRP fees for interstate vehicles, and Form 2290 heavy vehicle use tax. Fixed costs that are predictable but often overlooked in fleet budgets.
Annual depreciation per vehicle, cumulative book value, and replacement capital requirements. Links to lifecycle cost analysis — vehicles approaching replacement require capital budget allocation. Template flags vehicles reaching replacement thresholds.
Fleet management labor, technician staffing, shop overhead, tool and equipment costs, and facility costs allocated per vehicle. Often the most under-budgeted category. Template calculates cost per vehicle for accurate fleet-wide allocation.
Budget Forecasting Methodology
This template uses a three-factor forecasting model that combines historical spending, vehicle age adjustments, and fleet composition changes to produce forecasts that are 34% more accurate than flat-rate projection methods.
Three-year average spending per vehicle class provides the foundation. Template auto-calculates from prior year data entries. Smooths out single-year anomalies while reflecting real operational costs.
Applies aging multipliers based on industry maintenance cost curves. Vehicles in years 1-3 use baseline. Years 4-6 apply 1.3x multiplier. Years 7-10 apply 1.8x. Years 10+ apply 2.4x. Mileage-based adjustments overlay for high-use vehicles.
Adjusts forecast for planned acquisitions, disposals, and fleet mix changes. Adding 10 new vehicles reduces average age and expected maintenance cost. Holding aging vehicles increases it. Template recalculates as fleet changes are entered.
Monthly budget-to-actual comparison identifies forecast accuracy and spending trends. Positive variance (under budget) may indicate deferred maintenance. Negative variance (over budget) signals aging fleet issues or unexpected failures.
The template produces a solid annual forecast. Oxmaint produces a living budget model that updates with every work order, every fuel purchase, and every parts receipt. Budget-to-actual comparisons are available any day of the year — not just at month-end or quarter-end. CFOs get the spending visibility they demand. Fleet managers get early warning when categories trend over budget.
Frequently Asked Questions
How much should I budget for fleet maintenance per vehicle?
Should I budget PM and repairs separately?
How do I present the fleet budget to my CFO?
How do I account for unexpected major repairs in the budget?
Build a Fleet Budget That Survives the Fiscal Year
Stop defending budget overruns. Start presenting data-driven forecasts that account for vehicle aging, historical trends, and fleet composition changes. This template gives you the methodology. Oxmaint gives you the real-time data that keeps your forecast accurate all year. Download the template to build your next budget, or go digital for continuous budget intelligence.