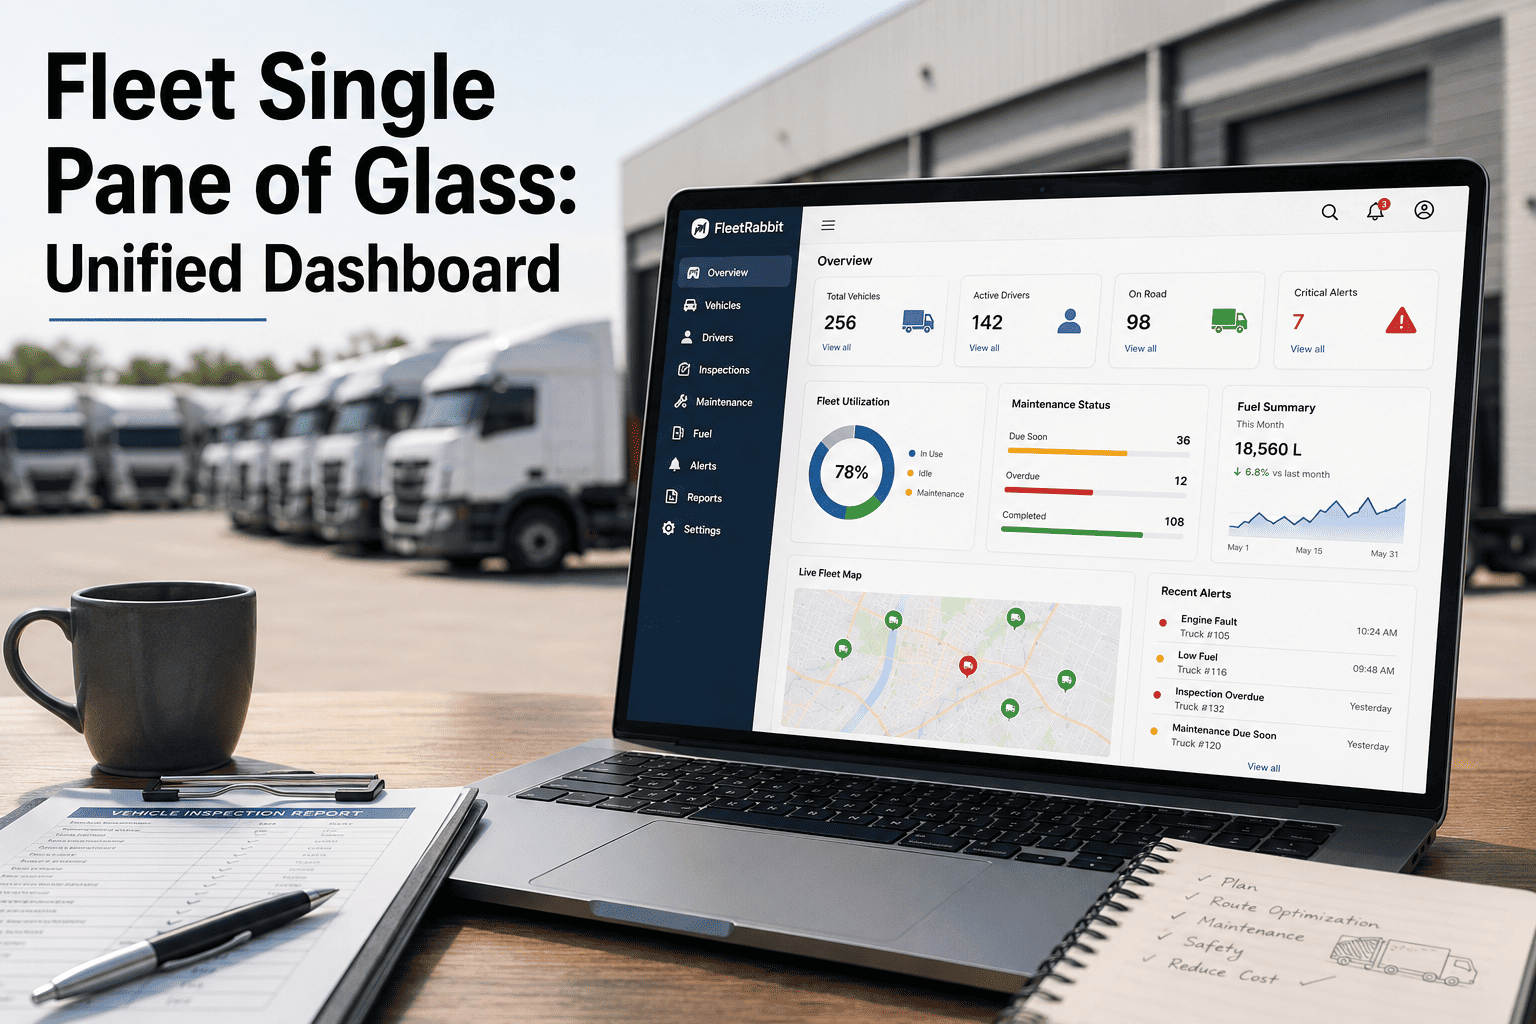
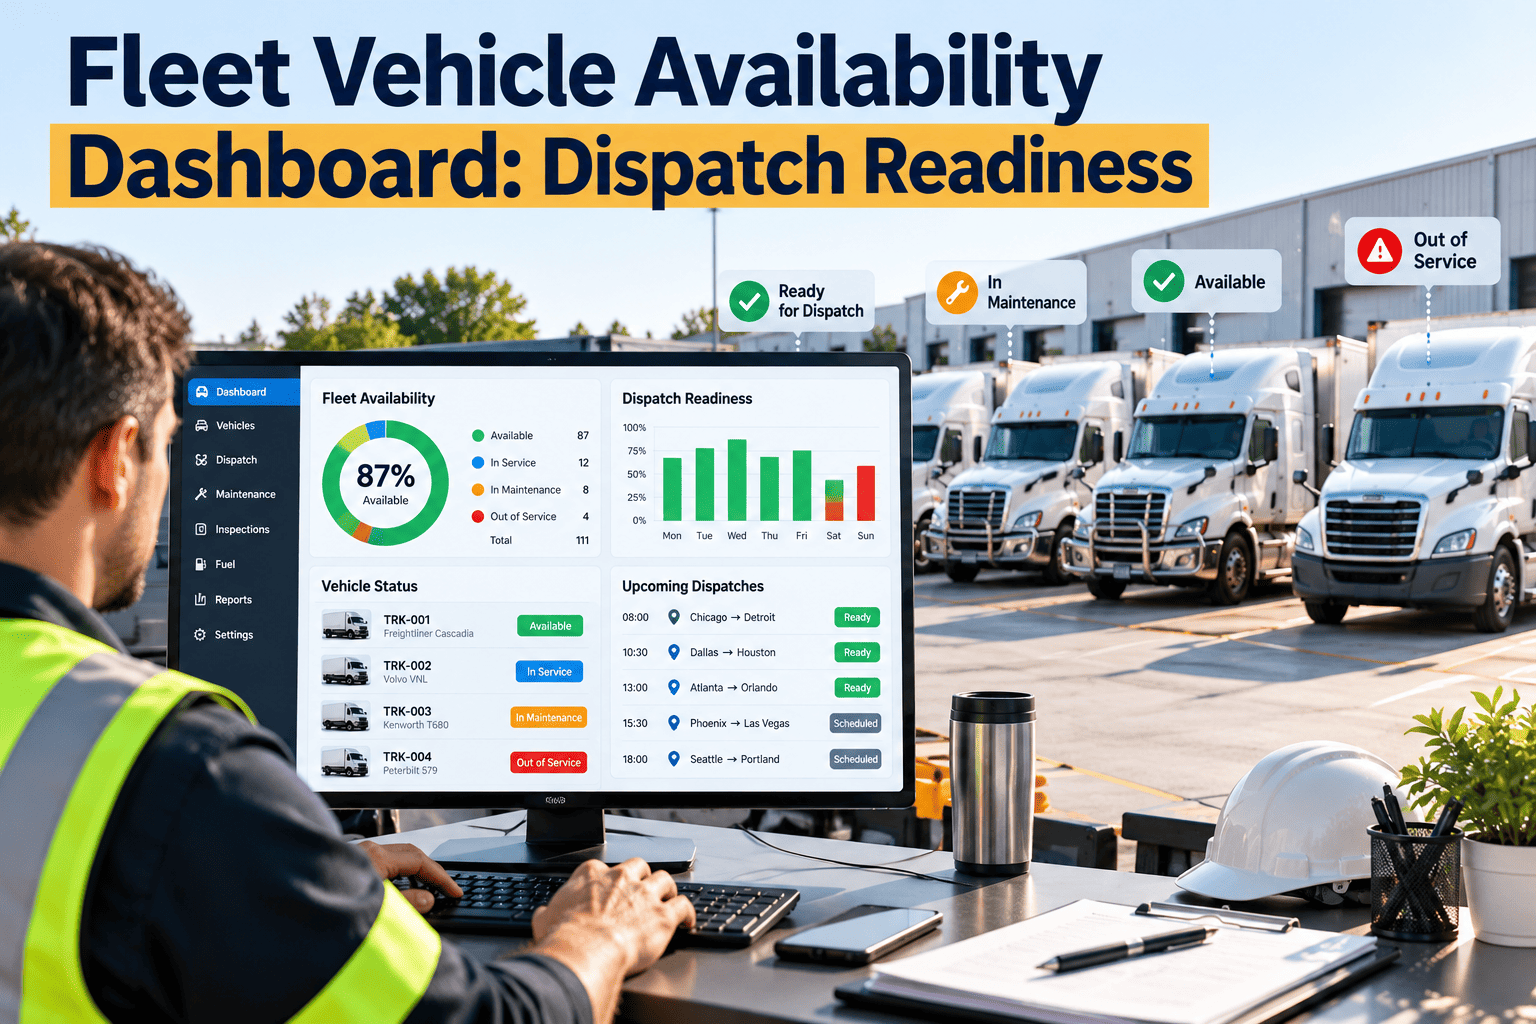
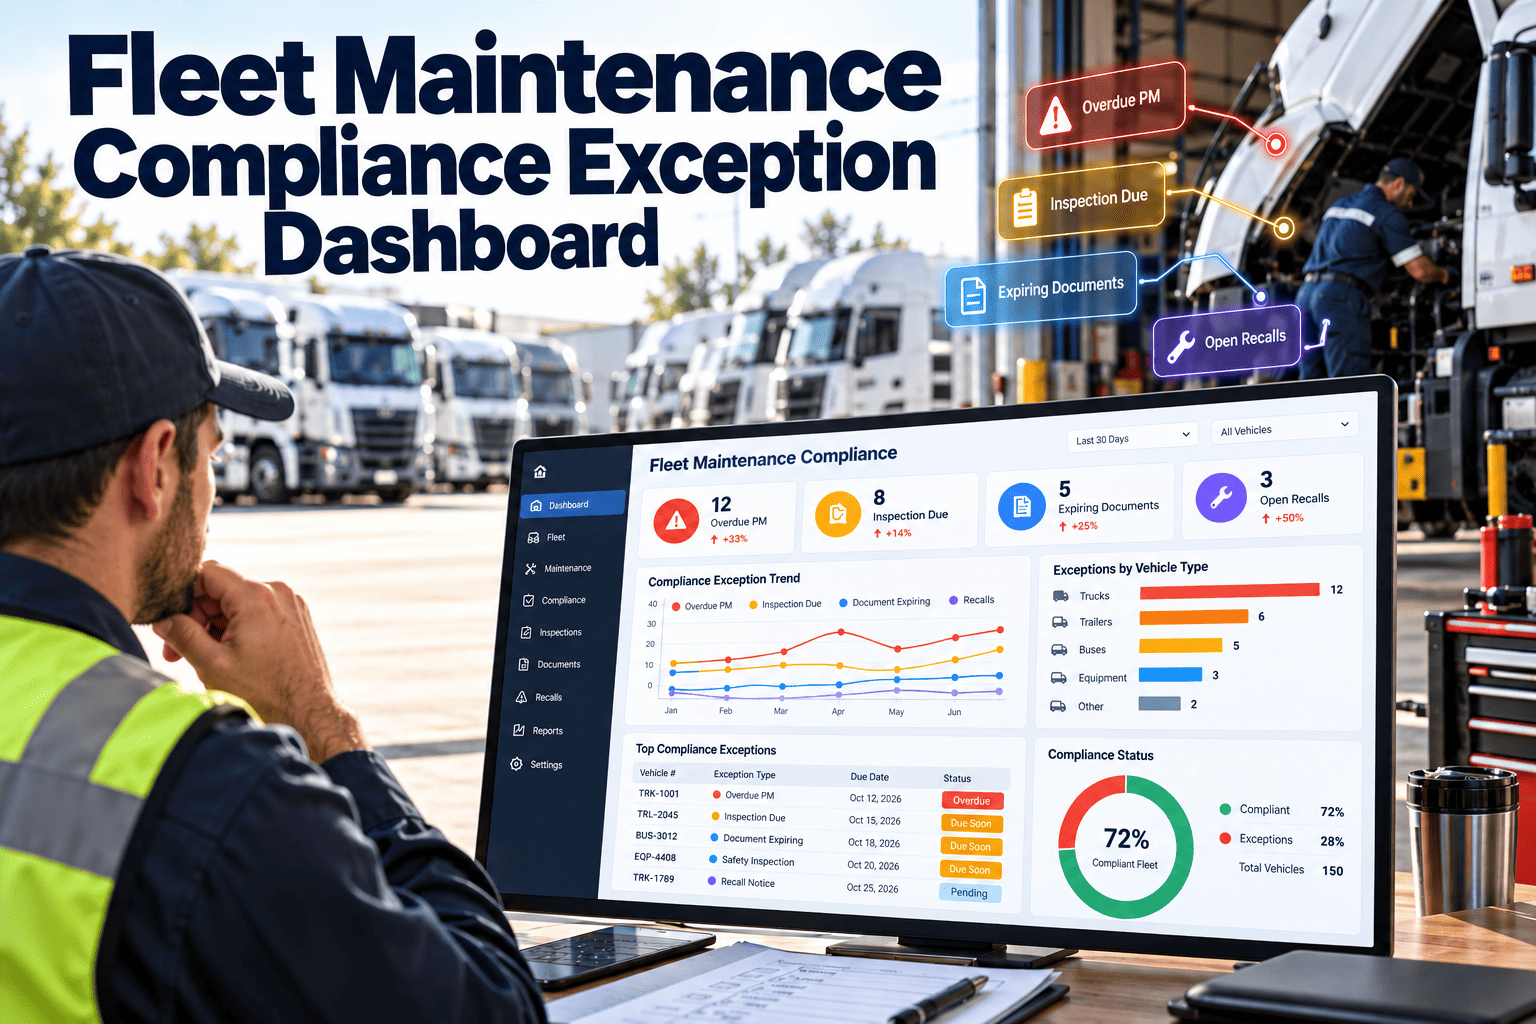
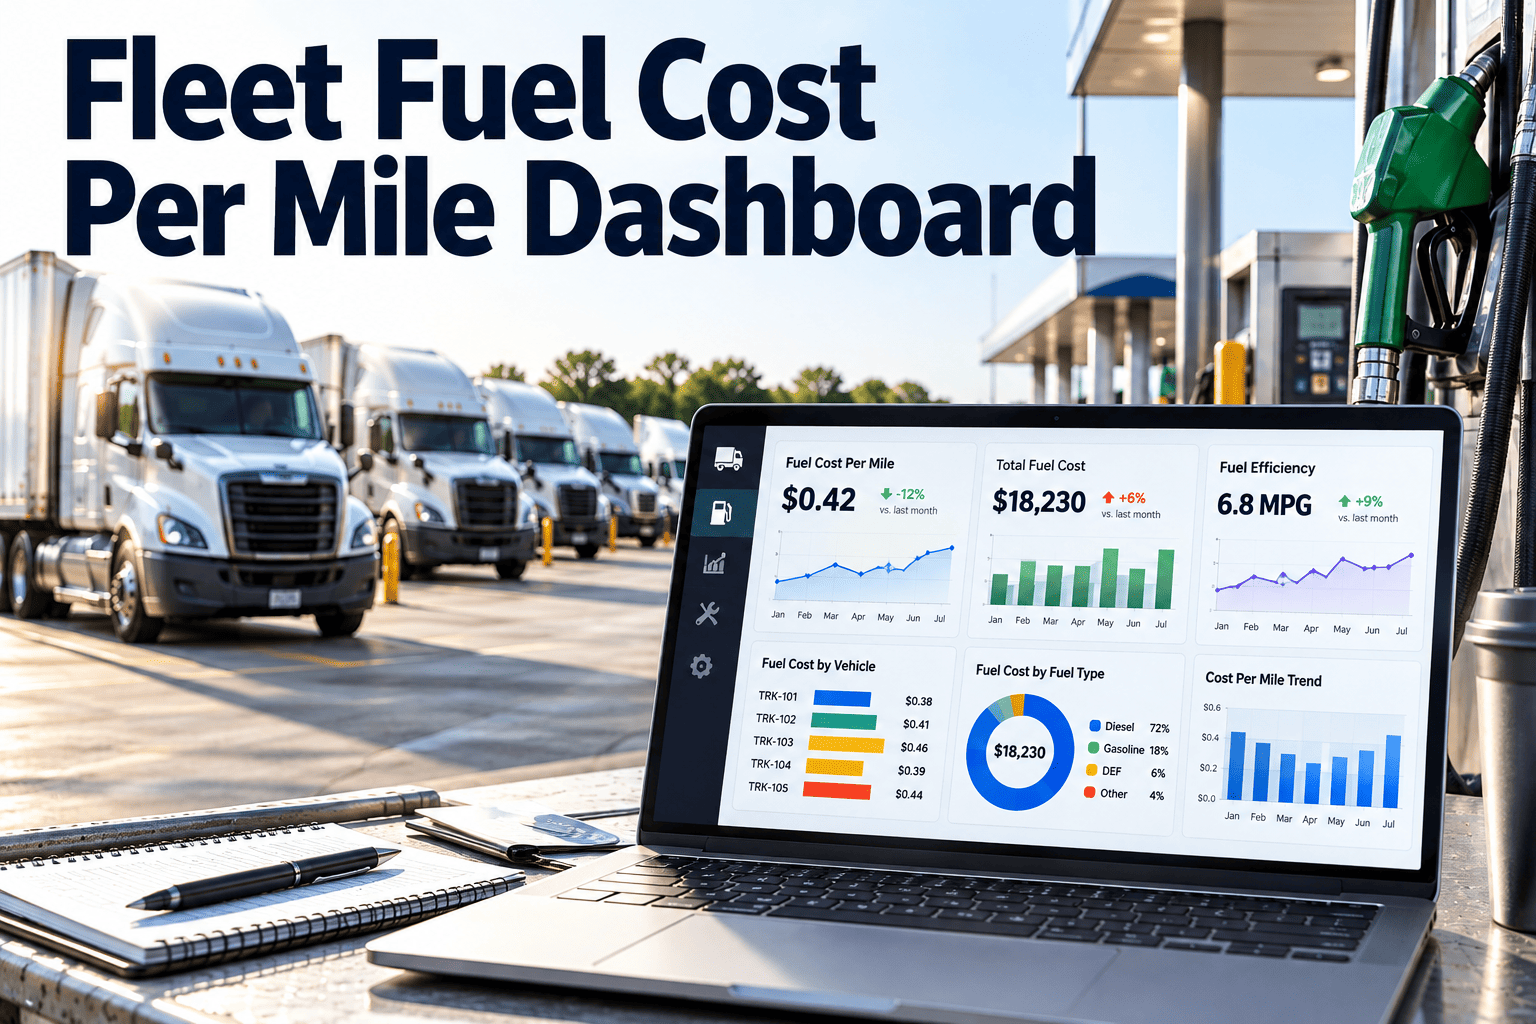
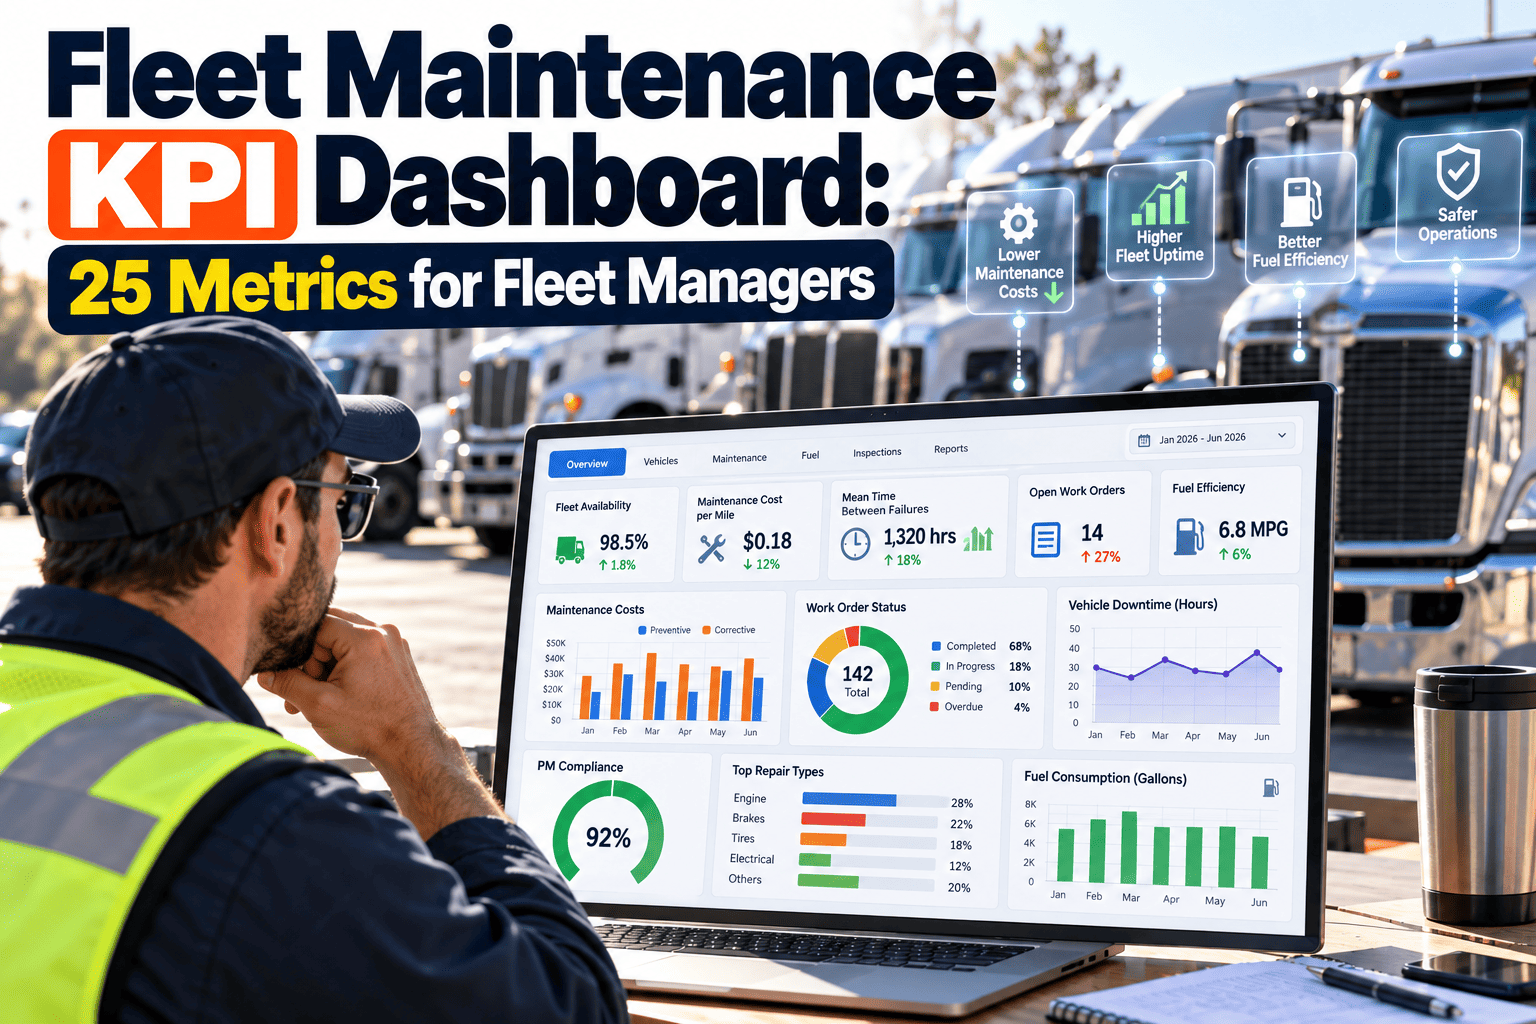
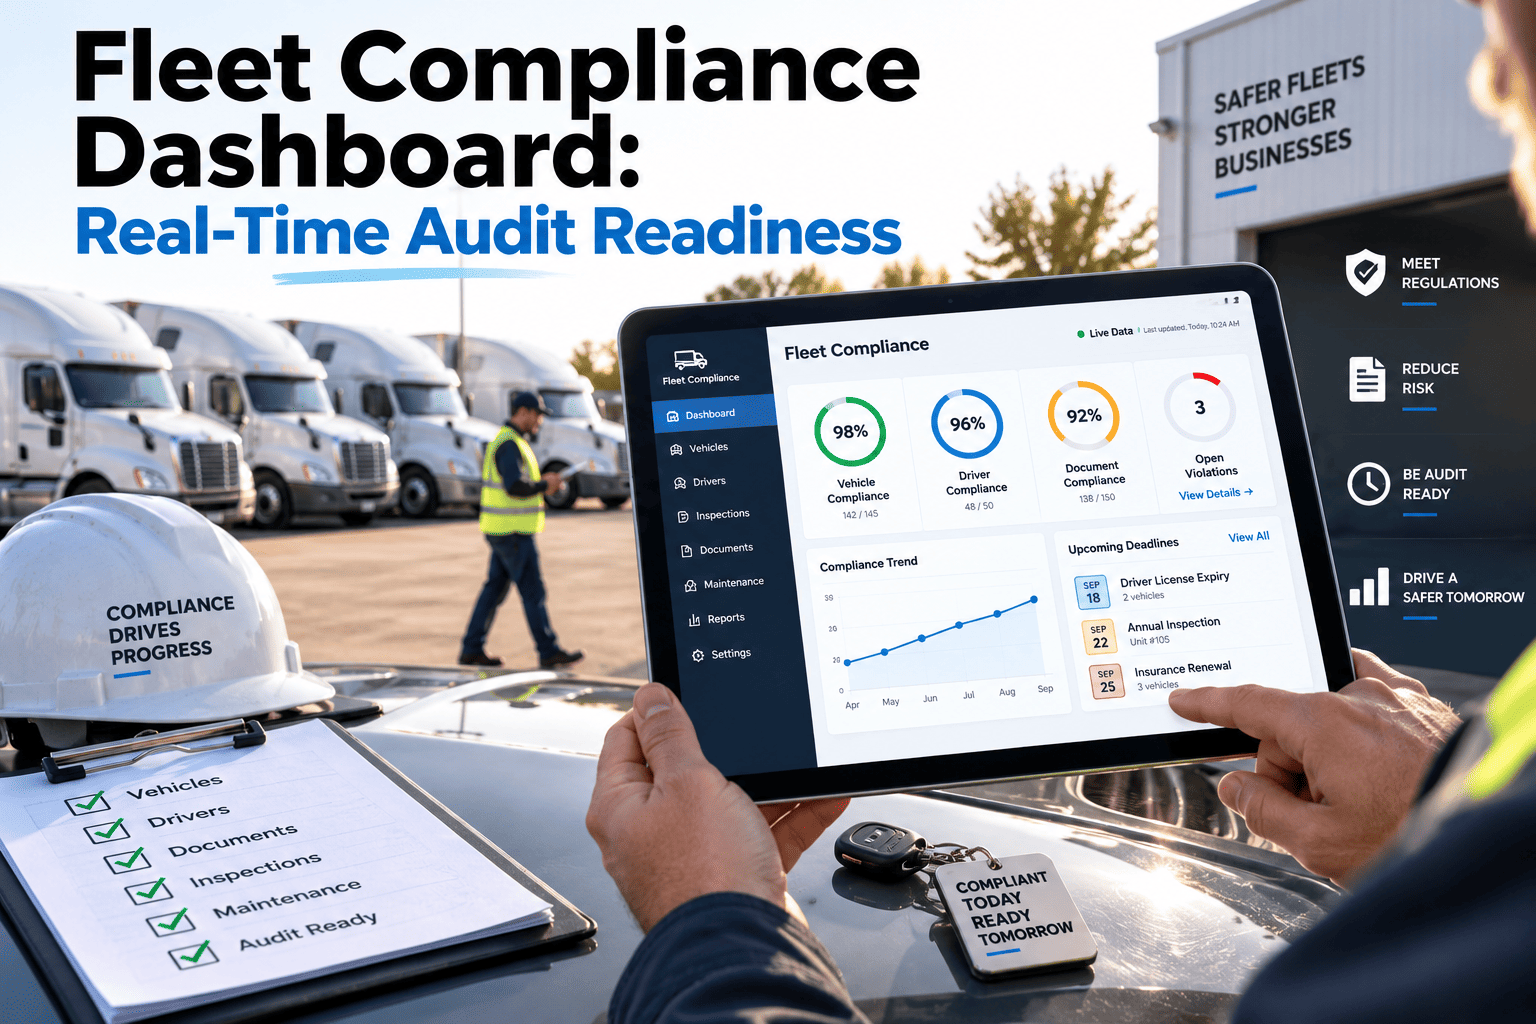
Ask a fleet manager one simple question — which vehicle is costing the most this month — and watch what happens. A tab opens for telematics. Another for the fuel card portal. Another for the maintenance log. A spreadsheet gets pulled up to cross-reference all three. By the time an answer exists, the moment to act on it has usually passed. The average fleet manager loses roughly 11 hours a week manually stitching data together across systems that were never built to talk to each other, and that time comes directly out of the hours that should go to actually running the fleet. See what one unified dashboard looks like with OxMaint.
Unified Fleet Dashboard
Stop Switching Between Five Systems to Answer One Question
OxMaint pulls telematics, maintenance, fuel, and compliance data into a single operational view — so decisions happen in seconds, not after fifteen minutes of tab-switching.
11 hrs
Spent weekly by the average fleet manager manually merging data
15–25%
Of fleet maintenance spend lost to poor data integration
$8,500
Average annual cost per vehicle from unplanned downtime
The Hidden Cost of a Five-Tab Fleet Operation
Most fleet leaders do not lack dashboards — they have too many of them. A dashboard for telematics. Another for maintenance. Another for dispatch. Another for fuel. Each one sees a piece of the fleet, but no single screen sees the whole picture, and the cost of that fragmentation shows up as missed deliveries, duplicated data entry, and repairs nobody saw coming.
01
Telematics System
Shows location and idle time in isolation — with no automatic link to the fuel spend or maintenance record that would explain why.
02
Maintenance / CMMS
Tracks work orders and service history, but rarely reflects real-time vehicle condition data streaming in from telematics sensors.
03
Fuel Card Portal
Flags a spend spike as a transaction, not as a symptom of aggressive driving, excess idle time, or an overdue repair.
04
Dispatch / Routing Tool
Plans routes without visibility into which vehicles are mid-repair or approaching a maintenance-driven capacity limit.
Aggregation Is Not the Same as a True Single Pane of Glass
Plenty of tools claim to be a single pane of glass simply by pulling data from several systems onto one screen. That solves the visibility problem but not the decision problem — a wall of charts from four sources is still four separate stories unless something is doing the work of connecting them. The difference between an aggregated dashboard and a true unified dashboard is what happens after the number appears on screen.
Aggregated Dashboard
Data sourcesDisplayed side by side
CorrelationLeft to the viewer
Root causeRequires manual investigation
ActionA separate step in another tool
True Single Pane of Glass
Data sourcesMerged into one operational record
CorrelationAutomatic, cross-system
Root causeSurfaced directly on the dashboard
ActionWork order or alert triggered in place
Anatomy of a Blind Spot — and How Unification Closes It
Consider a single vehicle whose fuel consumption climbs 15% above baseline in a week. In a siloed environment, that number sits quietly in the fuel portal until someone happens to notice it. In a unified dashboard, the same number triggers a chain reaction across every system holding a piece of the explanation.
One Signal, Four Data Sources, One Answer
1
Fuel Spend +15%
Flagged the moment it deviates from the vehicle's baseline
+
2
Idle Time Rising
Telematics shows extended idle periods on the same routes
+
3
Overdue Air Filter
Maintenance log shows a scheduled service was missed
=
4
Work Order Auto-Created
Root cause identified and dispatched before it becomes a breakdown
We had four systems and four different versions of the truth. The morning we turned on the unified dashboard, we found three trucks burning excess fuel from the same worn belt issue — something none of the individual tools had connected on their own.
Director of Fleet Operations — Regional distribution company, 96 vehicles
Data Integration
One Screen. Every System. One Version of the Truth.
OxMaint connects telematics, fuel, maintenance, and compliance data into a single operational record — correlating signals automatically instead of leaving the connection to whoever happens to be looking.
What Actually Belongs on a Unified Fleet Dashboard
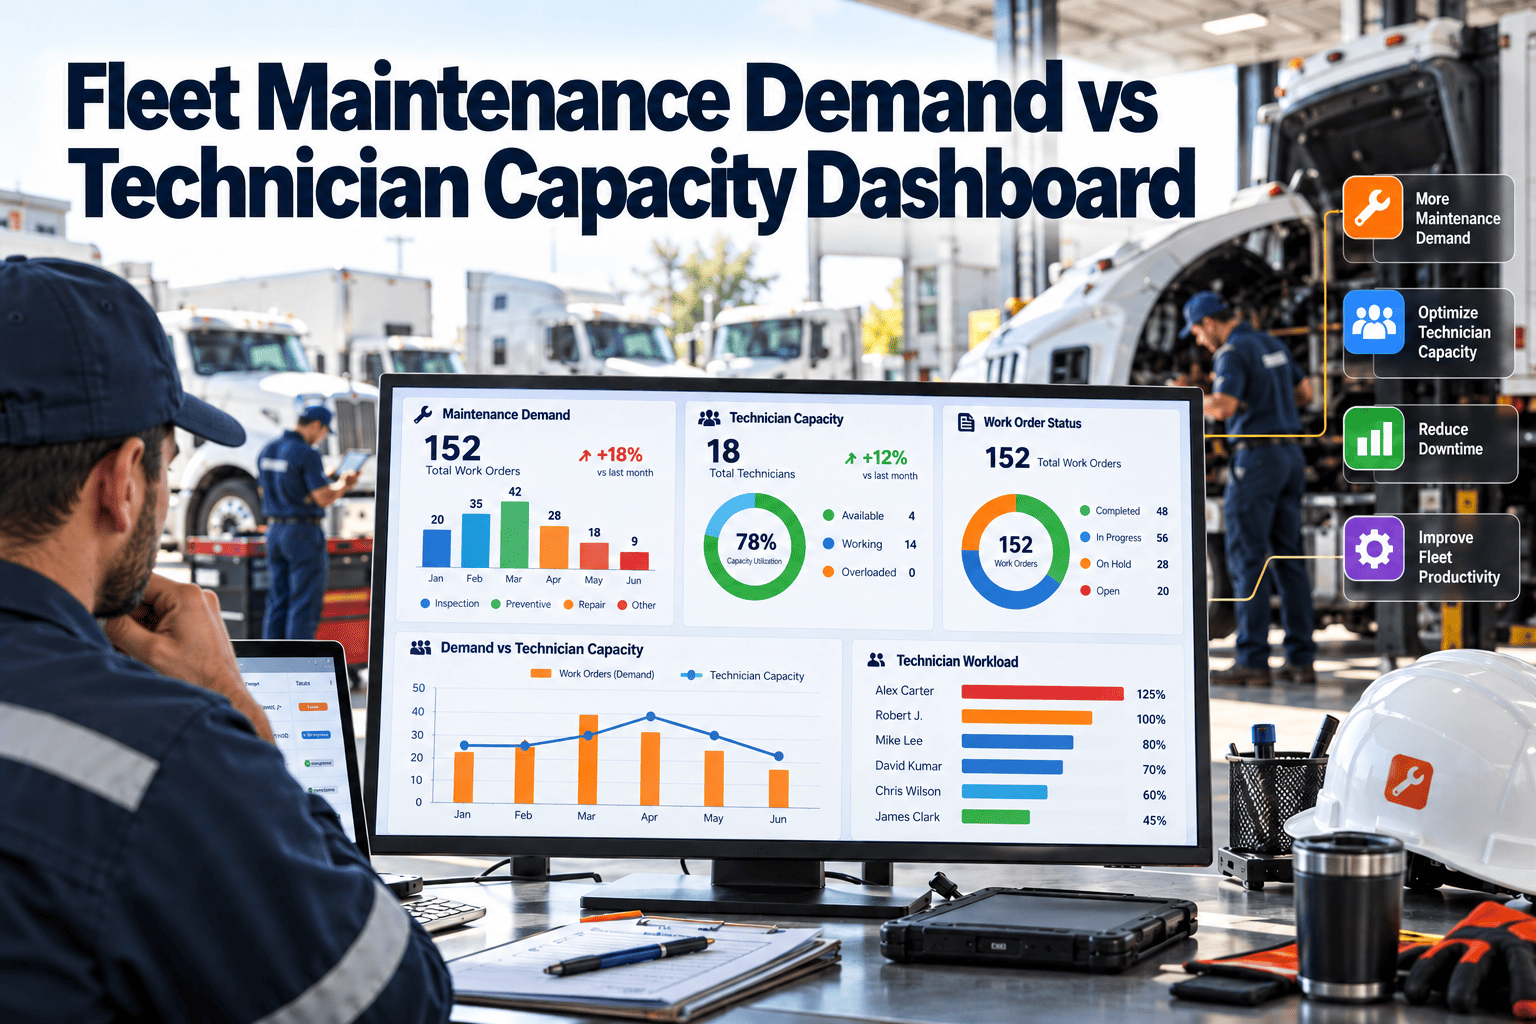
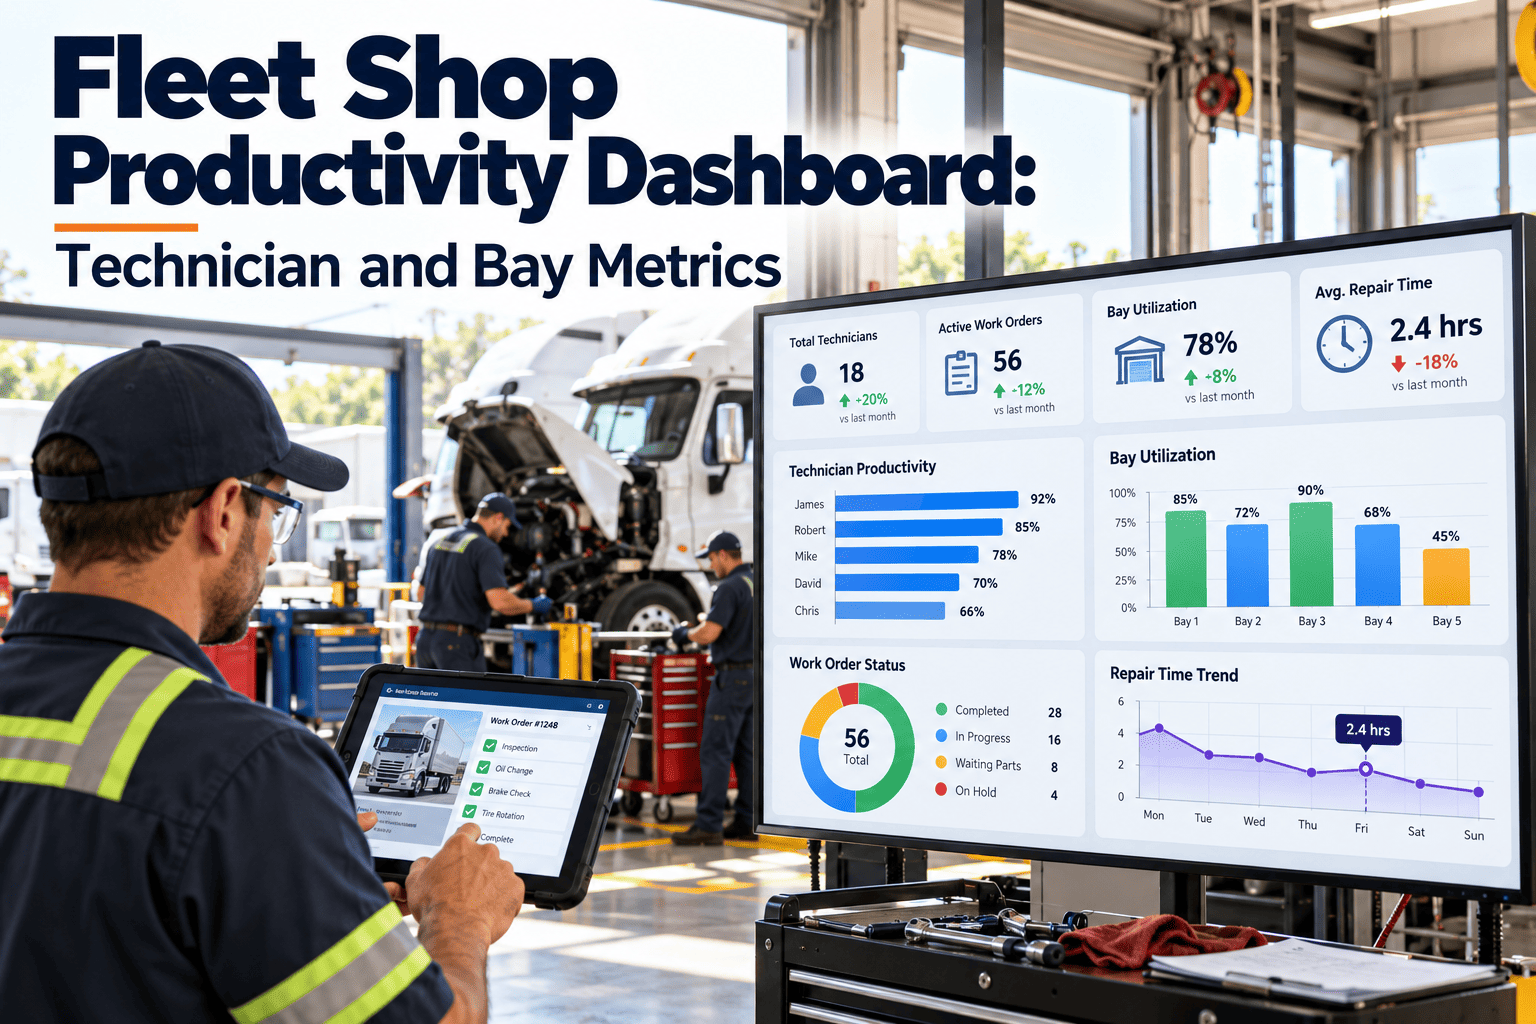
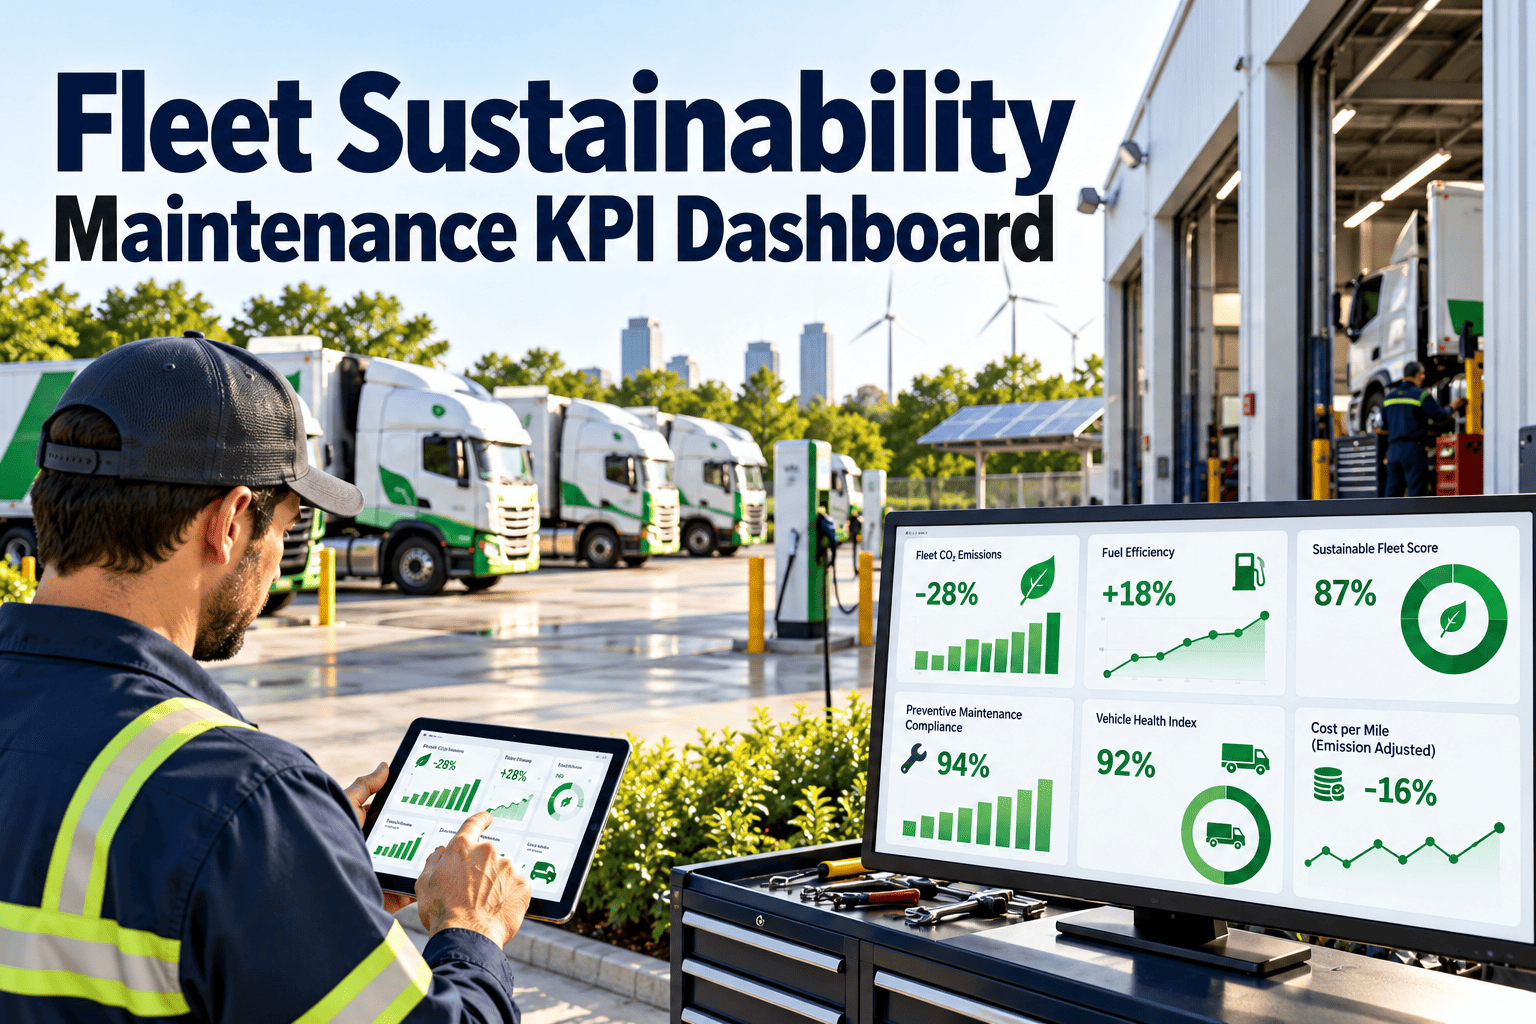
A dashboard becomes noise the moment it tries to show everything. The KPIs below are the ones that matter across every department that touches a fleet — operations, maintenance, and finance — because each one only means something when read alongside the others.
Utilization Rate
Actual operating hours against available hours. Below 80% signals over-fleeting; top performers run above 90%.
Cost Per Mile
Fuel, maintenance, and depreciation combined into one figure that finance and operations can both plan around.
Idle Cost
Average fleets run 20–30% idle time, translating into thousands of wasted dollars per vehicle every year.
PM Compliance Rate
Only a small share of fleets hit 95–100% preventive maintenance compliance — the rest carry hidden breakdown risk.
22%
Of maintenance budgets spent on reactive repairs integrated data would have predicted
20–30%
Average idle time across commercial fleets, largely invisible in siloed systems
21%
Share of total operating cost that fuel represents — the largest controllable expense
1 quarter
Typical time to full ROI after unifying fleet data into one dashboard
Frequently Asked Questions
What systems does OxMaint pull data from for a unified dashboard?
OxMaint integrates with major telematics, fuel card, dispatch, and compliance systems, merging their data into one operational record rather than just displaying separate charts side by side.
See which systems connect to your fleet.
Isn't a single pane of glass just another dashboard to maintain?
A true single pane of glass replaces the tab-switching, not adds to it. It pulls existing systems into one operational view and correlates them automatically, so it becomes the one screen a fleet manager actually opens.
How does OxMaint turn a data correlation into an action?
When signals from multiple systems point to the same root cause — like rising fuel spend and an overdue service — OxMaint can trigger a work order directly, closing the gap between insight and action.
Book a demo to see the workflow live.
How long does it take to unify our existing fleet systems?
Most fleets connect their core telematics, fuel, and maintenance systems within days through standard integrations, with most fleets reaching full ROI within the first quarter of use.
Can different teams see different views of the same unified data?
Yes. Operations, maintenance, and finance teams can each view role-specific dashboards drawn from the same underlying data, so every team works from one version of the truth.
Start free and set up your team's views.
One Dashboard. Every Answer. No More Tab-Switching.
OxMaint unifies telematics, maintenance, fuel, and compliance data into one operational view — so the next decision your fleet needs is one screen away, not fifteen minutes of cross-referencing away.