Most FMCG plants have a maintenance department. Very few have a maintenance operation. The difference is not headcount, budget, or equipment — it is the presence of a coherent framework that connects daily work orders to reliability targets, reliability targets to production performance, and production performance to commercial outcomes. Plants that operate without this framework spend their maintenance budget reactively, fire-fighting breakdowns that a structured programme would have prevented. Plants that build it reduce unplanned downtime by 40–60%, extend equipment life by 30–50%, and achieve maintenance cost reductions of 20–35% within 24 months — while simultaneously improving safety and GMP compliance records. This article is the complete framework. Start your free trial to implement it in your plant. Book a demo to see OxMaint's full platform configured for operational excellence.
All Platform Features
One Platform. Every Pillar of Maintenance Excellence.
OxMaint connects preventive maintenance scheduling, work order management, spare parts inventory, compliance audit trails, and predictive analytics in a single system — giving FMCG plants the operational backbone their excellence framework requires.
40–60%
reduction in unplanned downtime achievable within 18 months of framework implementation
20–35%
maintenance cost reduction through shift from reactive to planned and predictive strategies
3.8x
average ROI on maintenance excellence investment across FMCG sector benchmarks
The Maintenance Maturity Model: Where Most FMCG Plants Actually Are
Before building an excellence framework, a plant must honestly assess its current maturity level. The maintenance maturity model describes five stages of operational development. Most FMCG plants in India and Southeast Asia sit between Stage 1 and Stage 2. World-class operations operate at Stage 4 and above. The gap is not insurmountable — but it requires a deliberate, sequenced programme rather than isolated tool deployments.
Stage 1
Reactive
Fix it when it breaks. No PM schedule. Maintenance driven entirely by breakdowns and production complaints. Most budget spent on emergency repairs and expedited spare parts.
OEE: <55%
Stage 2
Preventive
Time-based PM schedules exist but compliance is inconsistent. Work orders are tracked but often on paper or spreadsheets. Breakdown rate is lower but PM backlog is chronic.
OEE: 55–68%
Stage 3
Planned
CMMS deployed. PM compliance above 80%. Spare parts inventory managed. Maintenance KPIs tracked and reviewed. Corrective and preventive work clearly separated and prioritised.
OEE: 68–78%
Stage 4
Predictive
Condition-based monitoring and predictive analytics drive maintenance decisions. RCM analysis completed for critical assets. Maintenance integrated with production planning. Reliability engineering function active.
OEE: 78–88%
Stage 5
Optimised
Continuous improvement embedded. Maintenance cost benchmarked against world-class peers. Total Productive Maintenance fully implemented with operator ownership. Digital twin and AI-assisted maintenance decisions.
OEE: 85%+
The Four Strategic Pillars of Maintenance Excellence
A maintenance excellence framework is not a single initiative — it is four interconnected strategic pillars that must be built and sustained simultaneously. Deploying one pillar without the others produces diminishing returns. A plant that implements predictive maintenance without foundational PM compliance is spending money on sensors while ignoring scheduled lubrication. A plant with excellent PM compliance but no reliability engineering is maintaining equipment on time-based schedules that may not match actual failure modes.
01
Asset Reliability Foundation
Equipment hierarchy, criticality ranking, failure mode library, and PM task standards. The foundation every other pillar is built on. Without it, PM schedules are guesswork and CMMS data is unreliable.
Asset register completeness
Criticality classification coverage
PM task standard completion
02
Preventive Maintenance Excellence
PM schedule optimisation, compliance tracking, and backlog management. PM compliance above 90% is the single highest-leverage metric in FMCG maintenance — no other improvement delivers equivalent breakdown reduction.
PM compliance rate ≥90%
PM backlog ≤2 weeks
Reactive to planned ratio ≤30:70
03
Reliability Engineering
RCM analysis, FMEA, failure pattern identification, and PM strategy optimisation. Moves maintenance from time-based to condition and risk-based — eliminating unnecessary PMs and targeting resources at actual failure risk.
MTBF trend (improving)
Repeat failure rate ≤5%
RCM coverage of critical assets
04
Continuous Improvement System
KPI review cadence, root cause analysis process, maintenance cost benchmarking, and TPM pillar deployment. Ensures gains are sustained and built upon rather than eroded by operational pressure.
Weekly KPI review conducted
RCA completed for all major failures
Cost/replacement asset value ratio
TPM: The Organisational Framework That Sustains Maintenance Excellence
Total Productive Maintenance is the most proven organisational framework for sustaining maintenance excellence in FMCG manufacturing. It works because it distributes maintenance ownership beyond the maintenance department — giving operators responsibility for autonomous maintenance of their equipment, and giving maintenance engineers time to focus on reliability improvement rather than routine servicing that operators can perform. TPM implementation in FMCG plants consistently delivers OEE improvements of 15–25 percentage points within 18–24 months when all eight pillars are deployed.
01
Autonomous Maintenance
Operators take ownership of cleaning, inspection, lubrication, and minor adjustments on their equipment. Frees maintenance engineers from routine servicing. Builds operator equipment knowledge that catches early failure signs.
02
Planned Maintenance
Scheduled PM executed by maintenance team on a CMMS-driven schedule with compliance tracked and reported. Target: 85%+ planned vs reactive ratio, PM compliance above 90%.
03
Quality Maintenance
Equipment condition linked to product quality outcomes. Maintenance standards designed to eliminate defects at the source — calibration compliance, seal integrity, fill accuracy — rather than detecting them at QC.
04
Focused Improvement
Cross-functional teams target the highest-loss equipment and processes using PDCA cycles. Each improvement project delivers measurable OEE gain. Loss elimination prioritised by frequency × impact × cost.
05
Early Equipment Management
Maintenance team involved in new equipment procurement — specifying maintainability requirements, spare parts standardisation, and PM task development before installation. Prevents 10 years of reactive maintenance on poorly specified equipment.
06
Training & Education
Structured competency development for maintenance technicians and operators. Skills matrix per equipment type. Training records linked to CMMS — only trained personnel authorised to perform specific maintenance tasks.
07
Safety, Health & Environment
LOTO compliance, safety device testing, and environmental controls integrated into maintenance work orders. Safety maintenance treated with the same discipline and documentation as production maintenance.
08
Office / Administrative TPM
5S and efficiency principles applied to maintenance planning, spare parts procurement, and documentation processes. Eliminates waste in maintenance administration that consumes planner and supervisor time without adding maintenance value.
Planned Maintenance & TPM Support
TPM Works When Every Work Order Is Visible, Tracked, and Completed on Time
OxMaint provides the CMMS backbone for TPM — autonomous maintenance task tracking, planned PM compliance reporting, work order completion analytics, and technician training record management — all in one platform accessible from the plant floor via mobile.
RCM: Making Maintenance Strategy Decisions on Evidence, Not Assumption
Reliability Centred Maintenance is the analytical method that answers the most important question in maintenance strategy: for each failure mode on each critical asset, what is the right maintenance task — if any? RCM analysis consistently finds that 30–40% of time-based PM tasks on FMCG equipment either have no measurable reliability benefit or are applied at the wrong frequency. Eliminating unnecessary PMs and optimising effective ones reduces maintenance labour by 15–20% while improving reliability — because resources are concentrated on failure modes that actually threaten production.
The Maintenance KPI Framework: 12 Metrics That Drive FMCG Operational Excellence
KPIs without a review cadence are decoration. A maintenance excellence framework requires 12 metrics tracked weekly and monthly at different organisational levels — from technician performance metrics reviewed weekly in the morning meeting to strategic metrics reviewed monthly with plant leadership. Each metric must be owned by a named individual, have a defined target, and trigger a defined response when it goes outside acceptable range.
Equipment Performance
Overall Equipment Effectiveness (OEE)
Target: ≥78% (world-class ≥85%)
Availability × Performance × Quality. The single most important production metric. Every maintenance decision ultimately affects OEE. Track per line, per shift, weekly trend.
Mean Time Between Failures (MTBF)
Target: Improving trend, ≥10% per year
Average operating time between failures on critical equipment. The primary output metric of reliability engineering effort. Declining MTBF is the leading indicator of a deteriorating asset base.
Mean Time To Repair (MTTR)
Target: ≤2 hrs for critical equipment
Average repair time from failure detection to production resumption. Measures maintenance team efficiency and spare parts availability. MTTR above 4 hours indicates a systematic parts, skills, or information gap.
Maintenance Execution
PM Compliance Rate
Target: ≥90% — minimum 85%
Percentage of scheduled PMs completed on time. The highest-leverage leading indicator in maintenance management. Below 80% consistently correlates with deteriorating OEE within 6–9 months.
Planned vs Reactive Maintenance Ratio
Target: ≥70% planned, ≤30% reactive
Percentage of total maintenance hours that are planned vs emergency/corrective. Reactive ratio above 50% indicates a fundamentally reactive operation regardless of what the PM schedule looks like on paper.
PM Backlog (weeks of work)
Target: ≤2 weeks — critical: ≤1 week
Total outstanding PM work as weeks of available maintenance labour. A growing backlog is the leading indicator of future breakdown increases — each overdue PM is a reliability risk accumulating in the system.
Reliability & Cost
Repeat Failure Rate
Target: ≤5% of all failures
Percentage of failures that recur on the same equipment within 30 days of repair. Above 10% indicates repairs are addressing symptoms, not root causes. Requires formal RCA process for every repeat failure.
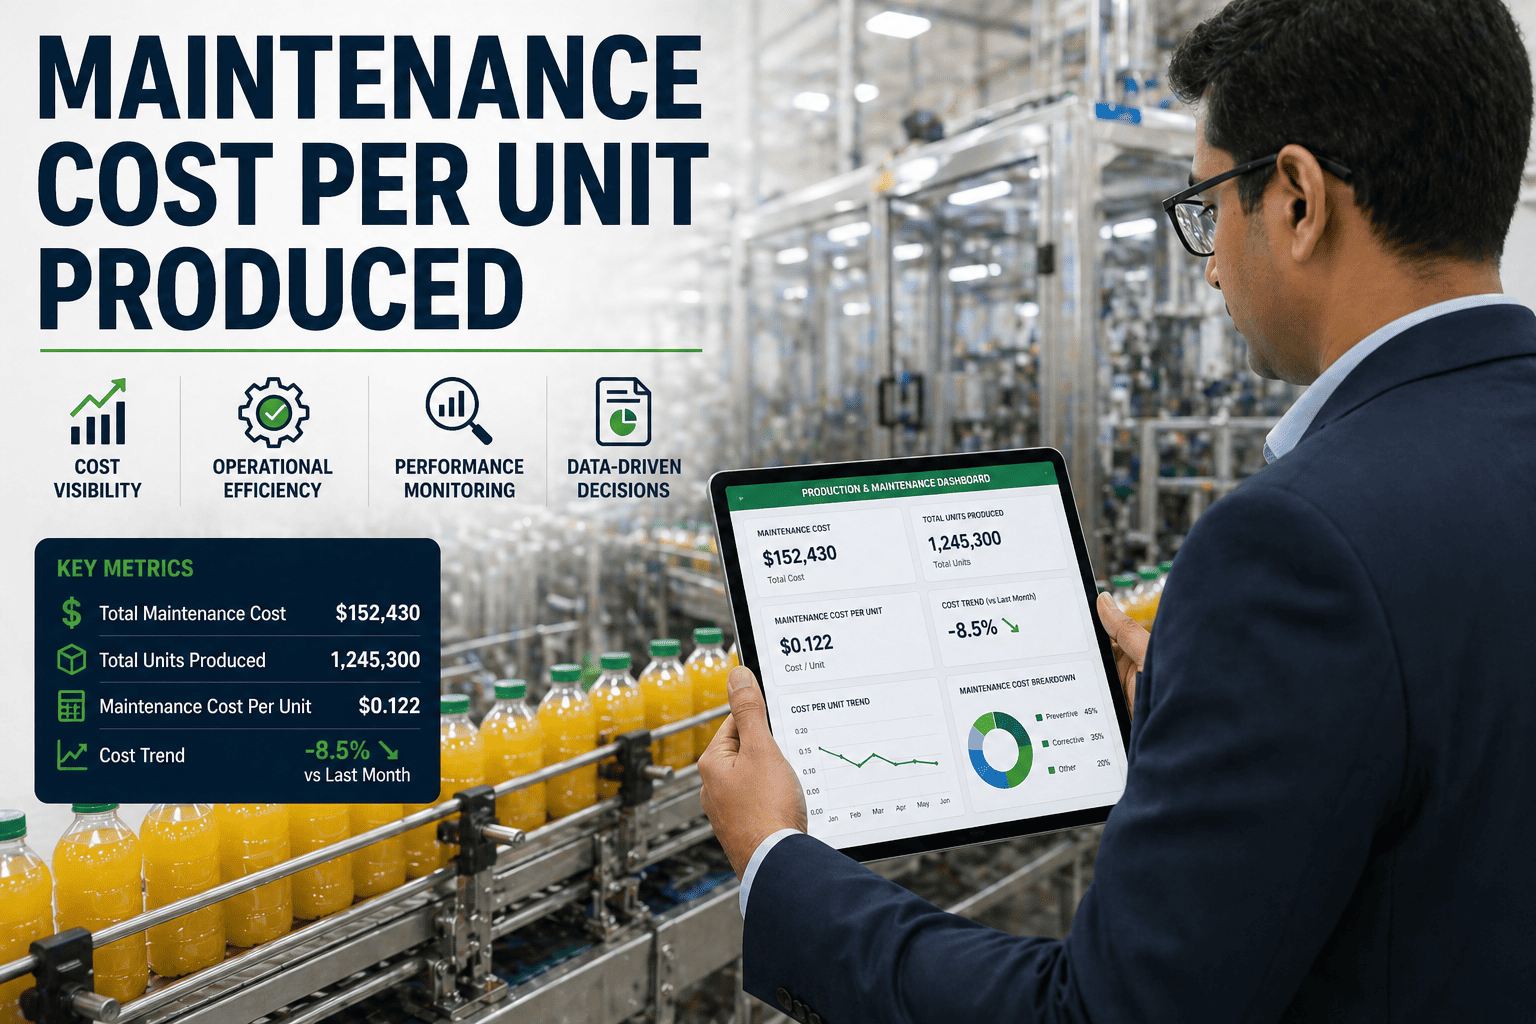
Maintenance Cost as % of Replacement Asset Value
Target: 2–4% RAV (world-class 2–2.5%)
Annual maintenance spend divided by current replacement value of plant and equipment. The primary maintenance cost benchmark used by world-class FMCG operators. Above 6% RAV indicates a reactive operation.
Spare Parts Inventory Turns
Target: 1.5–2.5 turns per year
Annual parts consumption divided by average inventory value. Below 1 turn indicates excessive stockholding. Above 4 turns risks stockouts on critical parts. Optimising turns reduces working capital without compromising reliability.
Workforce & Compliance
Work Order Completion Rate
Target: ≥95% within defined priority SLA
Percentage of work orders completed within their target timeframe by priority level. Measures execution discipline. Below 90% on P1 (critical) work orders indicates resource or skill gaps that directly threaten OEE.
Safety Work Order Overdue Rate
Target: 0% overdue on safety-critical WOs
Percentage of safety-critical maintenance tasks completed on time. Non-negotiable metric. A single overdue safety PM is a regulatory and liability exposure. Should be the first metric reviewed in every maintenance meeting.
Technician Utilisation Rate
Target: 55–65% wrench time
Percentage of technician hours spent on direct maintenance work vs travel, waiting, administration. Below 40% wrench time indicates planning and scheduling failures. Improving utilisation through better planning delivers more maintenance output without adding headcount.
Predictive Maintenance Technologies for FMCG Plants
Predictive maintenance uses condition monitoring technology to detect the early signs of failure before functional performance is affected — giving the maintenance team a window of days to weeks to plan and execute repairs at minimal cost and disruption. In FMCG manufacturing, three predictive technologies deliver the highest ROI relative to implementation cost and maintenance complexity.
Vibration Analysis — Rotating Equipment
Detects: Bearing wear, shaft misalignment, imbalance, looseness, gear mesh defects. Warning period: 2–8 weeks before functional failure for most rotating equipment in FMCG applications.
Implementation: Handheld vibration meter route on critical motors, pumps, and gearboxes monthly. Trend analysis identifies anomalies 4–8 weeks before failure. Average cost avoidance per prevented bearing failure: $3K–$10K including production impact.
Infrared Thermography — Electrical and Mechanical
Detects: Loose electrical connections, overloaded circuits, failing bearings, conveyor belt splice hot spots, heat exchanger fouling. Warning period: 1–6 weeks depending on failure mode and severity.
Implementation: Quarterly thermal scan of all electrical panels, motor control centres, and critical mechanical assemblies. Thermal camera rental/service typically more cost-effective than ownership for plants with fewer than 200 motors. Each scan identifies 3–8 findings on average in a typical FMCG plant.
Oil Analysis — Gearboxes and Hydraulic Systems
Detects: Gear and bearing wear metals, contamination ingress, oil degradation, additive depletion. Warning period: 1–3 months for progressive wear detection through trend analysis.
Implementation: Quarterly oil sampling on all gearboxes above 15 kW and all hydraulic systems. Laboratory analysis report returned within 3–5 days. Identifies gearbox failures 3–6 months before functional failure and optimises oil change intervals — reducing unnecessary oil changes by 30–40%.
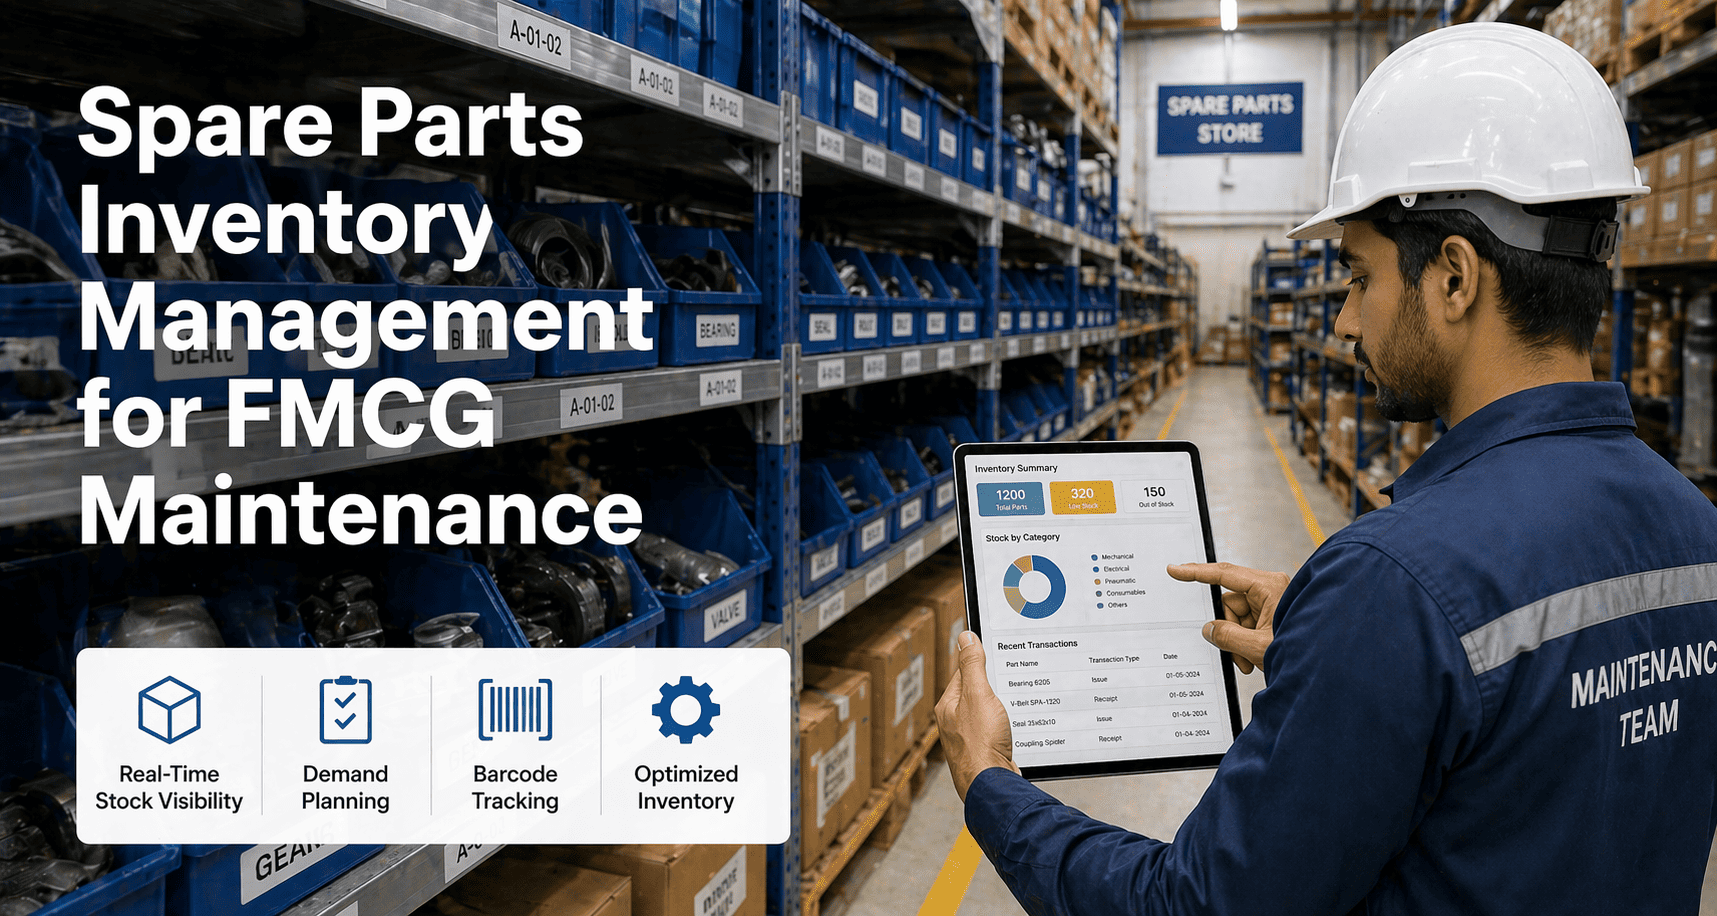
Spare Parts Optimisation: The Hidden Cost Centre in FMCG Maintenance
Spare parts inventory is typically the second largest maintenance cost after labour — and the most poorly managed. Most FMCG plants simultaneously carry excessive stock of low-risk consumables while stocking out on critical parts that stop production lines. Optimising the spare parts portfolio reduces working capital by 20–35% while improving parts availability for genuine critical needs.
Classify every spare part by criticality — not cost
Criticality is determined by the production consequence if the part is unavailable, not by its purchase price. A $450 O-ring that stops a filling line is more critical than a $45,000 motor for a non-production-critical pump. Every part should be classified as Critical (line stop risk within 4 hours), Important (line stop within 24 hours), or Standard (replaceable within lead time without production impact). Stocking policy — min/max levels, safety stock, reorder points — should be driven by criticality classification.
Eliminate duplication through equipment standardisation review
Most FMCG plants carry 3–5 different bearing sizes that could be replaced by 1–2 standard sizes through equipment design standardisation. Each additional unique part number adds working capital, shelf space, and ordering administration. A standardisation review of the top 50 most-consumed parts typically identifies 20–30% rationalisation opportunities without any reduction in maintenance capability.
Identify and liquidate obsolete stock annually
Parts held for equipment that has been decommissioned, modified, or replaced represent dead working capital. An annual obsolescence review — comparing stock list against current asset register — typically identifies 10–15% of inventory value as obsolete. Parts that cannot be returned to suppliers should be offered to peer plants, sold to spares dealers, or written off rather than held indefinitely.
Implement consignment stock agreements for high-value critical parts
For high-value critical spares (large motors, gearboxes, control systems) where carrying cost is high but availability is essential, consignment arrangements with suppliers or third-party stocking services remove the capital cost while maintaining availability. The plant pays only when the part is consumed, not when it is received. Negotiating consignment on the top 10 highest-value critical spares typically removes $18K–$48K from working capital on a mid-size FMCG plant.
Link CMMS work orders to parts consumption for accurate usage data
Parts inventory optimisation is only possible when actual consumption data is reliable. Every work order that uses a spare part must record the part number, quantity, and equipment it was used on. Without this data, reorder points are based on guesswork and inventory levels drift out of optimisation within 6–12 months of any improvement project. CMMS-linked parts consumption creates the continuous data stream that enables dynamic min/max optimisation.
The ROI of Operational Excellence: Building the Business Case
OEE improvement (5pp)
$450K/yr
Maintenance cost reduction (25%)
$285K/yr
Spare parts working capital release
$200K
Safety incident cost avoidance
$143K/yr
Compliance audit pass rate improvement
$93K/yr
Annual programme cost (CMMS + team time)$33K/yr
Year 1 total value delivered$1.1M+
3.8x ROI in Year 1 — Rising to 6–8x by Year 3 as Reliability Gains Compound
The OEE improvement figure requires context. A 5 percentage point OEE improvement on a production line running at $9M annual throughput value adds $445K in production capacity — without capital investment, without new headcount, and without new equipment. This is available capacity that the reliability improvement unlocks from within the existing asset base. On a plant with multiple lines, the aggregate value of OEE improvement through maintenance excellence typically exceeds the entire maintenance budget within 18 months.
12-Month Operational Excellence Implementation Roadmap
Month 1–2
Foundation: Asset Register, Criticality Ranking, and CMMS Deployment
Build the complete equipment hierarchy in OxMaint. Classify every asset by criticality (Critical / Important / Standard) based on production consequence of failure. Complete PM task standards for all Critical and Important assets. Deploy CMMS to all maintenance technicians with mobile work order access. Establish baseline KPIs: current OEE, PM compliance rate, reactive vs planned ratio, maintenance cost.
Month 3–4
PM Excellence: Compliance Drive and Backlog Elimination
Execute first full PM cycle on all critical assets with CMMS tracking. Identify and eliminate the top 5 causes of PM non-completion. Achieve PM compliance above 85% within 6 weeks of CMMS deployment. Clear all overdue PMs on critical equipment. Launch weekly KPI review meeting. Begin spare parts criticality classification and inventory rationalisation.
Month 5–6
Reliability Engineering: RCM Analysis on Top 10 Loss-Causing Assets
Identify the 10 assets contributing most to unplanned downtime using CMMS failure history. Conduct FMEA and RCM analysis on each. Adjust PM schedules based on actual failure modes rather than OEM recommendations alone. Implement vibration monitoring route on all rotating equipment above 7.5 kW. Launch first focused improvement project on highest-loss equipment.
Month 7–9
TPM Launch: Autonomous Maintenance and Cross-Functional Ownership
Deploy Autonomous Maintenance on 2 pilot production lines. Train operators on CIL (Cleaning, Inspection, Lubrication) standards for their equipment. Measure PM compliance contribution from operator-performed tasks. Launch TPM Focused Improvement pillar with cross-functional loss elimination teams. Begin Skills Matrix development for all maintenance technicians. Target PM compliance above 90%.
Month 10–12
Continuous Improvement Embedding and Year 2 Target Setting
Full-year KPI review against baseline. Document OEE, MTBF, PM compliance, and maintenance cost improvement achieved. Present ROI to plant leadership. Extend Autonomous Maintenance to all production lines. Complete spare parts optimisation programme. Benchmark KPIs against FMCG sector peers. Set Year 2 targets and launch next improvement cycle with refined RCM analysis and expanded predictive maintenance routes.
Frequently Asked Questions
All Platform Features
Build Your Maintenance Excellence Framework on OxMaint
OxMaint provides every operational layer your excellence framework needs — from asset register and PM scheduling to predictive maintenance alerts, spare parts management, compliance audit trails, and real-time KPI dashboards. One platform. Every pillar. Used by FMCG maintenance teams across India, Southeast Asia, and the Middle East achieving 40–60% unplanned downtime reduction within 18 months.
40–60%
unplanned downtime reduction
3.8x
average ROI year one
12 Months
to full framework deployment
✓Equipment hierarchy and criticality ranking
✓PM scheduling with compliance tracking
✓Mobile work orders for plant floor teams
✓Spare parts inventory and consumption tracking
✓Real-time KPI dashboards and analytics
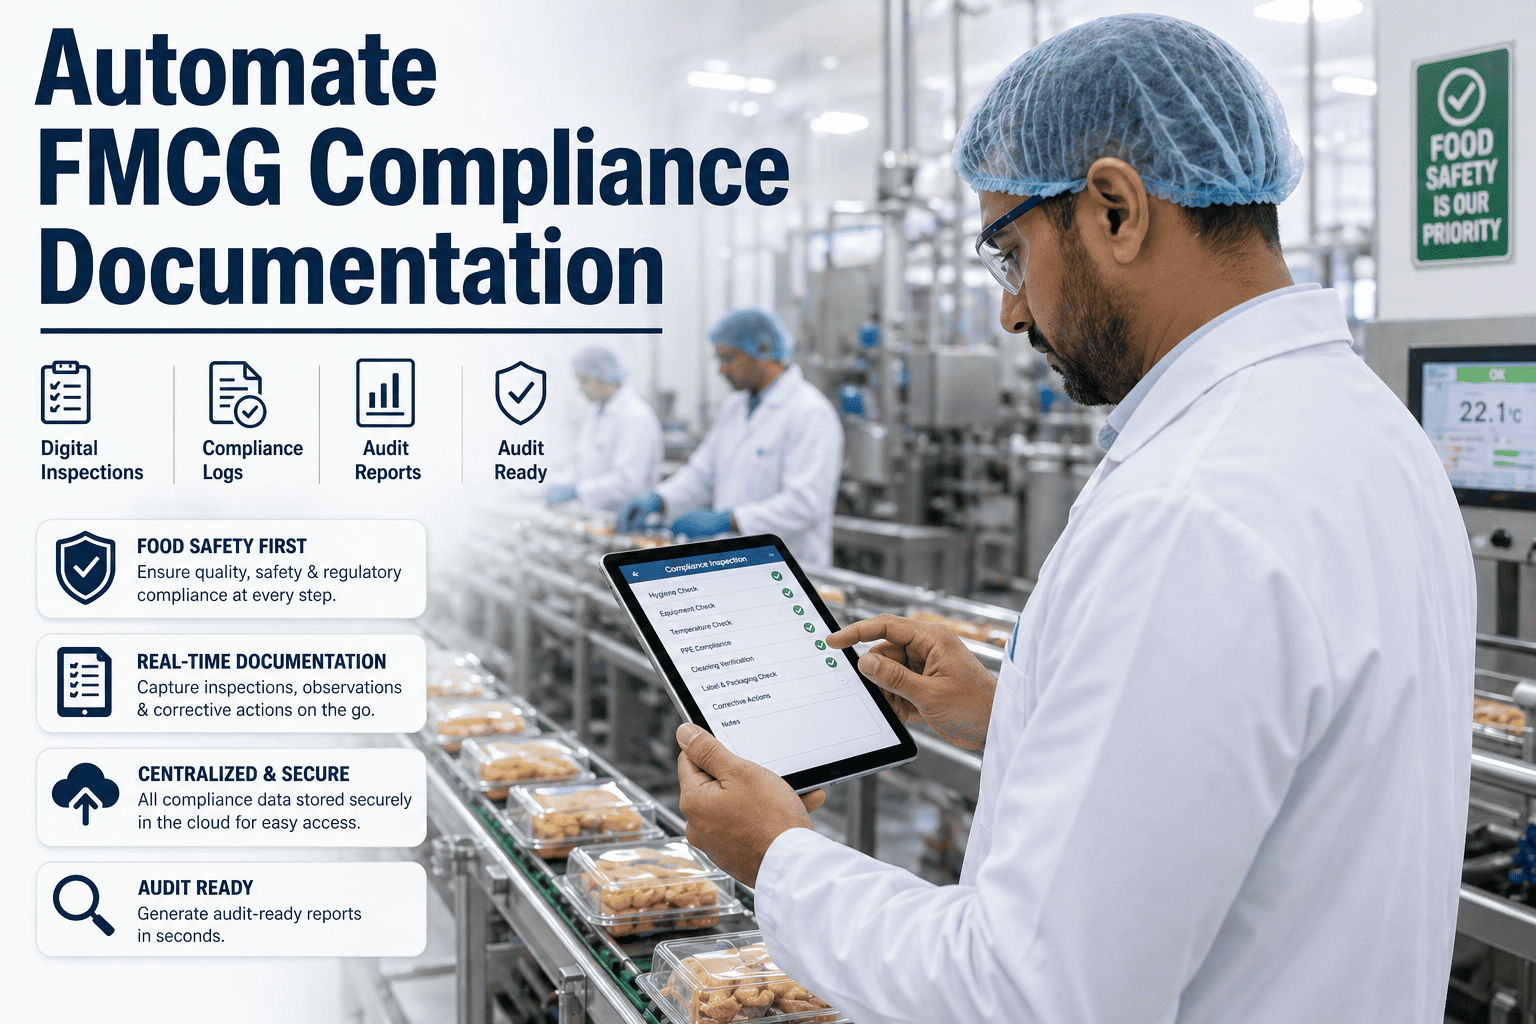
✓Tamper-evident audit trail for GMP compliance