Public works departments rarely have the budget or crews to maintain every asset equally, so something always waits. Asset criticality ranking decides what waits by scoring each asset on how badly its failure would hurt and how likely that failure is. The result is a defensible, repeatable order of priority instead of a list driven by the loudest complaint. This guide walks through scoring factors, a risk heat map, tiering, and a practical workshop process. It also shows how Oxmaint maintenance management software turns scores into scheduled work.
Asset Criticality Ranking for Public Works: Risk Scores
Rank assets by consequence and likelihood of failure, so limited maintenance budgets go where service impact is highest.
Why criticality ranking beats treating all assets equally
Equal treatment sounds fair but spreads thin effort across assets that matter very differently.
Equal-effort approach
- Same inspection interval for a spare pump and a sole-supply pump
- Backlog sorted by date submitted
- Priority set by who calls
- Capital requests argued case by case
Criticality-based approach
- Inspection effort scaled to consequence
- Backlog sorted by risk and age
- Priority set by documented criteria
- Capital requests supported by ranked lists
Consequence factors to score
Choose four to six factors that reflect your community. Weight them to reflect your policies, and document the reasoning.
| Factor | Question to ask | High score looks like |
|---|---|---|
| Public safety | Could failure injure people? | Risk of injury or loss of life |
| Service impact | How many customers lose service? | Large area or no alternate supply |
| Environmental harm | Could failure release pollutants? | Spill, overflow, or contamination risk |
| Regulatory exposure | Would a permit or rule be violated? | Reportable event or penalty risk |
| Financial cost | What would repair and recovery cost? | Major emergency repair and damage |
| Critical customers | Does it serve hospitals, schools, or emergency services? | Direct dependency by critical sites |
| Redundancy | Is there a backup or alternate route? | None, or backup is also aging |
Likelihood factors: how to estimate the chance of failure
Likelihood is harder to score because data is thinner. Use whatever evidence you have and record how confident you are.
The five-by-five risk heat map
Score consequence and likelihood from 1 to 5, multiply, and plot. The product places each asset on the map.
- Low: routine care, monitor
- Medium: planned preventive work
- High: priority plans and condition checks
- Extreme: immediate mitigation
Turn risk scores into scheduled work
Store criticality on every asset record and let it drive inspection frequency, work order priority, and backlog order.
From score to tier to maintenance strategy
Scores are most useful when they map to a clear response. Four tiers keep the system manageable.
| Tier | Risk level | Maintenance strategy | Review rhythm |
|---|---|---|---|
| Tier 1 | Extreme or high | Preventive plans, condition monitoring, critical spares, tested standby equipment | Monthly |
| Tier 2 | Medium to high | Scheduled preventive maintenance and periodic inspections | Quarterly |
| Tier 3 | Low to medium | Routine PM at longer intervals, repair as needed | Annually |
| Tier 4 | Low | Run to failure with basic checks where safe | At plan updates |
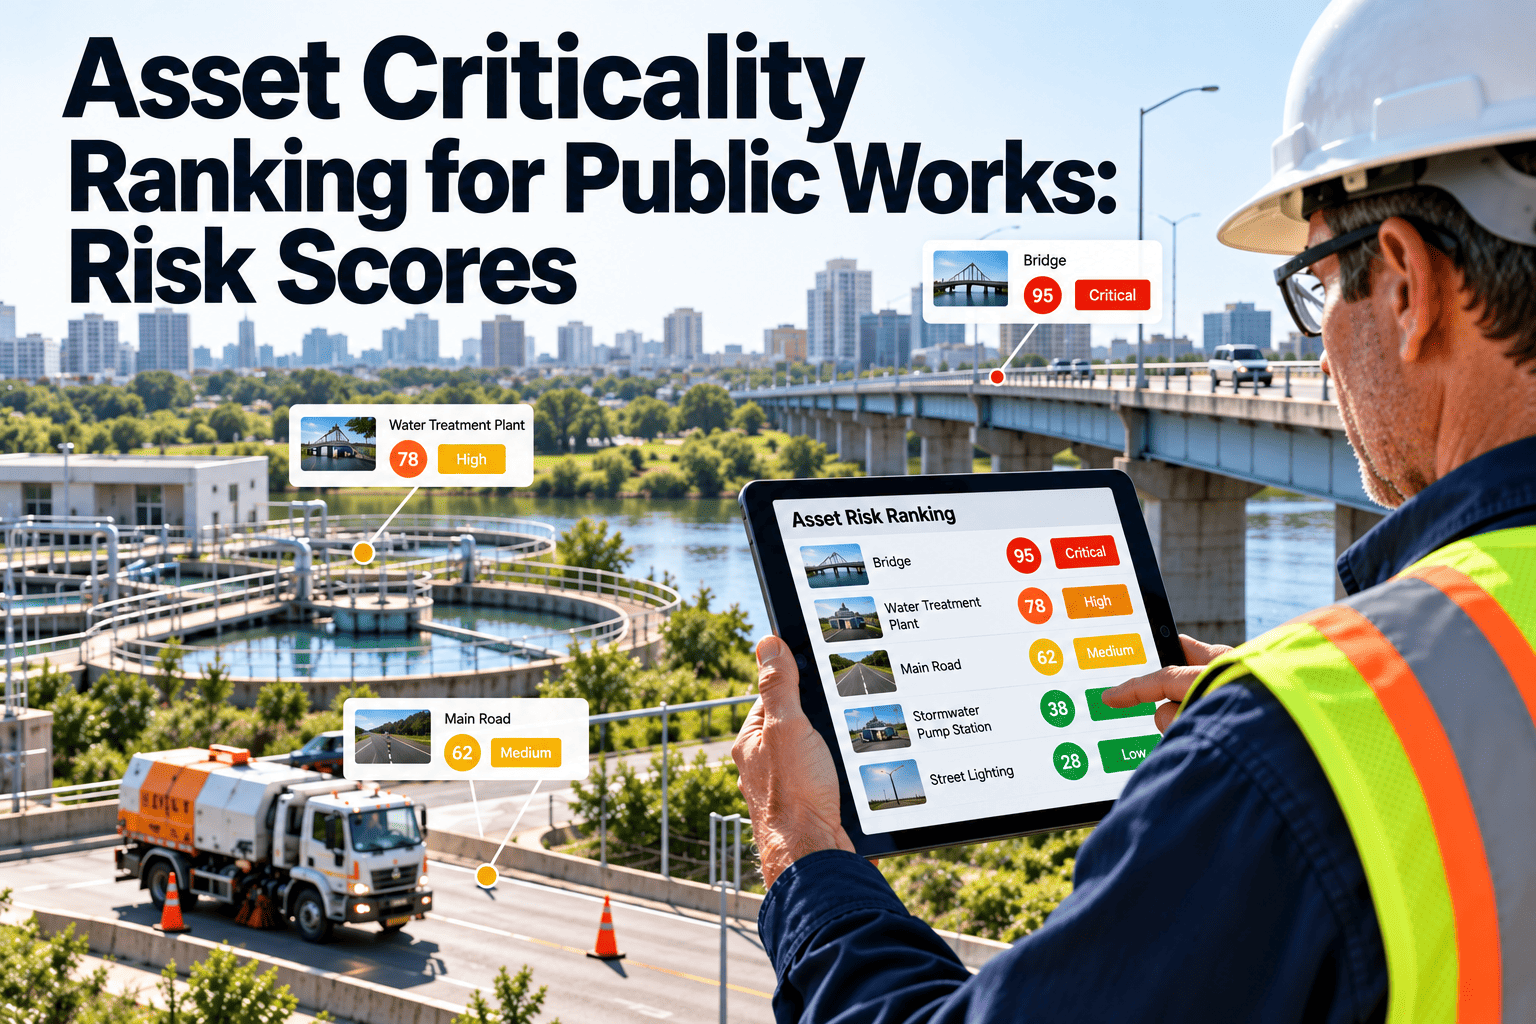
Illustrative ranking of five asset types
These scores are hypothetical and show how the method sorts assets. Your scoring will reflect your system.
Run a criticality scoring workshop
Scoring works best as a short facilitated session with operations, maintenance, and finance in the room.
- Agree the scaleWrite plain-language definitions for each score from 1 to 5.
- Group assetsScore asset groups first, then individual assets that stand out.
- Score independentlyLet participants score alone before discussing, to avoid anchoring.
- Discuss differencesSpend time where scores diverge and record the reasons.
- Record in the asset registerStore scores, date, and assessor against each asset.
- Link to workSet inspection frequency and priority from the tier.
Pitfalls that weaken a ranking
Most failures of criticality programs are process problems, not math problems.
- Scoring once and filing it. Conditions change, so schedule reviews and rescore after major failures or upgrades.
- Too many factors. Long scorecards create fatigue and false precision. Keep it simple.
- Ignoring redundancy. A critical asset with a healthy standby may carry less risk than its label suggests.
- Hiding uncertainty. Record confidence so low-data scores get checked first.
- Disconnected from work. If tiers do not change inspection or priority, the exercise is decoration.
How Oxmaint puts criticality to work
Oxmaint is maintenance management software. It carries the ranking into daily scheduling and reporting.
KPIs to confirm the ranking is working
Measure outcomes by tier, so you can see whether effort is following risk.
Tier 1 PM compliance
Tier 1 tasks done on time ÷ Tier 1 tasks dueCritical backlog age
Average days open for Tier 1 and Tier 2 work ordersUnplanned failures in Tier 1
Count of reactive events on top-tier assets per periodScoring coverage
Assets with a current criticality score ÷ total assetsAsset criticality ranking FAQs
Should we score every individual asset?
Not at first. Score asset groups, then break out individual assets that clearly differ in consequence.
How often should criticality be reviewed?
Review annually, and rescore after major failures, system changes, or new regulations.
Is a 1 to 5 scale required?
No. Any consistent scale works if definitions are written down and applied the same way.
Can criticality ranking reduce maintenance cost?
It can focus effort where it matters. Book a demo to see risk-based scheduling.
Where should we record the scores?
In the asset register, so scheduling can use them. Create an account to try it.
Write the consequence scale in plain language
A score of 4 should mean the same thing to every scorer. Write the definitions down before anyone scores an asset.
What high criticality looks like across departments
Use these examples to calibrate scorers from different departments, so scores are comparable.
Special cases that need judgment
A pure formula will miss some situations. Write rules for the common exceptions.
- Assets with redundancy. Score consequence on the assumption that the standby works, but also test the standby, since an untested backup is not protection.
- Linear assets. Pipes and roads vary along their length, so score segments, not whole networks, where data allows.
- Shared assets. Equipment used by several departments needs an agreed owner and a score that reflects all dependents.
- Unknown condition. Give a moderate likelihood score with low confidence, and schedule an inspection to replace the guess.
- Seasonal assets. Plows, irrigation, and pools carry high consequence at certain times. Note the season in the record and plan work ahead of it.
- Safety-critical items. Where a legal duty applies, treat the asset as high priority regardless of the calculated score.
Using risk scores in budget decisions
Scores earn their keep when they shape what gets funded and scheduled.
- Rank the registerSort assets by risk score and review the top group for accuracy.
- Choose treatmentsDecide whether each high-risk asset needs inspection, repair, rehabilitation, or renewal.
- Estimate cost and risk reductionCompare how much each treatment lowers the score against its cost.
- Fund by valueSelect projects that give the largest reduction in risk for the money available.
- Schedule the workConvert approved treatments into work orders with owners and dates.
- Rescore after treatmentUpdate the register so improvement is visible and the ranking stays current.
When to rescore, and when to leave it alone
Constant rescoring wastes effort. Rescoring only on the calendar misses real change.
Rescore when
- A major failure or near miss occurs
- A new inspection changes known condition
- Demand, customers, or land use change
- Regulations or permit limits change
- Redundancy is added or removed
Leave it as is when
- Only minor routine maintenance occurred
- Complaints rose without new evidence
- A single reading falls within normal range
- The next scheduled review is close
Worked scoring example: a lift station
This hypothetical walk-through shows how evidence turns into scores. Your own asset data will change the numbers.
| Factor | Evidence gathered | Score |
|---|---|---|
| Public safety | Overflow would reach a street used by pedestrians | 3 |
| Service impact | Serves a neighborhood of several hundred homes with no alternate route | 4 |
| Environmental harm | Wet well sits near a creek, so an overflow could reach surface water | 5 |
| Regulatory exposure | An overflow would be a reportable event under the permit | 4 |
| Redundancy | Two pumps, but the standby has not been run under load for a year | 4 |
| Consequence result | Highest factor is 5, and the group agreed to score the station 5 given the creek | 5 |
| Likelihood | Duty pump has had two seal repairs in two years and rising amperage readings | 4 |
| Risk score | 5 × 4 | 20 |
Data you need to score likelihood well
Likelihood scores are only as good as the evidence behind them. Gather these sources before the workshop.
- Work order history. Count repairs by asset and failure cause over several years. Repeat failures are among the strongest signals available.
- Inspection and test reports. Condition surveys, vibration readings, pipe inspections, and pavement tests provide direct evidence of deterioration.
- Age and material. Install year and material give a baseline expected life, even if condition can differ widely from the average.
- Operating conditions. Load, duty cycle, corrosion exposure, and environmental stress shorten life for some assets more than others.
- Manufacturer guidance. Service intervals and expected life ranges help identify equipment that is overdue for rebuild or replacement.
- Operator knowledge. Experienced staff often know which assets are temperamental. Capture that knowledge and record it as judgment-based evidence.
Linking criticality to the work order system
A score that lives only in a spreadsheet will not change behavior. Wire it into everyday work.
Point limited crews at the highest risk first
Rank your assets, link tiers to schedules, and keep a clear record of why each priority was set.