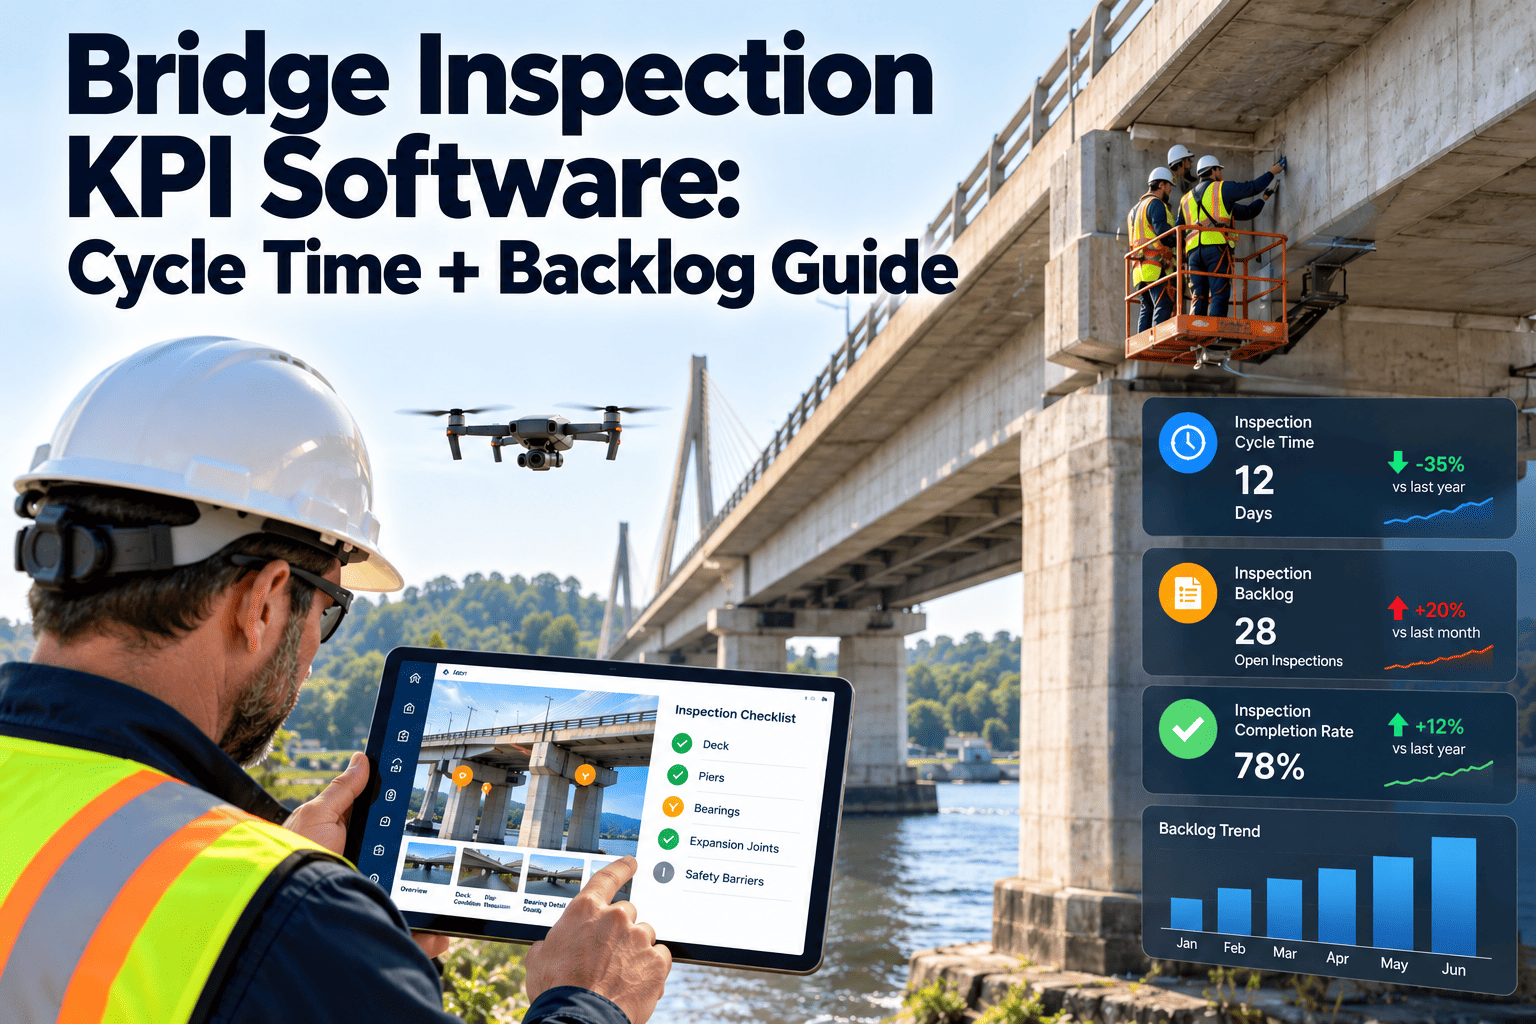
A bridge program can complete every inspection on its calendar and still have a weak safety record. The inspection may be on time while the report takes months to reach the owner, critical findings wait in an inbox, and repairs sit unassigned. State DOTs and local agencies need measures that follow the whole chain from field visit to closed repair. This guide covers the KPIs that matter most, how to define them, and how a CMMS can calculate them from real work records instead of spreadsheets compiled at the end of the quarter.
Bridge Inspection KPI Software: Measure Cycle Time, Backlog Aging and Finding Closure
Why Bridge Programs Need More Than a Compliance Percentage
Federal rules under the National Bridge Inspection Standards set minimum expectations for inspection frequency, qualified personnel, reporting and follow-up of critical findings. The 2022 update strengthened requirements for load rating, underwater and fracture critical inspections and quality programs.
What compliance tells you
What compliance hides
KPIs fill that gap. They allow supervisors to see where time is lost and which districts, consultants or structure types need attention.
The Three Core KPIs
- Scheduled date to field completion
- Field completion to report submission
- Submission to review approval
- Approval to work order creation
- Open findings by age band
- Overdue inspections by structure type
- Oldest open critical items
- Age by district or owner
- Closed on time versus late
- Reopened or repeat findings
- Closure by defect category
- Planned versus emergency repair split
Cycle Time: Where the Days Disappear
Cycle time is most useful when split into stages. A single overall number hides the stage that needs correction.
Scheduling
Field work
Report drafting
Review
Action
Practical improvement levers
- Collect findings on mobile devices during the inspection
- Require photos and ratings before a form can be submitted
- Route review automatically based on defect severity
- Send critical findings to a named owner immediately
See Your Bridge Cycle Time by Stage, Not Just in Total
Backlog Aging: Finding the Items That Stay Too Long
Backlogs are normal. Unmanaged backlogs are the problem. Aging bands show how risk accumulates in the oldest items.
| Finding priority | Example aging band | Review question |
|---|---|---|
| Critical | Days, tracked continuously | Was the owner notified, and are safety actions documented? |
| High | Under 90 days, then 90 to 180 | Is there a funded work order? |
| Medium | Under 1 year, then 1 to 2 years | Can it be bundled with other work? |
| Low | By inspection cycle | Has the condition changed since last inspection? |
Bands must be set by your agency policy. The values above are examples for structuring a report, not regulatory limits.
Useful aging cuts
- By district, region or maintenance yard
- By component such as deck, bearings, joints, substructure and scour
- By ownership: state, county, city or railroad
- By whether a load posting or restriction is active
Finding Closure Rate: From Observation to Verified Repair
Closure should require evidence. A finding closed with no photo, no work record and no verification will resurface and distort the KPI.
Common closure measures
- Percentage closed within target for each priority
- Median days from finding to work order
- Median days from work order to completion
- Repeat finding rate on the same component
Reading the KPIs Together
How Oxmaint Supports Bridge KPI Reporting
Asset records
Mobile inspections
Scheduling
Work orders
Dashboards
Inventory
Data quality still depends on process. The software provides structure, but supervisors must define fields, targets and review rules.
Setting Up a KPI Program: A Phased Approach
Data Definitions That Make KPIs Trustworthy
A KPI is only as reliable as its definition. If two districts count a finding as closed at different moments, comparison becomes meaningless. Agree on clear events before building dashboards.
| Term | Recommended definition | Common pitfall |
|---|---|---|
| Inspection complete | Field work finished and data entered | Counting the date the report was approved |
| Report submitted | Report sent for quality review | Using draft save dates |
| Finding opened | Date the defect was first recorded | Resetting the date at the next inspection |
| Finding closed | Repair verified with evidence | Closing when a work order is created |
| Overdue | Past the allowed inspection interval for that structure | Ignoring structures with shorter special intervals |
Why consistent timestamps matter
- They allow cycle time to be split by stage
- They support fair comparison across districts and consultants
- They give auditors a clear sequence of events
- They show whether process changes actually helped
Special Inspection Types and Their KPI Needs
Fracture critical members
Underwater inspections
Scour critical structures
Complex or movable bridges
Load posted bridges
Culverts and small structures
Critical Findings: The Fastest KPI That Matters
Critical findings require prompt action under federal bridge inspection requirements, including notification and follow-up. Most agencies track these on a separate, tighter clock than routine findings.
Measures to review each week
- Number of critical findings currently open
- Time from field flag to engineer decision
- Time from decision to mitigation in place
- Critical findings without a documented action plan
Confirm exact requirements with your state DOT bridge manual and federal regulations, since terms and timelines depend on the finding and structure type.
Common Reasons Bridge KPIs Fail
Using KPI Results for Budget and Planning
Once KPIs are stable, they support better decisions. Aging by component shows where deterioration accumulates, and closure data shows whether crews or contracts limit throughput.
- Use backlog aging by component to justify preservation programs such as joint replacement or deck sealing
- Use closure rate by crew or contractor to balance workload
- Use repeat findings to challenge repair methods and materials
- Use cycle time by stage to decide where to add review capacity
- Use district comparisons to share practices from stronger teams
The aim is not to rank people but to find system constraints. Share results regularly and agree on actions, so measurement leads to improvement.
Example Monthly KPI Review Agenda
Dashboards only help when someone acts on them. A short, regular review turns numbers into decisions and keeps accountability visible.
Record decisions and owners in the system so the next review starts from facts, not recollection.
Local Agencies and Consultants: Extending KPIs Beyond the State
Many state programs rely on consultants and local owners for a large share of inspections. KPIs lose value if they only cover in-house teams.
- Give consultants access to mobile forms with the same required fields as staff
- Measure submission time and quality review returns by consultant firm
- Track local owner response to findings on county and city bridges
- Share aging and closure reports with local partners to support funding conversations
- Keep ownership and contact data current so notifications reach the right person
- Include contract terms, such as required report turnaround, in the measures you monitor
Practical benefit
Practical benefit in budgeting
Mobile Field Capture and Its Effect on Cycle Time
Much of the delay between field work and report approval comes from re-entering notes, sorting photos and chasing missing fields. Capturing structured data at the bridge removes several of those steps.
- Inspectors select the component and defect type from a controlled list instead of typing free text
- Required fields prevent submission of incomplete findings, which cuts review returns
- Photos attach to the finding at the moment of capture, so they stay linked to the right element
- Offline use matters for rural crossings and below-deck work with poor coverage
- Supervisors see progress during the inspection day, not weeks later
Measure the effect directly. Compare field-to-submission time before and after mobile forms, and track how often reports are returned for missing data.