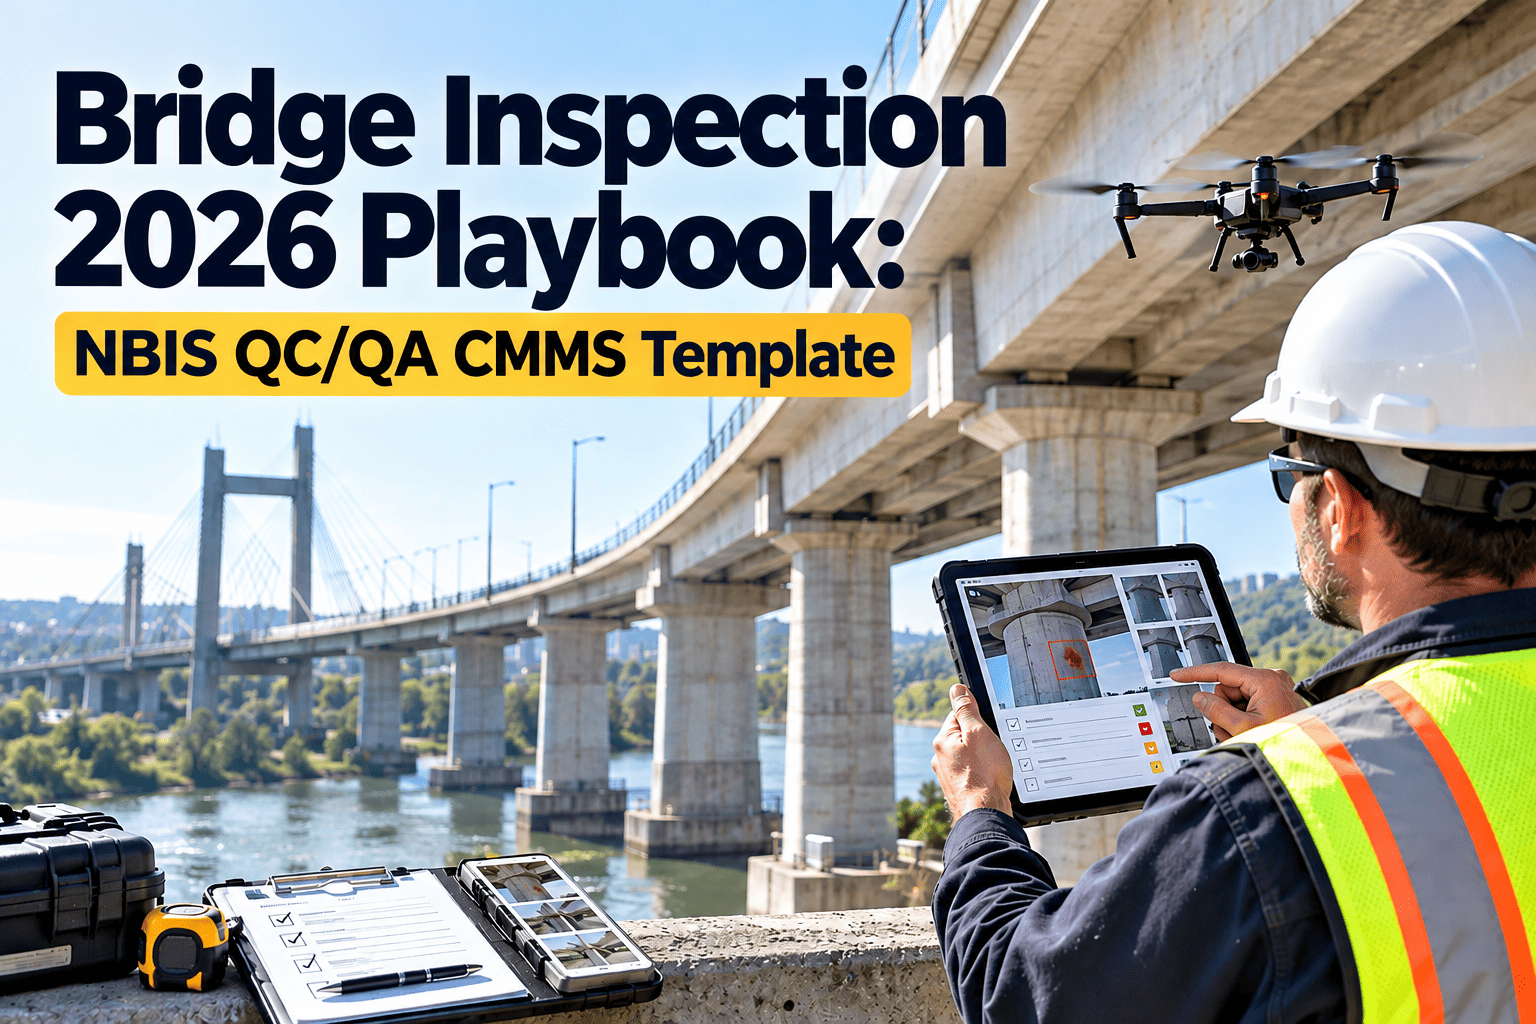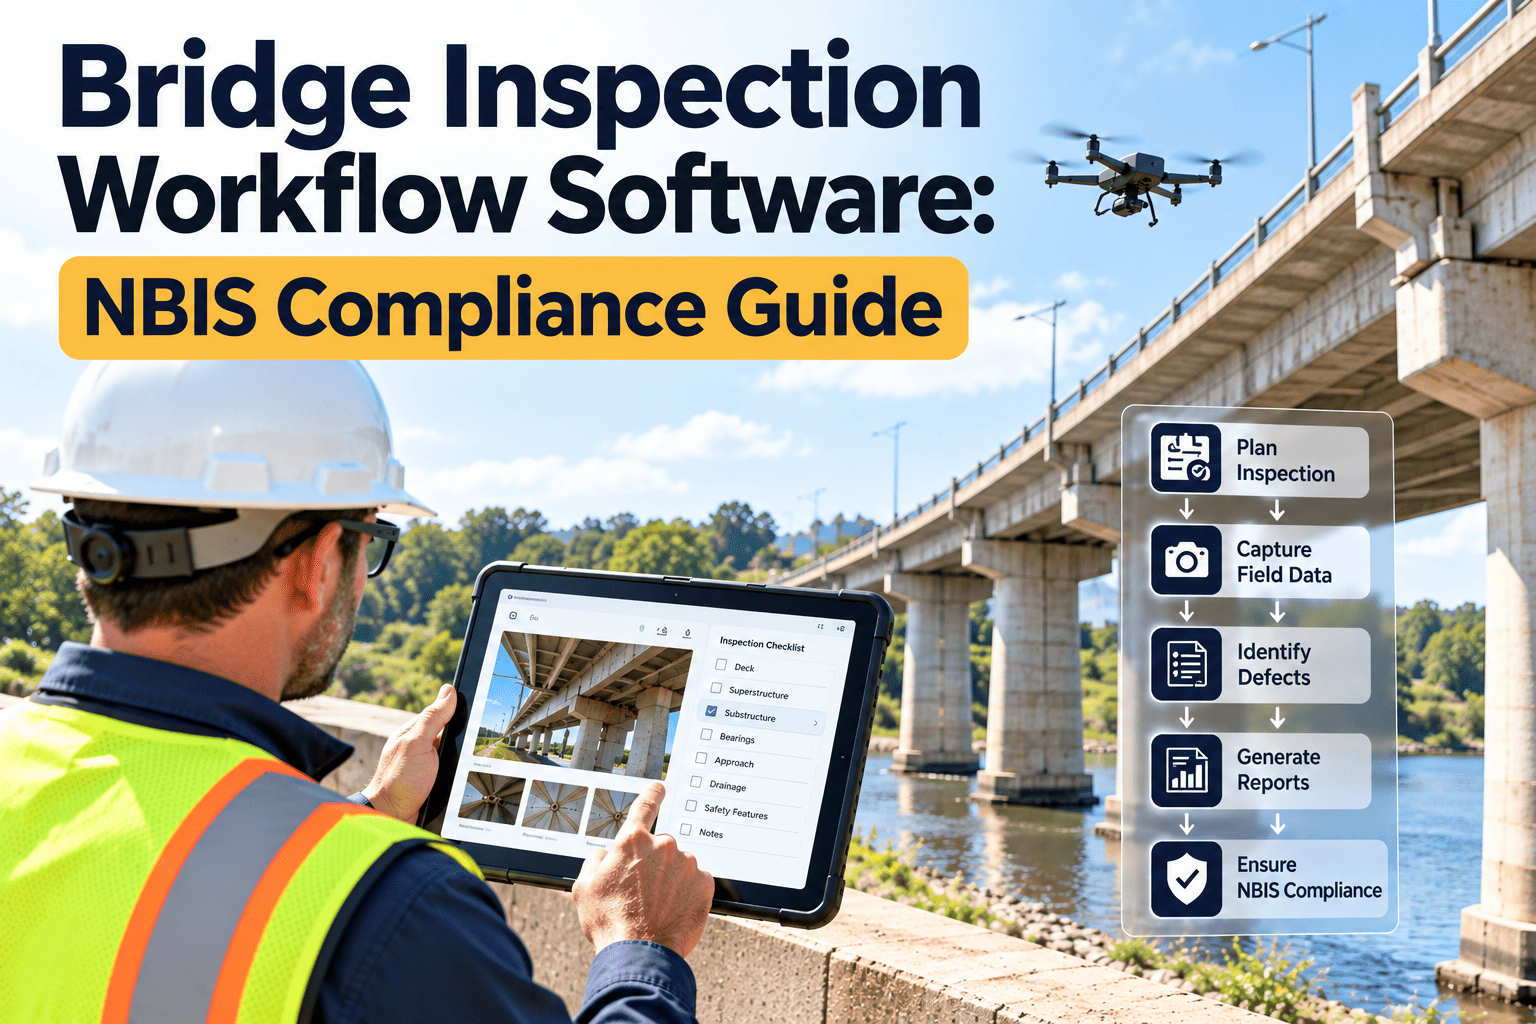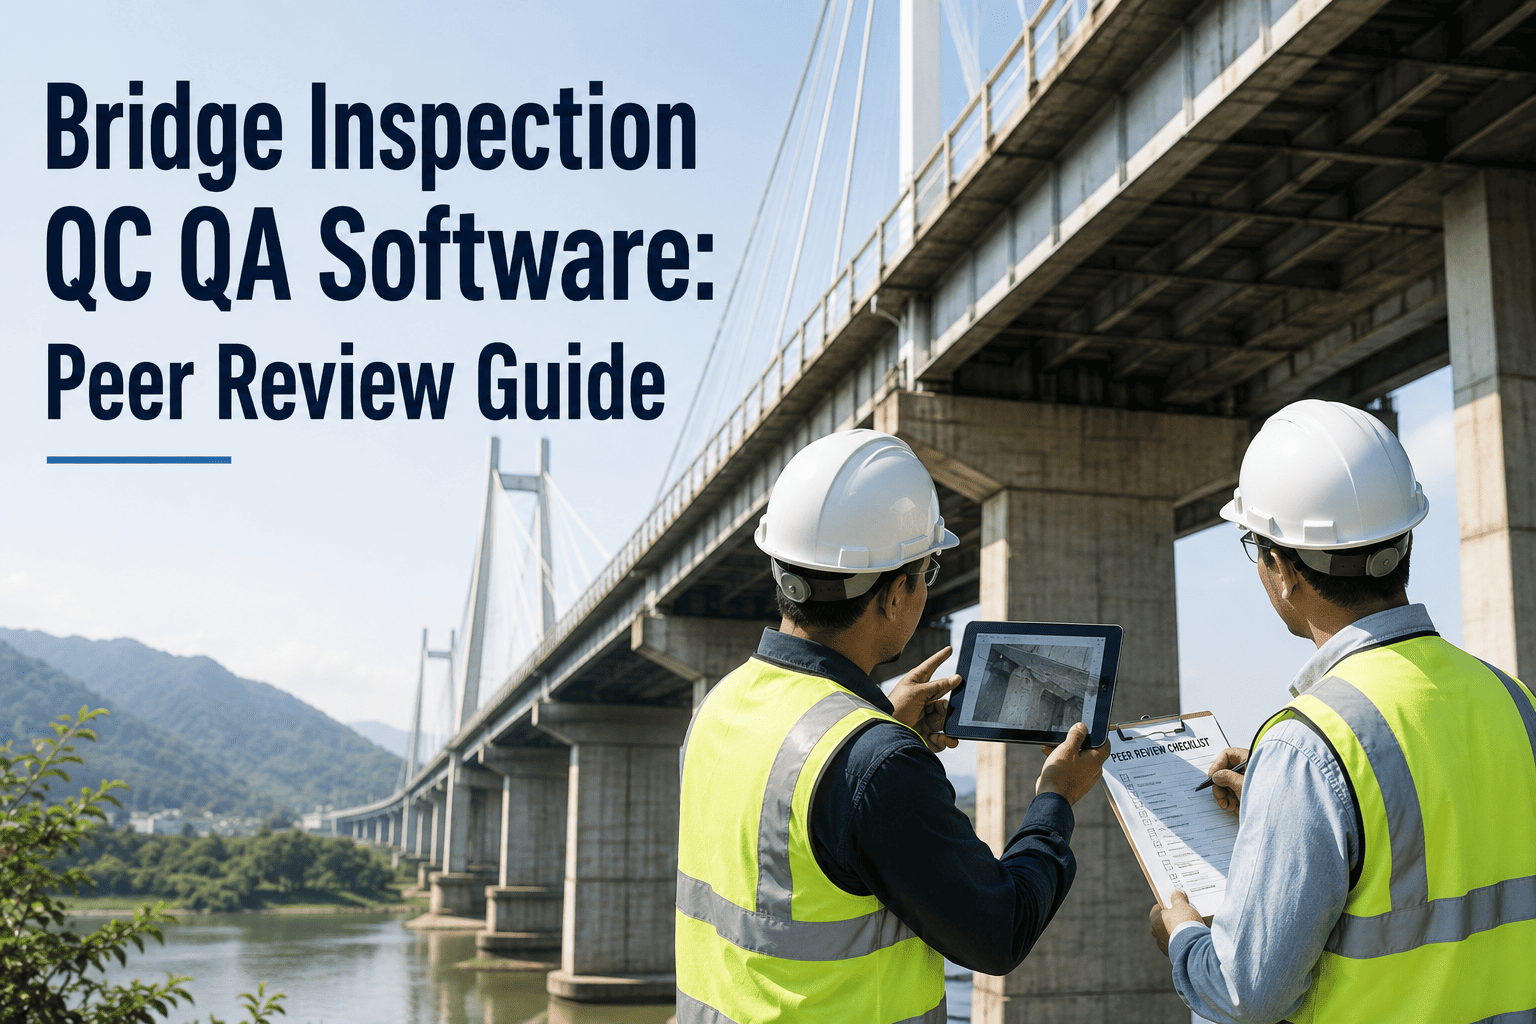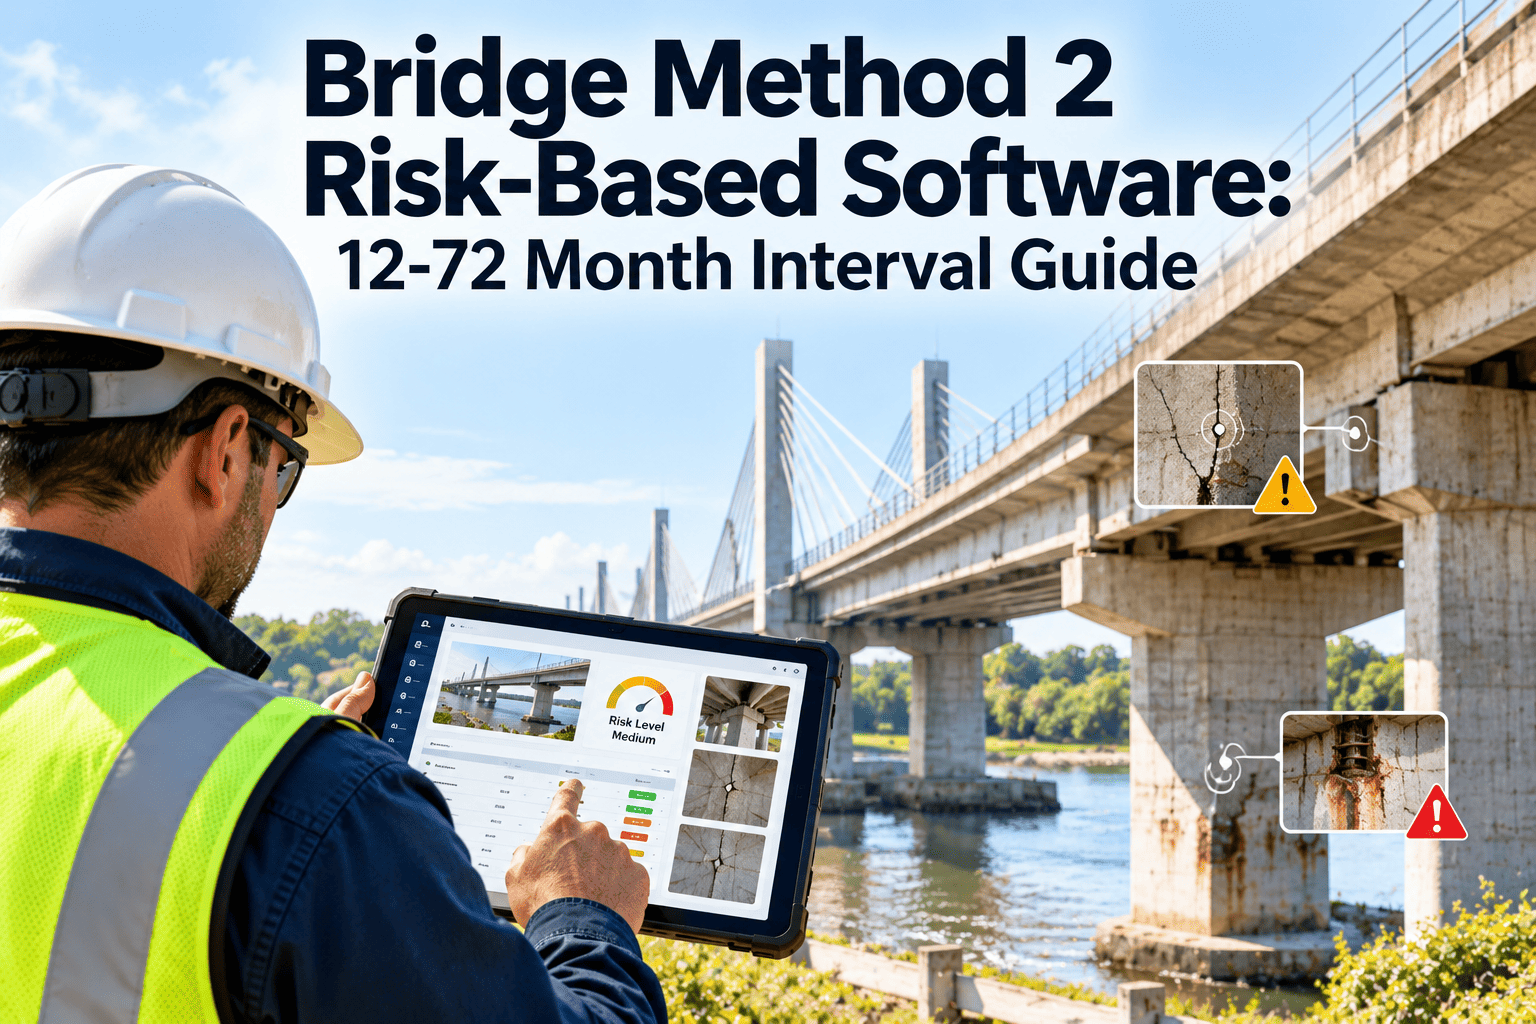
The 2022 update to the National Bridge Inspection Standards gave bridge owners a choice in how they set inspection frequency. Instead of one fixed interval for every structure, an agency can use a documented, risk-based approach known as Method 2, where interval assignments are made through a risk assessment panel, or RAP. That flexibility only helps if each decision is recorded, repeatable, and tied to inspection data. This guide explains how Method 2 intervals of 12, 24, 48, and 72 months are assigned and how a CMMS keeps the process defensible. If you are planning that program, you can create an Oxmaint account to model your inventory.
Bridge Method 2 Risk-Based Software: 12-72 Month Interval Guide
Handle risk-based inspection intervals under NBIS 2022 with RAP documentation, interval tracking, and inspection scheduling in one system.
Method 1 versus Method 2 at a glance
| Item | Method 1 | Method 2 (risk-based) |
|---|---|---|
| Basis for interval | Standard fixed schedule | Assessed likelihood and consequence of defects |
| Decision maker | Program rules | Risk assessment panel using documented criteria |
| Interval range | Standard frequency, commonly 24 months for routine inspections | Shorter or longer assignments, for example 12, 24, 48, or 72 months depending on inspection type |
| Documentation need | Inspection reports | Reports plus the risk rationale for each assignment |
| Review trigger | Calendar | Calendar plus any change in condition or risk |
Interval limits differ by inspection type, such as routine, underwater, and fracture-critical member inspections. Confirm exact allowances and approval steps in 23 CFR 650.311 and with your FHWA division office.
How the RAP process works
Assemble the panel
Include experienced bridge inspectors, engineers, and agency decision makers.Define risk criteria
Set how likelihood of defect progression and consequence of failure are scored.Screen the inventory
Group bridges by type, age, condition, material, traffic, and detour length.Assign intervals
Record the interval and the reasoning for each bridge or bridge group.Monitor and revisit
Re-evaluate when new inspection data, damage, or loading changes the risk.
Factors a panel typically weighs
Likelihood side
- Current condition ratings of deck, superstructure, and substructure
- Deterioration rate seen across past inspections
- Material and structure type, including details with known fatigue or corrosion history
- Scour susceptibility and channel behavior
- Environmental exposure, including deicing salts
Consequence side
- Traffic volume and truck share
- Detour length and emergency route role
- Redundancy of the structural system
- Presence of fracture-critical members
- Over-water or over-rail location
Document every interval decision
Illustrative interval assignment matrix
This matrix shows how likelihood and consequence can combine. Your panel defines the real scoring and limits.
| Consequence / Likelihood | Low likelihood | Medium likelihood | High likelihood |
|---|---|---|---|
| Low consequence | Longest interval allowed | Mid-length interval | Standard interval |
| Medium consequence | Mid-length interval | Standard interval | Shorter interval |
| High consequence | Standard interval | Shorter interval | Shortest interval, 12 months or less |
Intervals shown are descriptive. Do not lengthen any interval without documented panel approval and the agency approvals your program requires.
What the software has to track
- The interval assigned to each bridge and the inspection type it applies to
- The date, panel members, and rationale behind each assignment
- Next due date calculated from the last completed inspection
- Triggers that force reassessment, such as a condition rating drop or a damage event
- Links between inspection findings, critical findings, and follow-up work orders
- Reports showing compliance with scheduled inspection dates across the inventory
Common Method 2 pitfalls
How Oxmaint supports risk-based inspection programs
- Asset management for bridge inventory, elements, and inspection history
- Inspection scheduling by assigned interval with due-date visibility
- Mobile inspections with photos, element notes, and condition entries
- Work orders for repairs, critical findings, and follow-up inspections
- Compliance records and dashboards for overdue inspections by owner or region
Oxmaint supports your process but does not replace engineering judgment or the required approvals.