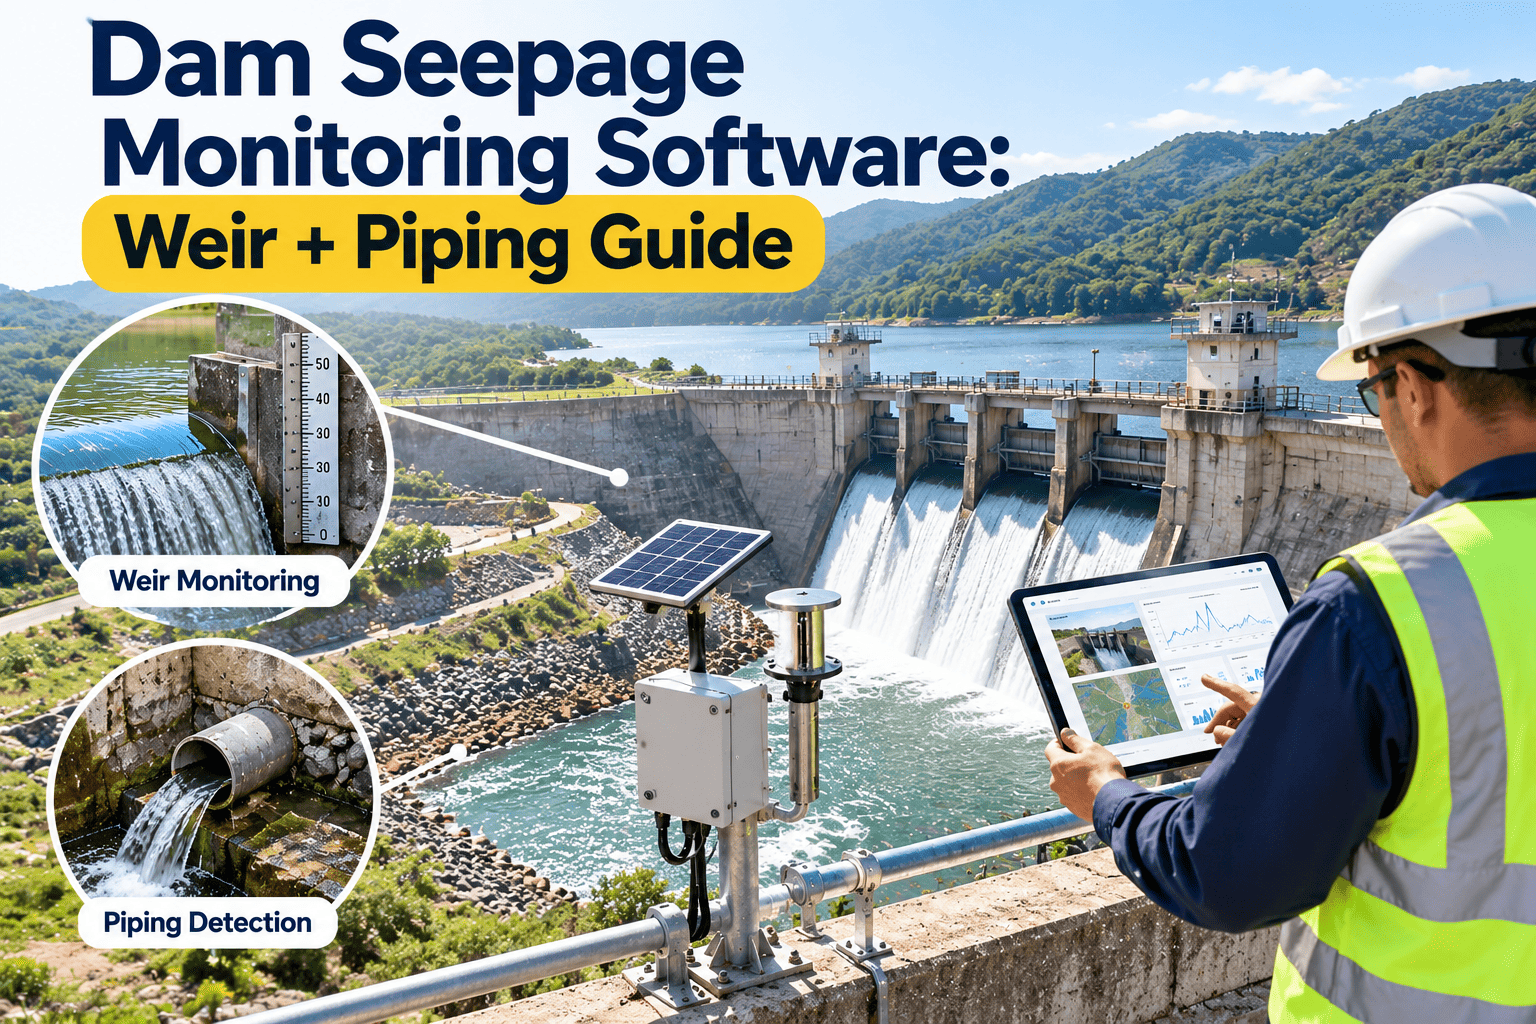
Seepage is the one dam behavior that is always present and only occasionally dangerous. Every embankment and foundation passes some water, so the real task of a monitoring program is separating steady, expected flow from flow that is changing for the wrong reason. This guide shows how weir readings, collector trends, and piping risk indicators fit into one defensible record, and how dam seepage monitoring software such as Oxmaint's maintenance platform keeps those readings tied to inspections and work orders.
Dam Seepage Monitoring Software: Weir and Piping Guide
Weir flow, seepage collector trends, and piping risk indicators belong in one asset record that high-hazard dam owners can defend. See how a CMMS turns seepage readings into scheduled inspections, flagged changes, and documented follow-up.
Why Seepage Records Fail Before the Dam Does
Most seepage programs do not fail because a reading was missed. They fail because the readings live in places that cannot be compared with each other when it matters.
Scattered records
- Weir heads written in a field book
- Collector flow in a spreadsheet one engineer maintains
- Pool level stored in a separate gage log
- Wet-spot photos left on a personal phone
- Piezometer data buried in a consultant report
- Weir cleaning done, but never recorded
One seepage record
- Every monitoring point sits under its dam in one hierarchy
- Each reading stores pool level, date, and observer
- Photos and notes attach to the inspection that found them
- Weir and collector maintenance is a tracked work order
- Out-of-pattern readings are flagged for engineer review
- The history is ready for an inspector or regulator
How a Weir Turns Seepage Into a Number
A seepage weir is a simple, reliable flow meter. Water passes through a notch, the height of water above the notch is measured, and a standard equation converts that head to flow. Common notch shapes include triangular (V-notch), rectangular, and trapezoidal.
| Measuring method | Typical use | Main reading risk | What the record should hold |
|---|---|---|---|
| V-notch weir | Small to moderate seepage, where sensitivity at low flow matters | Flow rises roughly with the 2.5 power of head, so a small head error becomes a larger flow error | Notch angle, gage zero check, head, computed flow |
| Rectangular weir | Larger or more variable flows | Less sensitive at very low head, contraction and approach effects | Crest length, approach condition, head, computed flow |
| Trapezoidal weir | Moderate to larger collector flows | Sediment or debris in the approach pool | Dimensions, cleaning date, head, computed flow |
| Volumetric (bucket and timer) | Very small flows at a pipe outlet | Timing error and inconsistent technique | Volume, time, observer, repeat count |
| Pressure transducer with logger | Continuous record at a weir pool | Sensor drift and fouling | Calibration date, manual cross-check, data gaps |
Weir condition is part of the reading
If silt builds up behind the notch, the reading drifts without any change in seepage. That is a maintenance problem that looks like a dam problem, and it deserves its own checks.
- Notch plate edge is sharp, level, and undamaged
- Approach pool is free of sediment, algae, and vegetation
- Staff gage or transducer zero was verified against the notch crest
- Water falls freely past the plate with air under the nappe
- No backwater from downstream vegetation or debris
- Reading is taken at the intended distance upstream of the notch
Reading Seepage Against Reservoir Level
Seepage is rarely meaningful on its own. It responds to reservoir elevation, often with a lag, and can also move with rainfall, groundwater, and season. The useful comparison is flow at a matched pool level over time.
A software record makes this practical because pool level is stored beside every seepage value. Plotting flow against elevation, rather than against date alone, is what exposes slow change that a calendar chart hides.
Piping Risk Indicators: Read the Combination
Piping, a form of internal erosion, happens when flowing water carries soil particles out of an embankment or foundation. It is progressive and often hidden, so indicators matter more than any single number. National guidance such as FEMA P-1032 on seepage and internal erosion frames monitoring around this idea.
| Trend at matched pool level | Seepage clear | Seepage cloudy or carrying fines |
|---|---|---|
| Flow steady | Continue routine monitoring | Investigate promptly; fines transport is a warning sign |
| Flow increasing | Verify weir, then request engineer review | Escalate to the dam safety engineer immediately |
| Flow suddenly decreasing | Check for a blocked collector or drain before assuming improvement | Escalate; possible blockage with ongoing soil movement |
This grid is an illustrative triage aid. Actual thresholds and responses come from the owner's dam safety engineer and the dam's own monitoring plan.
Other indicators worth logging at every visit
- New wet areas, soft ground, or vegetation change near the toe or abutments
- Boils or sand deposits around drain outlets
- Sinkholes, depressions, or cracking on the crest and slopes
- Rising or unusual piezometer levels near the downstream face
- Muddy water leaving the collector or downstream channel
- Animal burrows and tree roots near seepage paths
The Response Ladder: From Reading to Action
A reading only protects the dam if it triggers something. Define the ladder in advance so a technician does not have to decide alone what an odd number means.
Put Every Seepage Reading in One Defensible Record
Start tracking weir flow, collector condition, and inspection findings against each dam, so a change in seepage never depends on one person's memory.
Collectors, Toe Drains, and Relief Wells Are Assets Too
The weir only reports what the drainage system delivers. If a drain clogs, flow can fall while pressure behind it rises, which is the opposite of good news. Drainage components need their own maintenance plan.
- Register each collector pipe, manhole, cleanout, toe drain, and relief well as an asset under the dam.
- Schedule cleaning and camera or flow checks on a frequency set by the engineer.
- Record outlet condition at every round, including sediment, iron staining, and flow clarity.
- Open a corrective work order for blockages, damaged outlets, or silted weir pools.
- Close the order with photos and a follow-up reading so the effect on seepage is visible.
What the Oxmaint Record Holds for Each Seepage Point
Oxmaint is a maintenance management system, not a replacement for engineering judgment. Its role is to hold the record, run the schedule, and make sure follow-up actually happens.
| Capability | How it supports seepage monitoring |
|---|---|
| Asset management | Dam, monitoring point, weir, collector, and drains organized in one hierarchy |
| Inspections | Mobile checklists with readings, clarity notes, and photos captured at the weir |
| Preventive maintenance | Recurring weir cleaning, gage verification, and drain flushing scheduled by interval |
| Work orders | Corrective jobs created from a flagged reading and closed with evidence |
| Condition-based workflows | Review triggers when a value leaves the engineer-defined band |
| Reporting and dashboards | Trend views and exportable history for engineers and regulators |
Compliance and Inspection Cadence
Requirements differ by state and by dam hazard classification, but high-hazard dams generally face routine inspections, formal periodic reviews, and a maintained Emergency Action Plan. Seepage records are central evidence in all of them.
- Annual inspection reports referencing seepage observations
- Periodic or comprehensive reviews that cite instrumentation history
- Evidence that flagged readings were investigated and closed
- Calibration and maintenance history for weirs and loggers
- Emergency Action Plan contacts and notification records
Common Data Mistakes That Hide Real Change
Seepage trends are easy to misread when the record is inconsistent. These are the errors that most often turn a useful dataset into noise.
| Mistake | Effect on the trend | Practical fix |
|---|---|---|
| Pool level not recorded with the reading | Flow cannot be compared at matched elevation | Make pool level a required field on the inspection form |
| Weir pool never cleaned | Head creeps upward and flow looks like it is rising | Schedule weir cleaning as a recurring preventive task |
| Different observers use different methods | Step changes appear when staff rotate | Use one checklist with a fixed reading procedure |
| Clarity noted in free text only | Turbidity cannot be trended or searched | Use a short pick list: clear, slightly cloudy, carrying fines |
| Flagged readings never closed | No proof the change was ever investigated | Require a work order outcome before the flag clears |
Operational Impact of a Weak Seepage Program
The cost of poor seepage records shows up in three places: slower decisions during high water, expensive consultant time spent reconstructing history, and weaker standing in front of a regulator.
A Realistic First 30 Days
You do not need every historical reading loaded before you gain value. Start with structure, then build the habit of clean readings going forward.
- Build the hierarchy for one high-hazard dam: monitoring points, weirs, collectors, drains, and instruments.
- Load the engineer's expected seepage bands and the key piezometer references as reference notes.
- Create the weir reading checklist with pool level, head, clarity, photos, and weir condition fields.
- Set preventive tasks for weir cleaning, gage verification, and drain outlet checks.
- Run two full rounds, review the flagged items with the engineer, and tune the review rules.
An Annual Seepage Review Cycle
Seepage behavior has a seasonal rhythm. Organizing review work around it keeps attention where the dam is most stressed.
Connecting Seepage to Piezometers and Visual Findings
Weir flow is one lens. Piezometers describe pressure inside the embankment, and visual inspection describes what the surface is doing. Piping concerns usually become credible when two or three of these tell the same story.
- Weir flow rising while downstream piezometers also rise at the same pool level
- Clear flow with a new wet patch at the toe in the same area as a drain outlet
- Turbid seepage that coincides with a settlement or sinkhole observation on the crest
- Flow dropping while piezometric levels climb, suggesting a clogged drain
Keeping these observations under the same dam record means the engineer sees the whole pattern in one view rather than three separate reports.
Automation Helps, but Weirs Still Need Hands
Data loggers, pressure transducers, and telemetry can raise reading frequency and catch fast changes during storms or rapid drawdown. They also add new assets that drift, foul, and lose power.
Risks of automation alone
- Silted weir pools still give confident-looking numbers
- Sensor drift goes unnoticed without manual cross-checks
- Alarms without a work order process get ignored
Automation inside a maintenance program
- Logger calibration scheduled like any other asset task
- Periodic manual readings verify the sensor
- Every alert opens a tracked review or work order
Frequently Asked Questions
How often should a seepage weir be read?
What makes seepage a piping concern?
Can a CMMS replace dam safety engineers?
Why compare flow to reservoir level?
Can small dam programs use it?
Make Seepage Monitoring Auditable, Not Anecdotal
Bring weir flow, collector condition, and piping indicators into one maintenance record that your engineers, inspectors, and regulators can all rely on.