Every local government carries some deferred maintenance: the roof patched instead of replaced, the valve nobody has exercised in years, the pavement sealed a season too late. Each deferral looks sensible inside a single budget cycle, yet the cost never stays put. Small defects widen, components fail early, and a repair that once needed a crew for a day turns into a capital project that needs council approval. This guide shows how that cost compounds, how to measure your backlog honestly, and how to turn the numbers into a funding case, using records you can keep in a maintenance management platform such as Oxmaint.
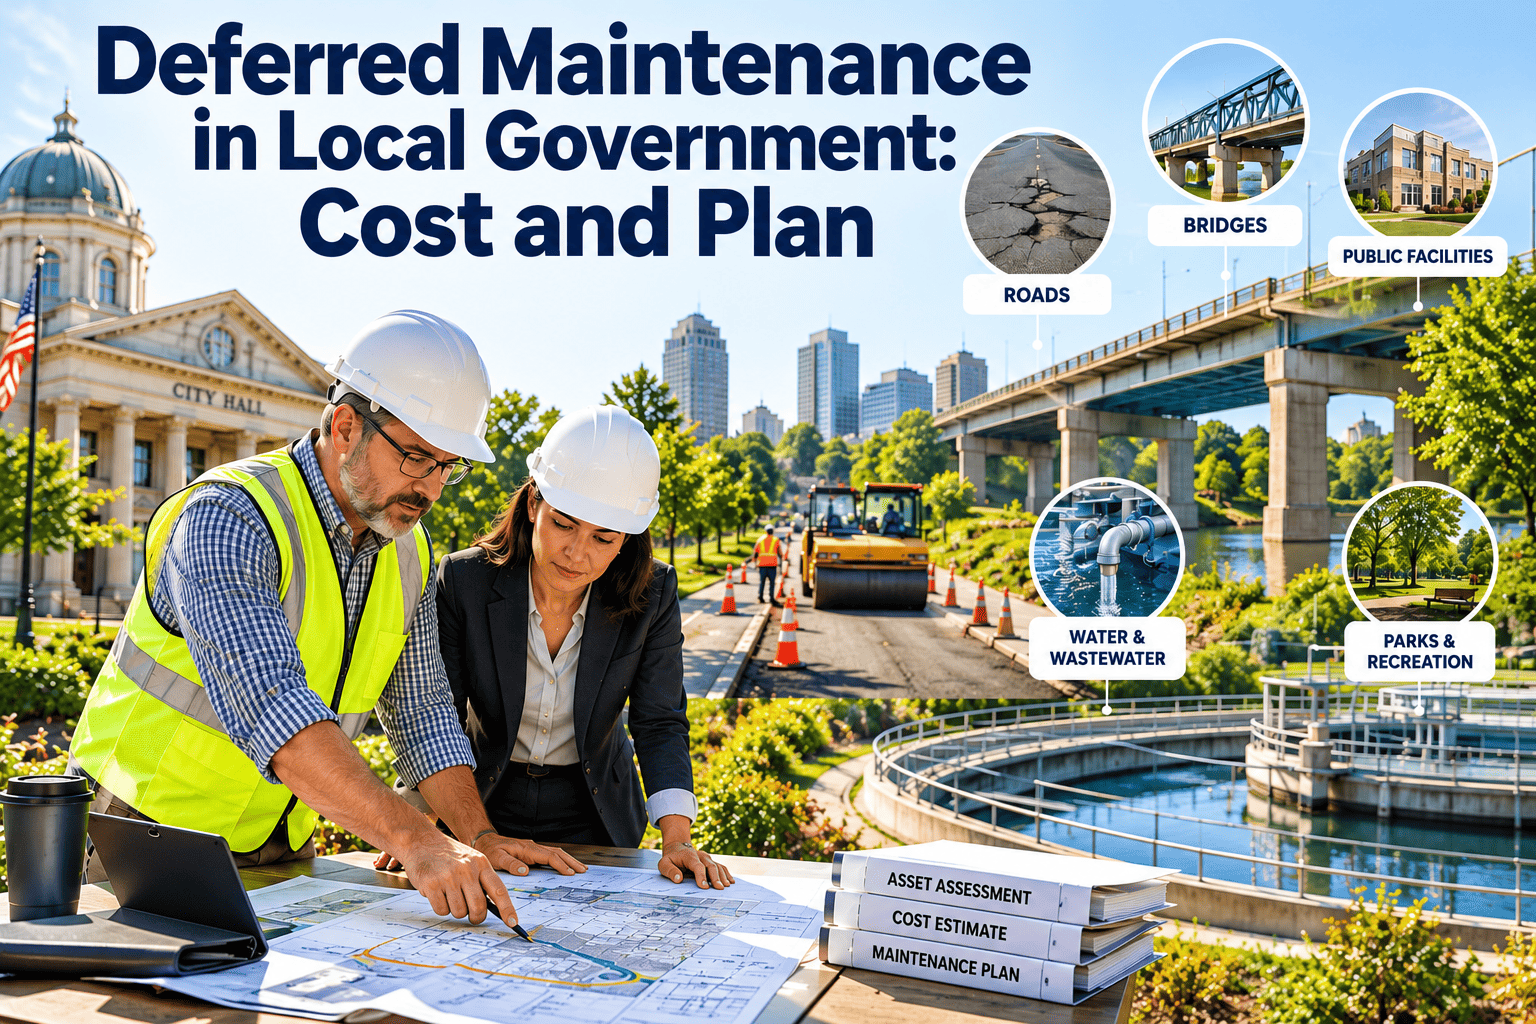
Deferred Maintenance in Local Government: Cost and Plan
Put a number on what has been postponed, rank it by risk, and present a plan that council can fund. Deferral is a decision with a price, and the price grows every year it stays unrecorded.
Terms that get mixed up in budget meetings
Deferred maintenance is work that should have been done by now and was pushed to a later period because money, staff or access was not available.
| Term | Plain meaning | Why the distinction matters |
|---|---|---|
| Routine maintenance | Scheduled upkeep that keeps an asset working, such as filter changes, greasing and cleaning | When it is skipped repeatedly, it becomes deferred maintenance |
| Deferred maintenance | Due work that was postponed, including repairs and planned replacements | It is the number that shows how far behind you are |
| Maintenance backlog | All open, unfinished work, including new requests that are not yet overdue | A backlog can be healthy; a deferred portion that keeps aging is not |
| Capital renewal | Planned replacement of major systems at the end of their useful life | Deferred renewal is usually the largest and least visible liability |
| Emergency repair | Unplanned work after a failure or safety event | It is often the end result of earlier deferral |
How one postponed repair becomes a capital project
The defect appears
An inspector or technician notes a cracked seal, a leaking joint or a worn bearing. The fix is small and cheap.
The request waits
Higher priority emergencies take the crew. The work order stays open, or worse, was never created.
Water, heat or load do the rest
The original defect lets moisture, vibration or stress reach neighboring parts, so more components need work.
Service is affected
A facility closes a room, a road section is restricted or a system runs in degraded mode.
The ask gets bigger
Staff now request replacement funding. The original small repair is forgotten, and the cost conversation starts from a worse position.
A note on timing
How fast this progression runs depends on the asset type, climate, duty and construction quality. Treat the sequence as a pattern to look for in your own work order history, not as a fixed schedule.
Why deferral keeps happening
Not every deferral carries the same risk
A single total hides the difference between a faded sign and a failing structural member. Plot each deferred item by likelihood of failure and consequence of failure, then fund from the top right corner first. The entries below are examples only.
Quantify the backlog in six steps
Build one asset register
Combine facilities, roads, parks, water, fleet and signals into a single list with location, age, material and owner. You cannot value a backlog on assets you have not listed.
Assess condition consistently
Use the same rating scale across departments. Inspections with photos and notes give you evidence that survives staff turnover.
List every deferred item
Capture overdue preventive tasks, open corrective work orders and postponed replacements, each with a recorded reason for the delay.
Attach a cost estimate
Estimate labor, parts, contractor and traffic or access costs. Mark each figure as a staff estimate, a quote or a bid so reviewers know its confidence level.
Score risk and rank
Apply the likelihood and consequence view above, plus safety, regulatory and service continuity flags.
Report the total and the trend
Show the backlog value by department and risk class, then repeat every quarter so council can see whether it is shrinking or growing.
A common ratio: Facility Condition Index
Deferred maintenance cost divided by current replacement value gives a percentage that lets you compare a small building with a large one. Agencies set their own rating bands, so adopt a published scale and keep it consistent year to year.
Metrics that show whether the backlog is under control
| Metric | What it shows | How to use it |
|---|---|---|
| Deferred maintenance value | Estimated cost of postponed work | Report by department, asset class and risk tier |
| Facility Condition Index | Backlog relative to asset value | Compare buildings and set replacement thresholds |
| Backlog age | How long approved work has waited | Review the oldest items first, not the average |
| PM schedule compliance | Preventive tasks completed on time | A falling rate usually precedes more deferred work |
| Planned versus reactive share | Labor hours on scheduled versus emergency work | A rising reactive share signals a team that cannot catch up |
| Repeat repairs per asset | Assets that keep returning for the same fault | Candidates for replacement rather than another patch |
Turning the backlog into a funding case
Request that stalls
- Asks for a round number to address aging infrastructure
- Lists projects by department wish list order
- Offers no condition evidence beyond staff opinion
- Does not say what happens if funding is declined
- Cannot show last year's money was spent well
Request that gets a hearing
- Shows the backlog total, the trend and the risk split
- Ranks projects by safety, regulatory and service impact
- Backs each item with inspection photos and work order history
- Presents options: fund now, fund in phases or accept the risk
- Reports completed work and costs from the prior allocation
Give council three funding options
Keep the evidence behind every budget request
Oxmaint helps public works teams record inspections, work orders, asset history and costs in one place, so the backlog number is something you can defend.
Which deferred work to fund first
Life safety and legal obligations
Fire systems, structural defects, backflow protection, accessibility and regulator-driven items. Delay here creates liability.
Imminent failure of critical assets
Pumps, valves, signals, generators and roofs with documented decline and no redundancy.
Work that stops escalation
Sealing, drainage, lubrication and small repairs that prevent a larger bill. These often have the best return per dollar.
Appearance and convenience
Cosmetic upgrades and comfort items, scheduled when funds and crews allow.
Where a CMMS fits in the deferral lifecycle
A backlog only becomes a manageable number when every defect is captured at the moment it is found. A CMMS such as Oxmaint holds inspections, work orders and asset records together, so deferral becomes a visible, dated status instead of a forgotten email.
Capabilities that matter for backlog control
Preventive maintenance scheduling keeps routine work from slipping into deferral. Work order aging and backlog reports expose the oldest items. Mobile inspections let field staff log defects on site, and inventory tracking shows whether parts are the real bottleneck. Dashboards then give managers and finance the same figures.
Record discipline that pays off
- Create a work order for every defect, even if it cannot be scheduled yet.
- Record why work was deferred, such as funding, staffing, access or parts.
- Update cost estimates at least once a year.
- Link repeat repairs to the same asset record.
A 90-day plan to get the backlog under control
Find and list
- Combine department lists into one register
- Agree a single condition scale
- Walk critical sites and log defects with photos
- Define reason codes for deferral
Estimate and rank
- Attach cost estimates and confidence levels
- Score each item for likelihood and consequence
- Flag safety and regulatory items
- Identify quick wins staff can complete now
Present and commit
- Prepare a one-page backlog summary for council
- Offer three funding options with consequences
- Set quarterly reporting dates
- Assign an owner to each Tier 1 and Tier 2 item
Mistakes that keep backlogs growing
Reporting the backlog to council without losing the room
| What to show | How to show it | What to watch for |
|---|---|---|
| The total | One headline figure with the date it was calculated and the share that is estimate versus quote | A large number without context sounds like a crisis; give it a denominator such as total asset value |
| The trend | A simple line over several years, with new deferral and completed work shown separately | A flat total can hide growth if inflation and new assets are ignored |
| The risk split | The share in each priority tier, with two or three named examples | Examples must be real and verifiable, not worst cases chosen for effect |
| The service impact | What residents would notice: closed rooms, restricted roads, slower repairs | Avoid technical jargon that council has to translate |
| The options | Three funding paths with the consequence of each | Presenting only one option invites a yes or no vote instead of a discussion |
Be honest about uncertainty
Backlog figures are estimates. Say how they were built, which items have contractor quotes and which are staff judgments. Credibility on the first report matters more than a precise number, and a transparent range is easier to defend than a single figure that later moves.
Ways local governments pay down deferred work
Frequently asked questions
What is deferred maintenance in local government?
It is maintenance, repair or renewal work that was due but postponed, usually for budget or staffing reasons. It is tracked as a dollar value so decision makers can see the size of the gap.
How do I estimate the size of our backlog?
Build one asset register, assess condition, list every postponed item and attach cost estimates. A CMMS keeps those records in one searchable place.
Is the maintenance backlog the same as deferred maintenance?
No. A backlog includes all open work, some of which is new and on schedule. Deferred maintenance is the portion that is overdue or has been pushed out.
How should we prioritize what to fix first?
Start with life safety and regulatory items, then critical assets near failure, then work that prevents escalation. Rank by likelihood and consequence, not by department.
Can software help us make the funding case?
Yes. Inspection photos, work order history and cost records give council evidence, and you can book a demo to see how Oxmaint reports backlog and aging.
Make the cost of waiting visible
Record every defect, rank by risk and report the trend every quarter. Oxmaint helps local government teams turn a hidden backlog into a clear plan.