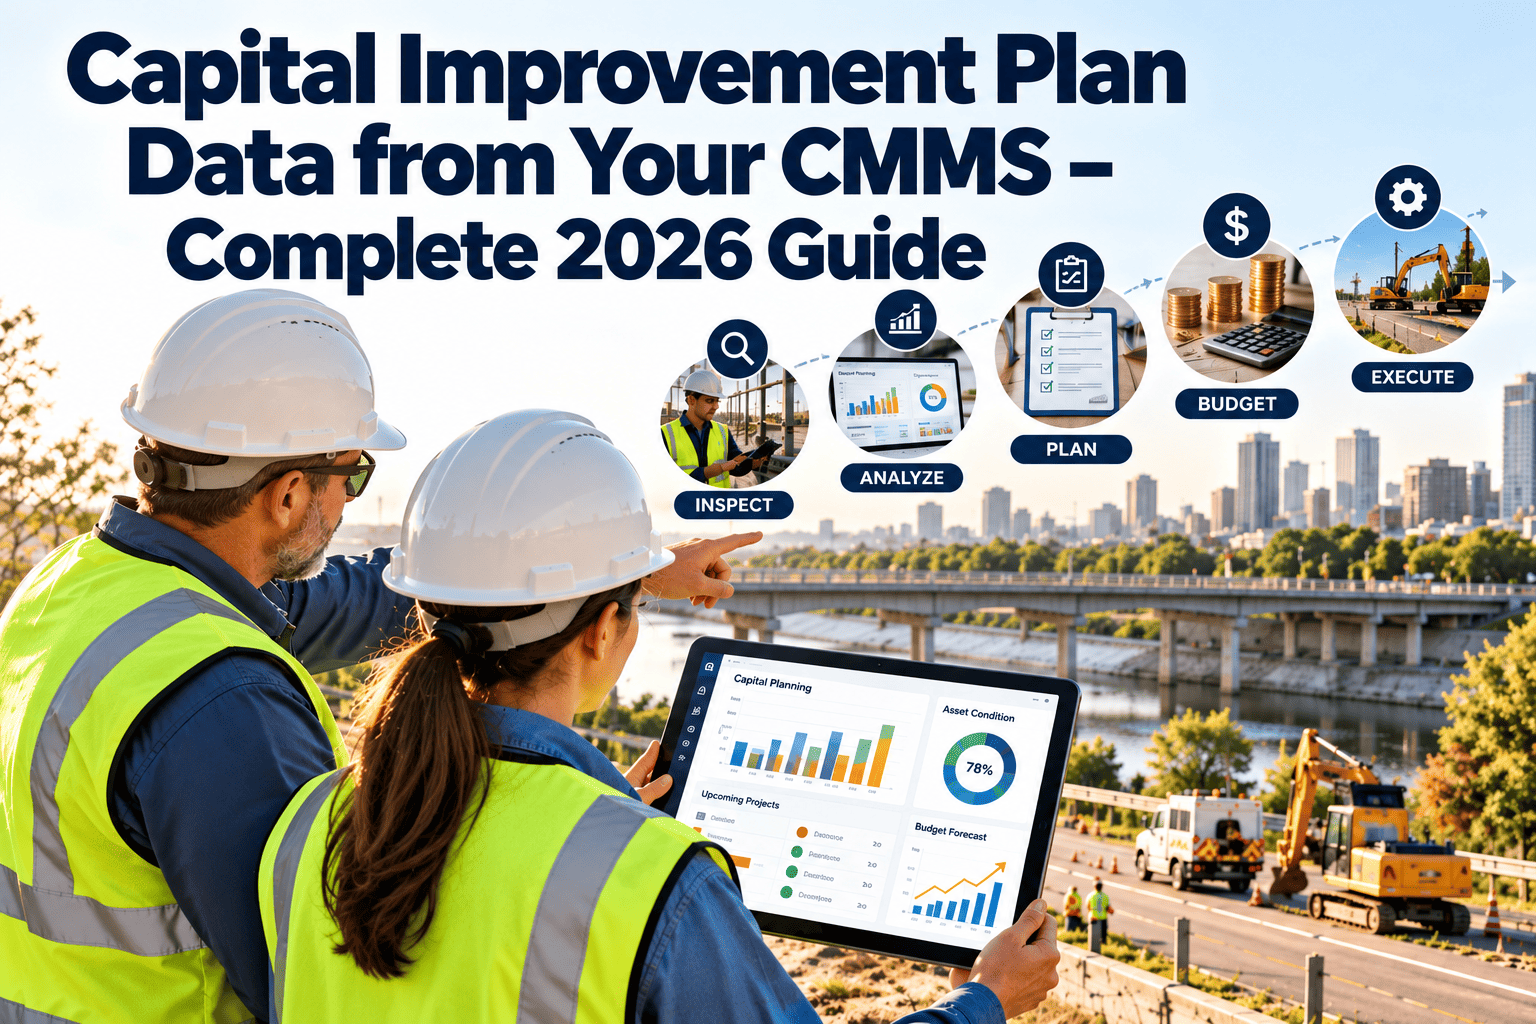
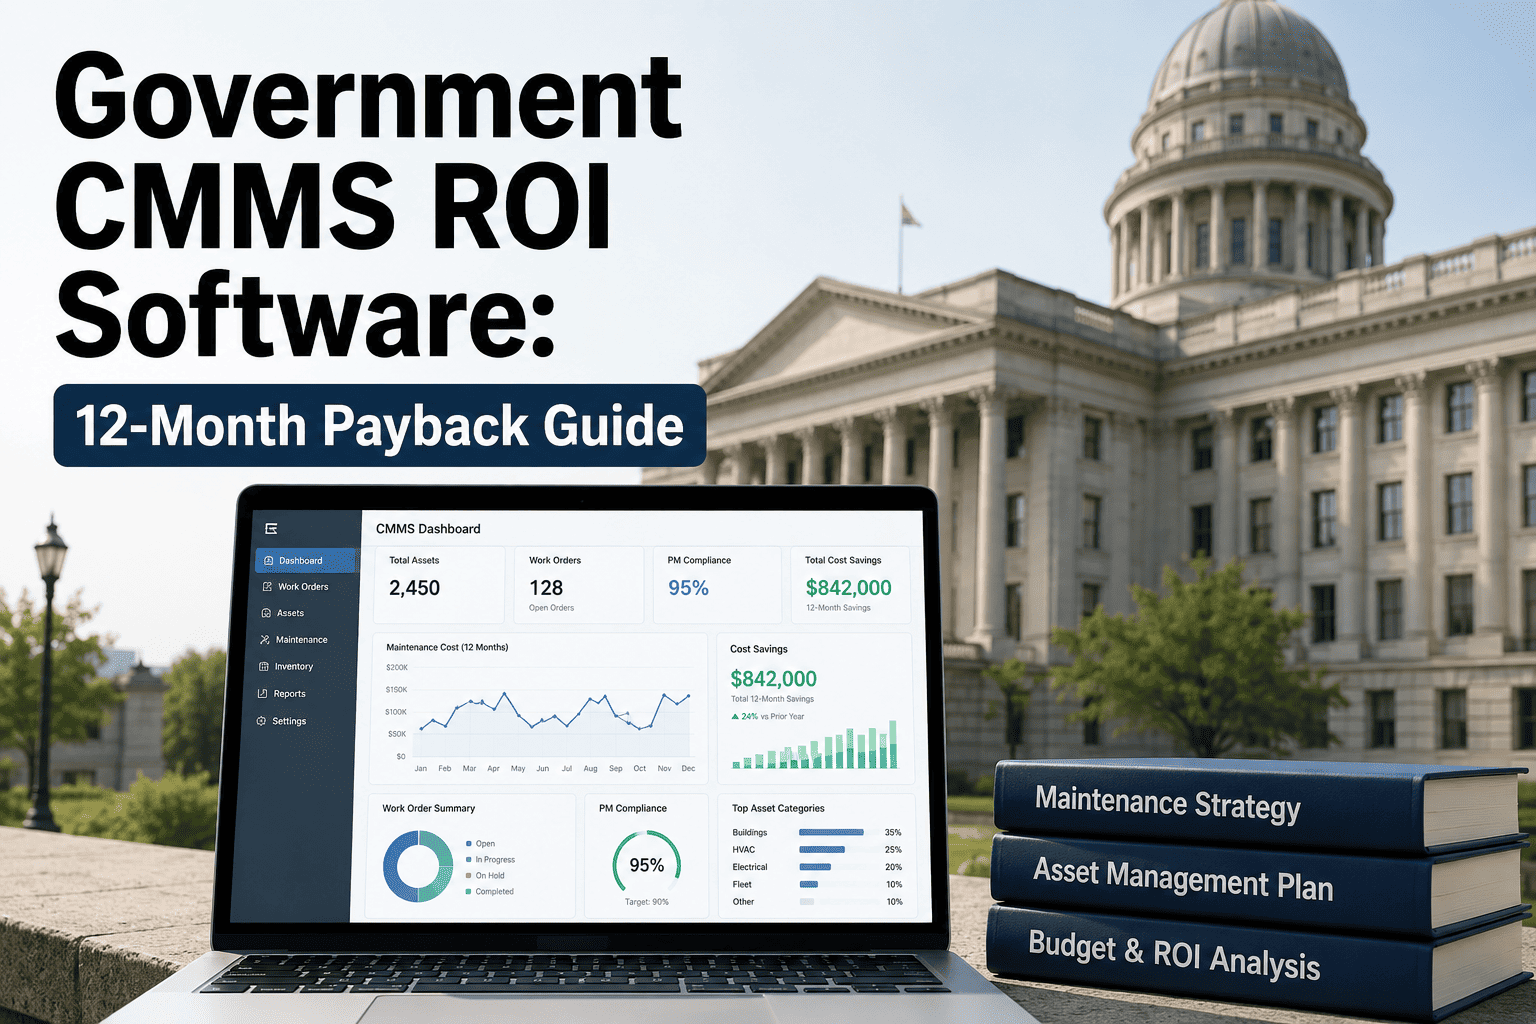
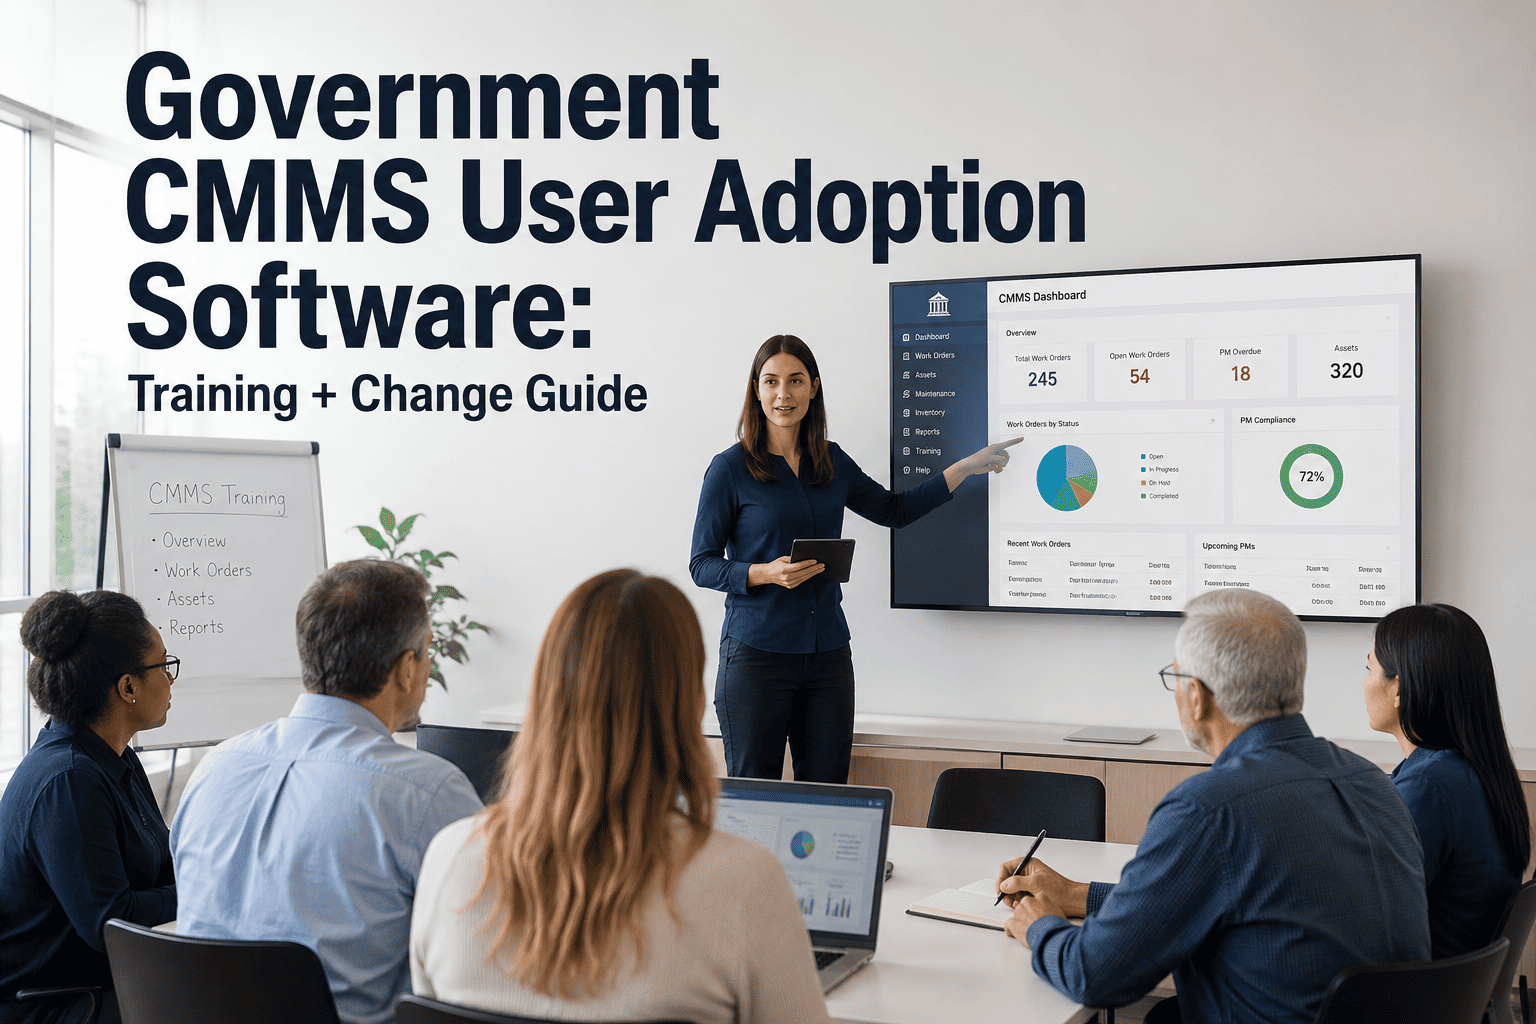
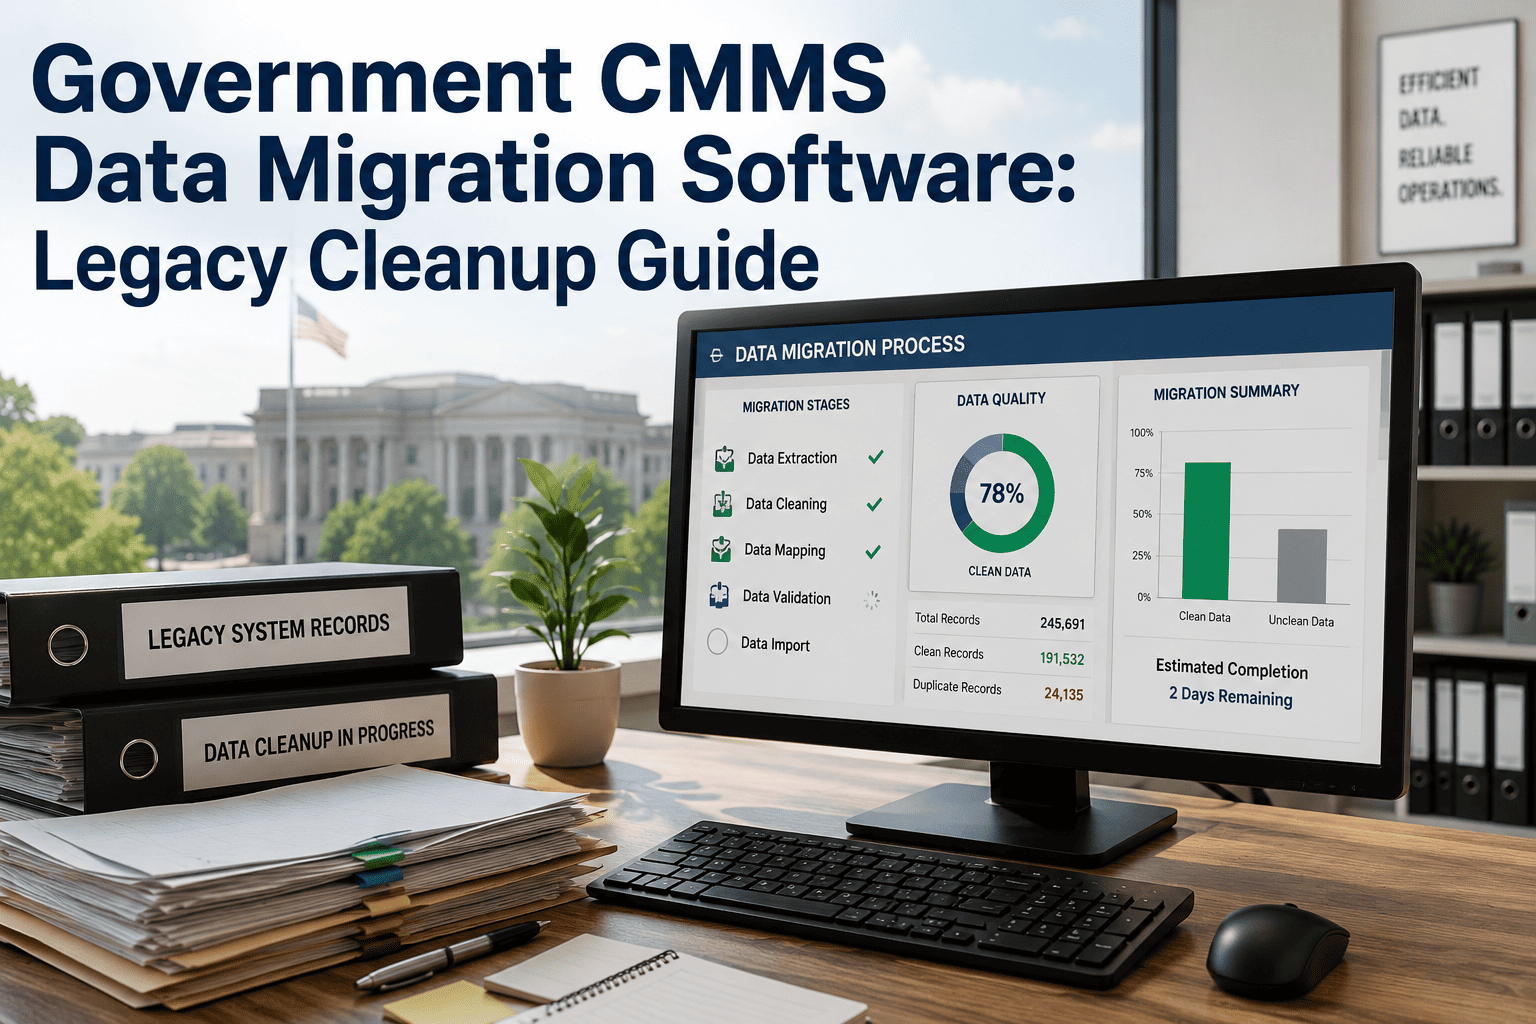
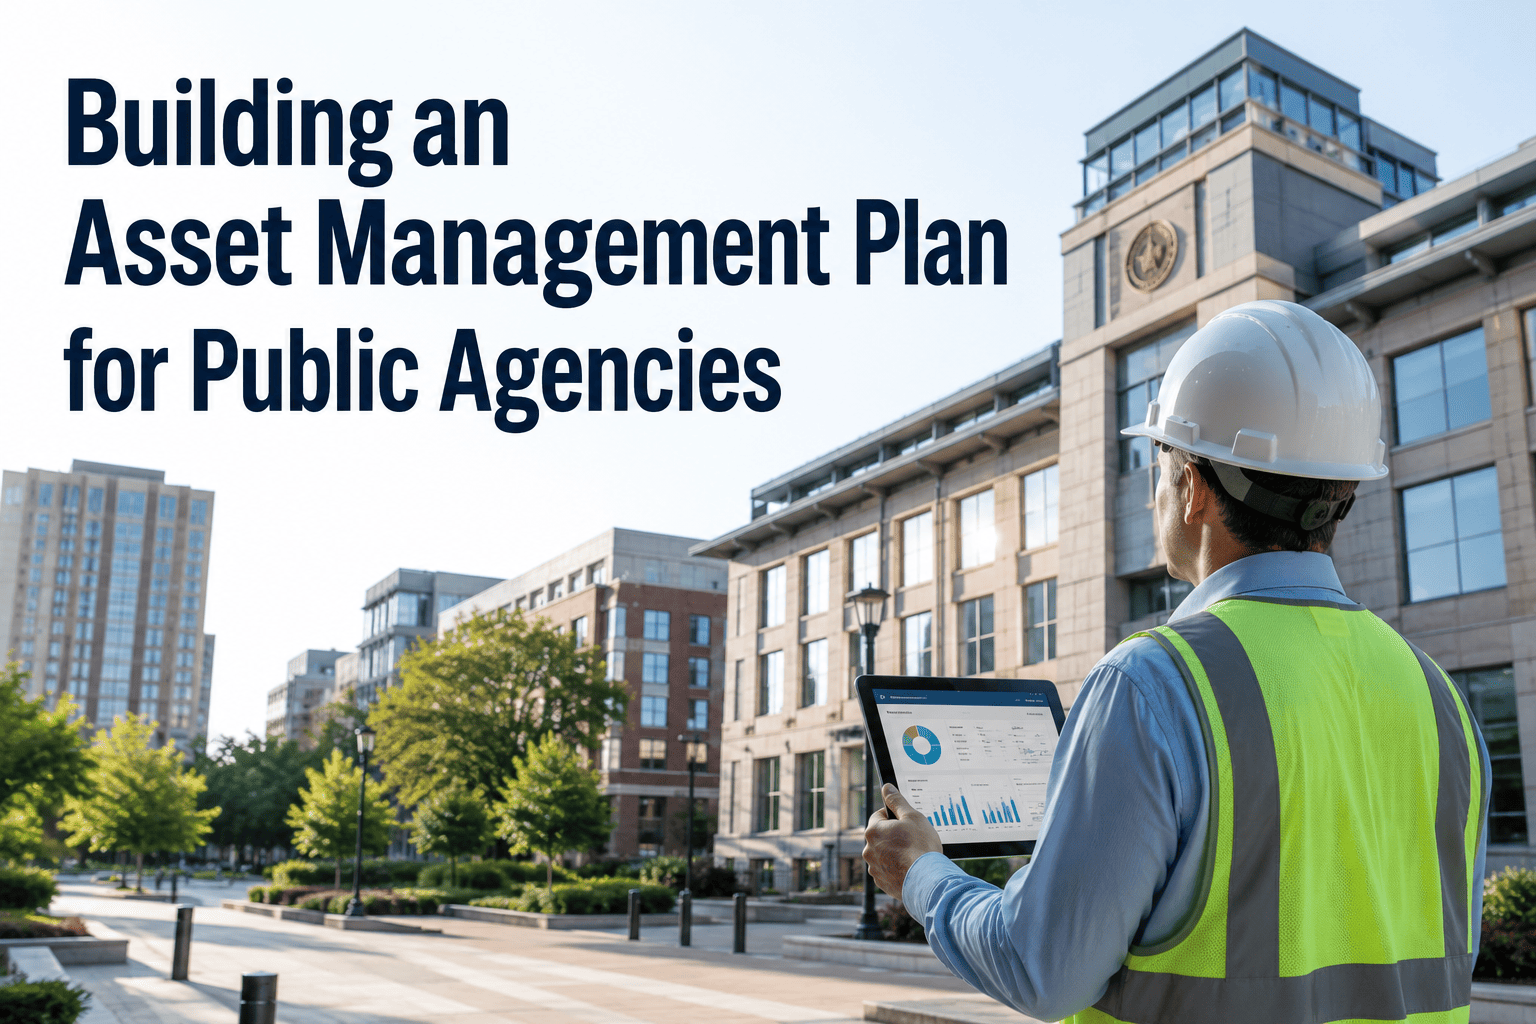
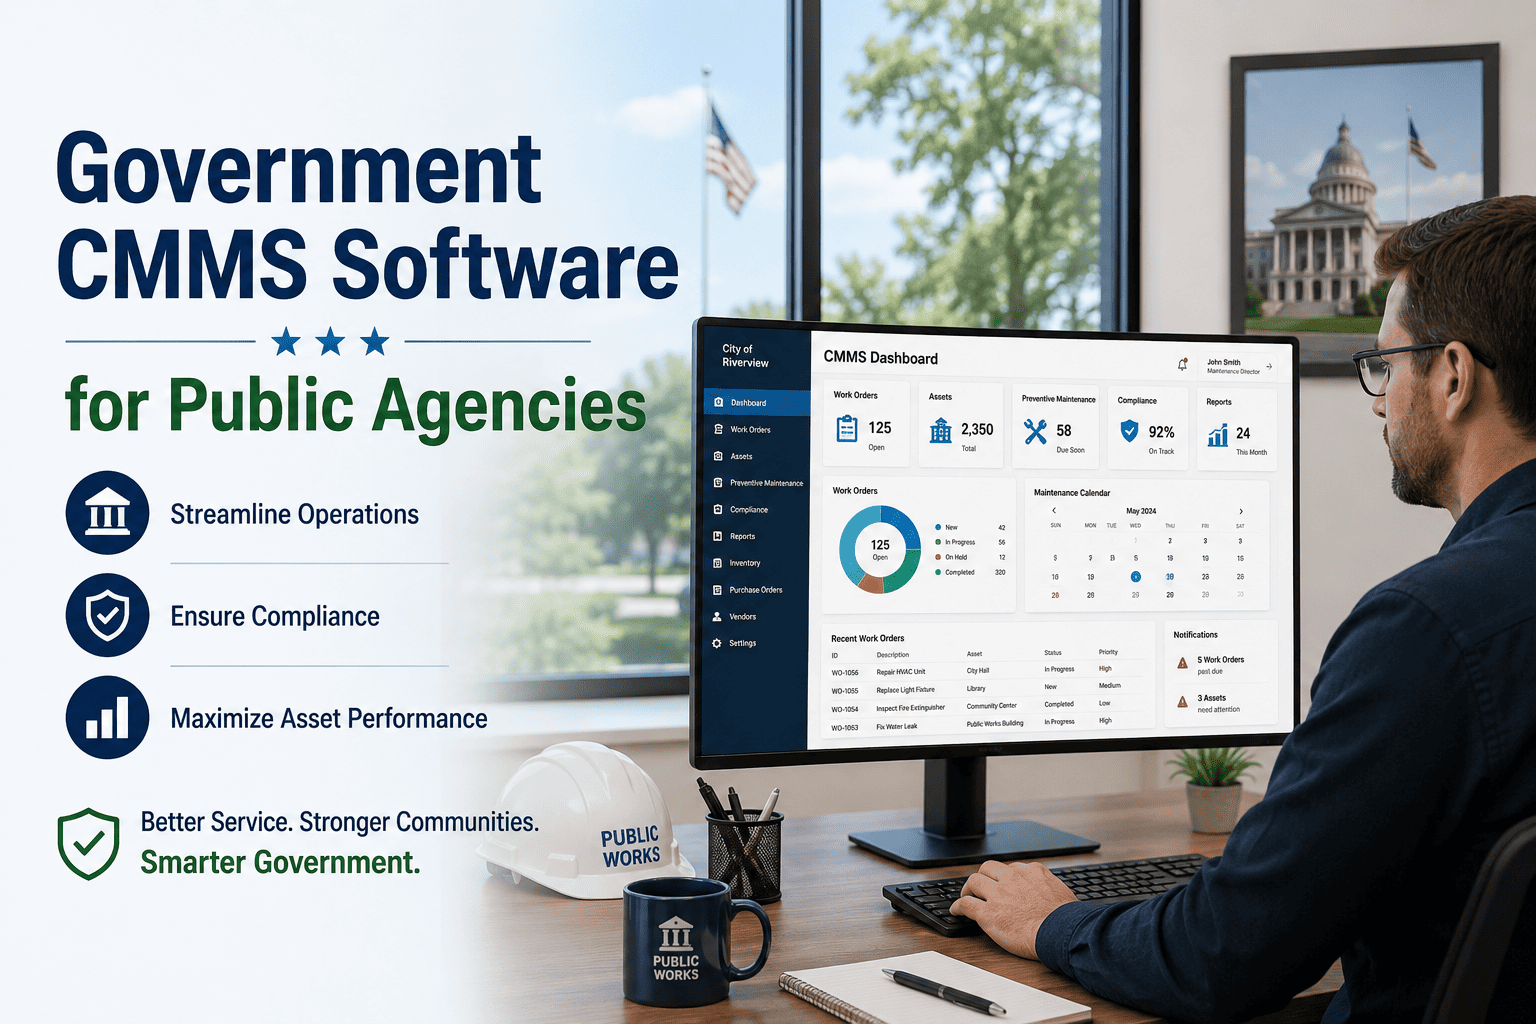
Every public works director eventually walks into a budget hearing with a stack of facility reports and a request that competes against roads, schools, and public safety for the same shrinking pool of capital dollars. A five-year Capital Improvement Plan built from spreadsheets and institutional memory rarely survives that room intact, because finance committees and elected councils now expect the request to be backed by condition data, not opinion. Government capital planning has quietly shifted from a once-a-year budgeting exercise into an ongoing data discipline, where Facility Condition Index scores, Reinvestment Priority Index rankings, and asset lifecycle records decide which projects move forward and which get deferred another cycle. Agencies still building their CIP from static documents watch their deferred maintenance backlog compound every year, while agencies running the same process from a connected CMMS are winning larger appropriations with fewer objections from council. Schedule a free CIP readiness review with our government infrastructure team and see exactly where your five-year plan is missing the evidence it needs.
$1T+
Deferred maintenance backlog across US government and public facility portfolios today
88%
Council approval rate for capital requests backed by condition data, versus 47% for estimate-only asks
4.8x
Cost premium of emergency reconstruction versus a project funded through a planned CIP cycle
7%
Annual compounding rate of deferred maintenance backlog once a facility drops out of a planned cycle
5 yrs
Standard planning horizon required by most state statutes and county capital budget ordinances
Budget Reality
GASB Statement 34 requires public agencies to report and depreciate infrastructure assets, and most state statutes and county charters require a documented, statutorily mandated multi-year capital plan tied to the annual appropriation cycle. Finance officers and legislative budget committees increasingly reject capital requests that arrive without condition-based scoring behind them.
What Breaks a Capital Improvement Plan Before It Reaches Council
A Capital Improvement Plan is supposed to be a rolling, evidence-based sequence of infrastructure and facility investments spanning five to ten years. In practice, most government CIPs are rebuilt from scratch every budget cycle by a small team pulling numbers from spreadsheets, prior-year PDFs, and department heads who each believe their project deserves next year's dollars. The plan that results is a wish list ranked by whoever argued loudest in the planning meeting, not by the actual condition of the assets involved. When a council member asks why a roof replacement ranks above a parking structure repair, there is rarely a documented scoring methodology to point to — only a memory of a conversation from eighteen months ago.
The deeper problem is that the CIP is disconnected from the work order and maintenance data that actually describes asset condition. A facility might have a growing HVAC failure history, escalating repair costs, and a roof past its rated service life, yet none of that operational data ever reaches the capital planning spreadsheet. Maintenance teams know a system is failing months before finance teams see a capital request, and by the time the request is drafted, the opportunity to fund a planned replacement has already passed, forcing an emergency purchase order at several times the planned cost.
Spreadsheet and Memory-Built CIP
Rebuilt from scratch each budget cycle
Project ranking based on department advocacy rather than documented condition scores
No linkage between work order history and the capital request that eventually gets drafted
Deferred maintenance backlog is estimated once a year, already stale by the time it reaches council
Multi-year sequencing done manually in a spreadsheet, prone to version conflicts between departments
Grant applications rebuilt from scratch because condition evidence was never centrally stored
47%
approval rate for capital requests submitted without documented condition data
CMMS-Driven Capital Improvement Plan
Continuously updated from live asset data
Every project ranked automatically by FCI, RPI, and remaining useful life pulled from asset records
Work order cost history feeds directly into deferred maintenance totals for every asset
Backlog and condition trending update continuously as work orders close and inspections occur
Five-year sequencing generated automatically and adjusted as funding scenarios change
Grant-ready condition documentation exportable in the format federal and state reviewers expect
88%
approval rate for capital requests backed by CMMS-generated condition scoring
The Four Numbers That Sequence a Defensible Capital Plan
A credible Capital Improvement Plan does not rank projects by urgency of complaint. It ranks them by a small set of quantifiable indicators that a finance director, an auditor, and a council member can all evaluate the same way. These four indicators form the scoring foundation of every defensible government CIP, and every one of them should be generated automatically from the same asset data a maintenance team already records every day.
01
Facility Condition Index
Deferred maintenance cost divided by current replacement value
FCI converts a building's entire repair backlog into a single comparable percentage. A score under 5 percent generally signals good condition, 5 to 10 percent signals fair condition warranting planned investment, and above 10 percent signals poor condition requiring priority capital action. FCI is the number federal grant reviewers, state auditors, and finance directors already recognize, which makes it the anchor metric for every project ranked in the plan.
02
Reinvestment Priority Index
FCI weighted against mission criticality and remaining service life
RPI takes the raw FCI score and adjusts it for how critical the asset is to agency operations and how much service life it has left. A fire station roof with a moderate FCI but near-zero remaining life and no operational redundancy ranks above a lower-priority facility with a worse FCI but years of usable service remaining. RPI is what turns a condition score into an actual funding sequence.
03
Remaining Useful Life
Expected years of service left on each major system or component
Every roof, HVAC plant, elevator, and paved surface carries an expected service life. Tracking remaining useful life at the system level, rather than guessing at the building level, lets a CIP separate a facility that needs one system replaced next year from a facility that needs comprehensive reconstruction across every system simultaneously.
04
Current Replacement Value and Risk-Consequence Score
Rebuild cost and consequence of failure, combined into a funding trigger
Current replacement value anchors every FCI calculation and every future cost projection. Layered against it, a risk-consequence score captures what happens if the asset fails before it is funded — public safety exposure, service interruption, or downstream damage to connected systems. Together, these two numbers determine which projects jump the queue regardless of where they sit on a straight FCI ranking.
From Work Order Data to a Defensible Capital Budget Line
Government agencies do not lack asset data — most maintenance teams already log thousands of work orders a year. What they lack is the pipeline that turns that operational data into a scored, sequenced, council-ready capital plan without a planning team manually re-entering everything into a spreadsheet every March.
CIP Data Pipeline: From Asset Record to Approved Budget Line
Asset Inventory Capture
Every building, system, and major component logged with age, replacement cost, and condition rating
Deferred Maintenance Costing
Work order history and inspection findings roll up into a live deferred maintenance total per asset
FCI and RPI Scoring
Condition and priority indexes calculated automatically at the portfolio, building, and system level
Priority Ranking
Every candidate project ranked against every other project using the same defensible methodology
Multi-Year Sequencing
Projects sequenced across the five-year window against realistic annual funding scenarios
Budget Package Export
Council-ready packet with condition scores, cost trending, and project narratives generated automatically
Priority Tiers — How Projects Land in the Five-Year Window
Tier 1 — Critical
FCI above 10 percent combined with a high risk-consequence score. Funded in year one regardless of other competing requests.
Tier 2 — High Priority
Fair condition with declining remaining useful life. Sequenced into year one or two of the plan.
Tier 3 — Planned
Stable condition with predictable end-of-life timing. Sequenced into years three through five for advance budgeting.
Tier 4 — Monitor
Good condition today. Tracked on a watch list and re-scored automatically as new inspection data arrives.
From Data to Decision
Turn condition data your maintenance team already records into a five-year Capital Improvement Plan that finance directors, auditors, and elected officials can defend line by line, without rebuilding the spreadsheet every budget cycle.
Compliance Expectations Across Government Capital Planning Bodies
A government CIP rarely answers to a single authority. State finance offices, county boards, city councils, and federal grant programs each carry their own documentation expectations, and a capital plan that satisfies one reviewer often falls short with another unless the underlying condition data is complete and consistently formatted.
| Authority |
Standard or Requirement |
What the CIP Must Demonstrate |
| GASB |
GASB Statement 34 infrastructure reporting |
Depreciated infrastructure asset values and documented condition assessment methodology |
| State Finance Office |
State capital budget statutes |
A rolling five- to ten-year plan updated annually and tied to the appropriation cycle |
| County Board |
County charter and budget ordinance |
Ranked project list with condition scores and cost estimates reviewed by the finance committee |
| City Council |
Municipal capital budget policy |
Public-facing project narratives, funding sources, and multi-year sequencing for constituent review |
| Federal Grant Programs |
FEMA, EPA, and HUD capital grant matching rules |
Documented deferred maintenance and condition evidence supporting the grant application narrative |
Capital Program KPIs Government Finance Directors Track
A dam or fleet safety program can point to an incident it prevented. A capital planning program has to prove its value through metrics that show the plan is disciplined, current, and improving portfolio condition over time — the evidence that keeps a program funded through the next budget cycle and the next council turnover.
100%
Projects Backed by Condition Data
Share of CIP line items carrying a documented FCI or RPI score rather than a narrative estimate alone
88%
Council Approval Rate
Percentage of scored, sequenced capital requests approved on first submission to the budget committee
< 2 yrs
Average Time to Funding for Tier 1 Projects
Elapsed time from a project entering Tier 1 to receiving an approved appropriation
≤ 5%
Annual Backlog Growth Rate
Year-over-year change in total deferred maintenance across the portfolio once a CIP program is active
±10%
Budget Variance Against Plan
Difference between projected and actual project cost, tracked to keep future estimates credible
30 days
Plan Refresh Cycle
Maximum interval before new work order and inspection data is reflected in updated project rankings
Frequently Asked Questions
01
How many years should a government Capital Improvement Plan cover?
Most state statutes and county ordinances require a minimum five-year rolling plan, though many larger agencies extend it to ten years for major infrastructure categories. The plan should update annually rather than being rebuilt from scratch each cycle.
02
What is the difference between FCI and RPI in capital planning?
FCI measures raw building condition as deferred maintenance over replacement value. RPI adjusts that score for mission criticality and remaining useful life, which is why the two indexes together, not FCI alone, determine final project sequencing.
03
Can a small agency justify CMMS-based CIP software over a spreadsheet?
Yes — the cost of one deferred emergency reconstruction typically exceeds several years of platform cost.
Sign up free to see how quickly existing work order data converts into a scored plan.
04
Does a CMMS-generated CIP satisfy GASB 34 reporting requirements?
A CMMS-generated plan supports GASB 34 compliance by producing depreciated asset values and a documented condition assessment methodology, though final reporting still requires review by the agency's finance and audit team.
05
How often should FCI and RPI scores be recalculated?
Scores should update continuously as work orders close and inspections occur, with a recalculation cycle of no more than thirty days so council review always reflects current portfolio condition rather than a stale annual snapshot.
Portfolio-Wide Capital Planning
Oxmaint connects your maintenance and asset data directly to a scored, sequenced Capital Improvement Plan — giving finance directors, agency heads, and elected officials the defensible five-year budget evidence government capital planning now requires.