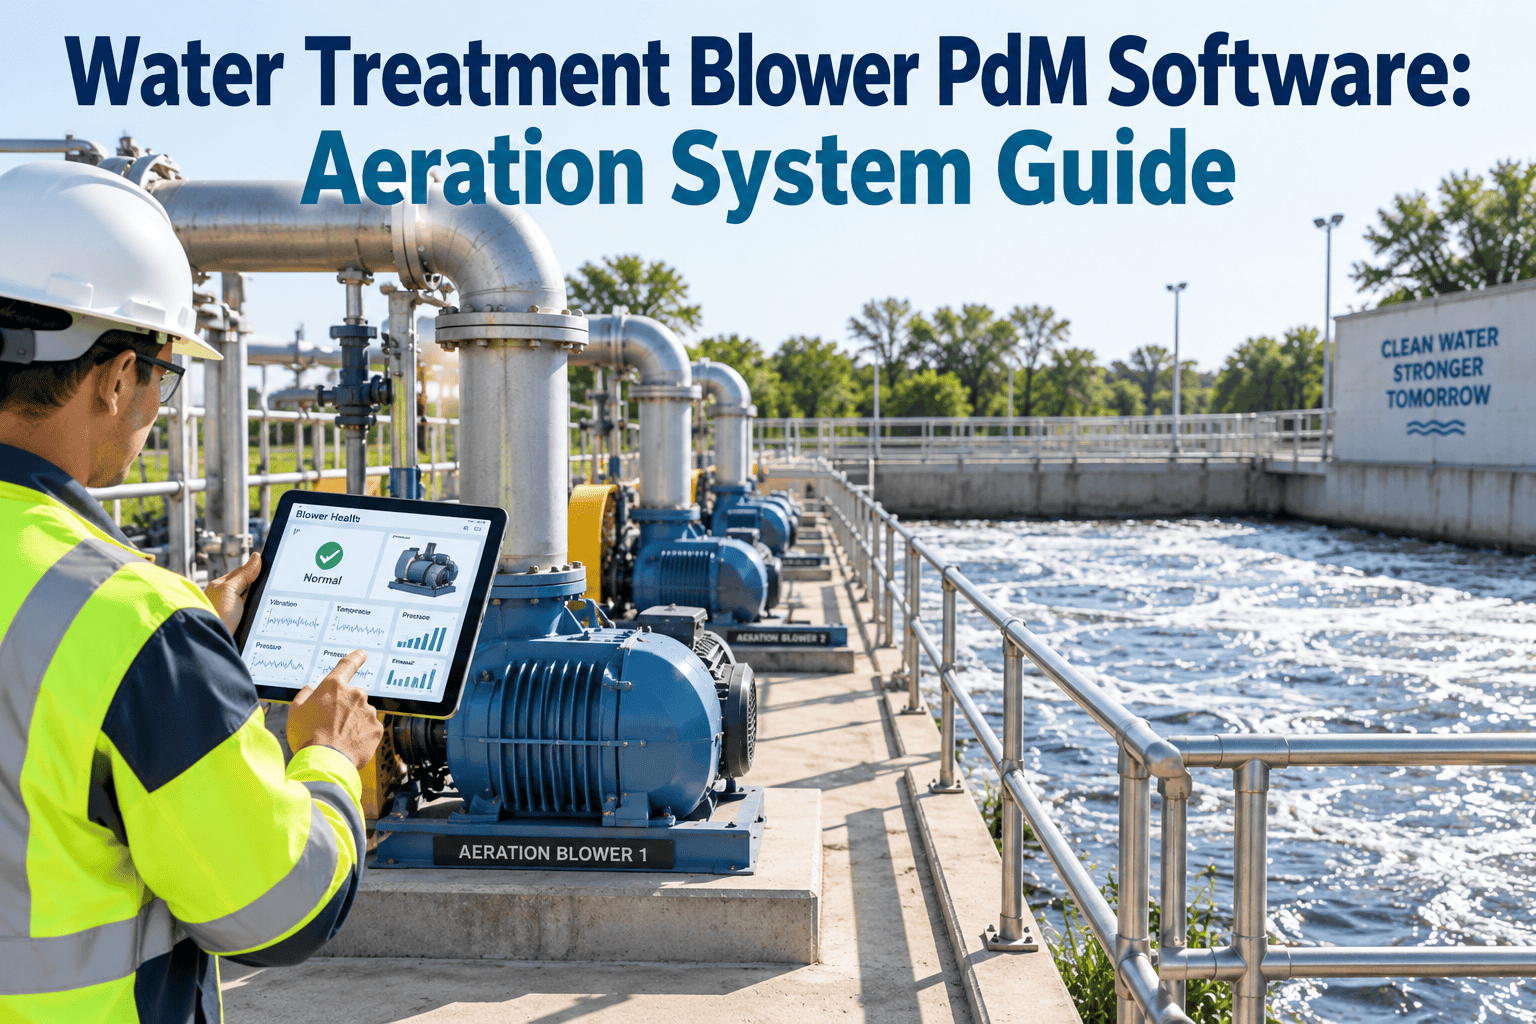
An aeration blower is the single point of failure most operators underestimate. It runs continuously, every hour of every day, pushing the oxygen that keeps activated sludge alive and effluent within permit — and when a bearing seizes or a thrust collar fails without warning, dissolved oxygen collapses within minutes, not hours. Plants recovering from an unplanned blower outage often spend weeks re-establishing biological treatment performance, all from a failure that gave off measurable warning signs for days before it happened. Most plants still rely on a technician walking the blower gallery once a shift, listening for something that sounds wrong — a method that catches obvious problems but misses the gradual bearing wear and thrust load drift that precede most failures. Book a free blower reliability assessment with our water treatment team and see exactly where your aeration system's earliest warning signs are hiding.
50–70%
Share of a treatment plant's total electricity bill typically consumed by the aeration blower system
15+ yrs
Average age of blower units still running past their originally rated bearing service life
72 hrs
Typical warning window bearing vibration and thrust trends provide before a mechanical failure
6–10%
Energy savings achievable when diffuser fouling and blower efficiency loss are caught early
$40K+
Typical cost of an unplanned blower rebuild versus a planned bearing or seal replacement
Regulatory Pressure
NPDES permit limits leave little room for a dissolved oxygen excursion caused by an unplanned aeration outage — a reportable effluent violation can follow within hours of a blower trip. State environmental agencies and EPA inspectors increasingly review a plant's preventive and predictive maintenance documentation for critical process equipment as part of compliance history, making a documented blower monitoring program part of the operating record, not just a mechanical nicety.
Why Vibration Checks Once a Shift Are Not Enough
A blower bearing does not fail instantly — it fails through a progression of heat, vibration signature change, and lubricant breakdown that plays out over days or weeks. A technician's handheld vibration reading, taken once during a shift walk, captures a single moment inside that progression and easily misses the early stage entirely. By the time a handheld reading or an audible change is obvious enough to notice on a walk-through, the bearing is often already in an advanced failure state with a narrow runway before an unplanned trip. Continuous monitoring closes that gap by watching the same parameters every few minutes, all day, without depending on a person being in the right place at the right time.
Catch loud bearing noise or obvious overheating during the walk
Record a single-point vibration reading at the time of inspection
Flag visible oil leaks or coupling misalignment on sight
Detect gradual bearing wear trending between shift visits
Track thrust load drift correlated with process air demand changes
Identify diffuser fouling through differential pressure trending
Correlate motor current draw with mechanical efficiency loss over time
Alert maintenance staff overnight or on weekends when no one is walking the gallery
60%+
of blower mechanical failures show measurable trend deviation more than 48 hours before the failure was noticed manually
VS
All manual inspection findings, plus continuous trend data across every channel
Bearing vibration signature analysis with early-stage defect frequency detection
Thrust load monitoring correlated with airflow demand and process conditions
Diffuser fouling inference from differential pressure and efficiency trending
Motor current signature analysis for winding and mechanical load anomalies
Automated alerts to on-call maintenance staff at any hour of the day
Dissolved oxygen correlation flags aeration shortfall before permit risk develops
Complete failure-progression timeline for root cause analysis and warranty claims
85%
of developing blower faults detected days earlier with continuous PdM versus shift-based manual checks alone
The Blower PdM Sensor Framework
Effective blower predictive maintenance depends on watching the right combination of mechanical, process, and electrical signals together — not any single reading in isolation. The categories below cover the instrumentation and alert logic that separates a genuine predictive program from a collection of disconnected sensors.
Bearing failure is the leading mechanical cause of unplanned blower downtime, and vibration signature analysis is the earliest reliable indicator available — defect frequencies specific to inner race, outer race, and rolling element wear appear in the frequency spectrum well before amplitude alone crosses an alarming threshold. Paired temperature monitoring confirms whether an emerging vibration trend is accompanied by frictional heat build-up.
Required Measurement Points
Drive-end and non-drive-end bearing housing vibration, radial and axial
Bearing housing temperature at each measurement point
Lubrication oil temperature and level for oil-lubricated bearings
Gearbox bearing vibration for geared multistage centrifugal blowers
AI Alert Configuration
Frequency-domain analysis compares current spectrum against the healthy baseline signature; alert triggers when defect-frequency amplitude exceeds the statistical baseline rather than waiting for overall vibration velocity to cross a fixed limit.
Centrifugal and multistage blowers experience axial thrust loads that shift with process air demand and impeller wear. Excessive or drifting thrust load accelerates thrust bearing wear and, left unaddressed, can lead to catastrophic impeller-to-casing contact. Continuous thrust monitoring catches this drift long before it becomes an audible or visible problem.
Required Measurement Points
Axial displacement or thrust bearing load cell reading, continuous
Thrust bearing temperature at the active and inactive collar
Impeller clearance trend inferred from thrust position drift over time
AI Alert Configuration
Thrust position correlated against airflow demand curve — alert triggers when observed thrust deviates from the expected value for the current operating point, independent of absolute load level.
Fine-bubble diffuser fouling and inlet filter media loading both raise system backpressure gradually, forcing the blower to work harder for the same delivered airflow. This shows up first as a slow rise in differential pressure and energy draw long before an operator would notice a change in basin appearance, making it one of the highest-value early efficiency indicators available.
Required Measurement Points
Inlet filter differential pressure, continuous trending
Diffuser header backpressure relative to submergence depth
Delivered airflow versus blower discharge pressure efficiency curve
Basin dissolved oxygen response relative to delivered air volume
AI Alert Configuration
Regression model relates expected backpressure to airflow rate and basin depth; alert triggers when observed backpressure exceeds the predicted value, indicating fouling or media loading requiring cleaning.
Motor current signature analysis picks up both electrical faults, such as winding insulation degradation, and mechanical issues that load the motor unevenly, such as coupling misalignment or impeller imbalance. Power draw trending also directly supports the energy efficiency case for the entire monitoring program, since blowers are typically the largest single electrical load in a treatment plant.
Required Measurement Points
Three-phase current draw and imbalance percentage, continuous
Real power consumption per unit airflow delivered (efficiency trending)
VFD output frequency and drive fault history for variable-speed units
AI Alert Configuration
Power-per-airflow efficiency ratio tracked against the commissioning baseline; sustained efficiency decline beyond the expected seasonal range triggers a maintenance review before energy cost impact compounds further.
Blower mechanical health and biological treatment performance are directly linked, so correlating blower condition data with basin dissolved oxygen closes the loop between equipment reliability and permit compliance. A declining DO trend that correlates with a blower efficiency drop, rather than a process load change, points maintenance directly to the mechanical root cause instead of a process adjustment that would not fix it.
Required Measurement Points
Basin dissolved oxygen at multiple depths and zones
Blower discharge pressure and temperature at the manifold
Standby blower readiness status and last-run verification
AI Alert Configuration
Cross-correlation flags a DO decline coinciding with blower efficiency loss as mechanical in origin, routing the alert to maintenance rather than the process control team by default.
From Shift Checks to Continuous Blower Intelligence
Oxmaint connects blower vibration, thrust, and process data into one predictive maintenance platform — giving water treatment teams the early warning window that shift-based inspection alone cannot provide.
Compliance & Regulatory Framework for Aeration Reliability
Blower reliability is not purely a mechanical concern for treatment plants — it sits directly under the compliance obligations that govern effluent quality and worker safety, and inspectors increasingly expect documented predictive maintenance practice around it.
| Standard / Authority |
What It Requires |
| EPA NPDES Permits |
Effluent quality limits that depend on consistent aeration performance — a documented blower reliability program supports permit compliance history during inspection. |
| State Environmental Agencies (DEQ) |
Many states expect a documented preventive and predictive maintenance program for critical process equipment as part of operating permit renewal review. |
| OSHA Process Safety |
Rotating equipment guarding, lockout-tagout, and confined space procedures around blower galleries require documented maintenance and inspection records. |
| State Energy Efficiency Programs |
Utility and state efficiency incentive programs increasingly require documented blower efficiency baselines and improvement tracking to qualify for rebates. |
Blower PdM KPI Dashboard
These are the metrics that demonstrate a mechanical reliability program is actually reducing risk and cost, not just generating sensor data.
99%+
Blower Fleet Sensor Uptime
Percentage of scheduled monitoring time with valid data across all instrumented blower units.
< 2 hrs
Mean Time to Alert Acknowledgment
Average time from anomaly detection to maintenance team acknowledgment of the alert.
0
Unplanned Trips per Quarter
Target for unplanned blower outages once predictive maintenance alerts are acted on consistently.
6–10%
Energy Cost Reduction
Typical energy savings from early diffuser fouling and blower efficiency correction.
≤ 30 days
Alert-to-Repair Resolution Time
Average time from a bearing or thrust anomaly alert to scheduled corrective maintenance completion.
100%
Standby Blower Readiness
Share of standby units verified operational and ready for automatic failover at any time.
Frequently Asked Questions
What's the earliest indicator of a developing blower bearing failure?
Vibration signature changes at specific defect frequencies typically appear days before amplitude alone crosses a traditional alarm threshold, making frequency-domain analysis the earliest reliable signal available.
How does blower PdM data help with energy cost, not just reliability?
Diffuser fouling and bearing drag both raise power draw per unit of delivered airflow. Tracking that ratio against a commissioning baseline surfaces energy waste well before it shows up as an unusually high utility bill.
Can this work with existing blower control systems and VFDs?
Yes, most platforms integrate with existing VFD and SCADA data streams rather than requiring a full instrumentation replacement.
Book an assessment to review your current blower control setup.
What happens during a sensor or communication outage in the blower gallery?
Local data logging preserves readings during any communication gap, and the outage itself generates its own alert so a monitoring blind spot is never silently accepted during a high-risk period.
How quickly can a plant get a blower PdM program running?
Most plants can have core bearing and thrust monitoring live within a few weeks of sensor installation.
Sign up free to see the platform and plan an installation timeline for your blower fleet.
Stop Finding Out About Blower Failures After They Happen
Oxmaint gives water treatment teams continuous visibility into bearing health, thrust load, and diffuser condition — turning your aeration system's earliest warning signs into a scheduled repair instead of an emergency outage.