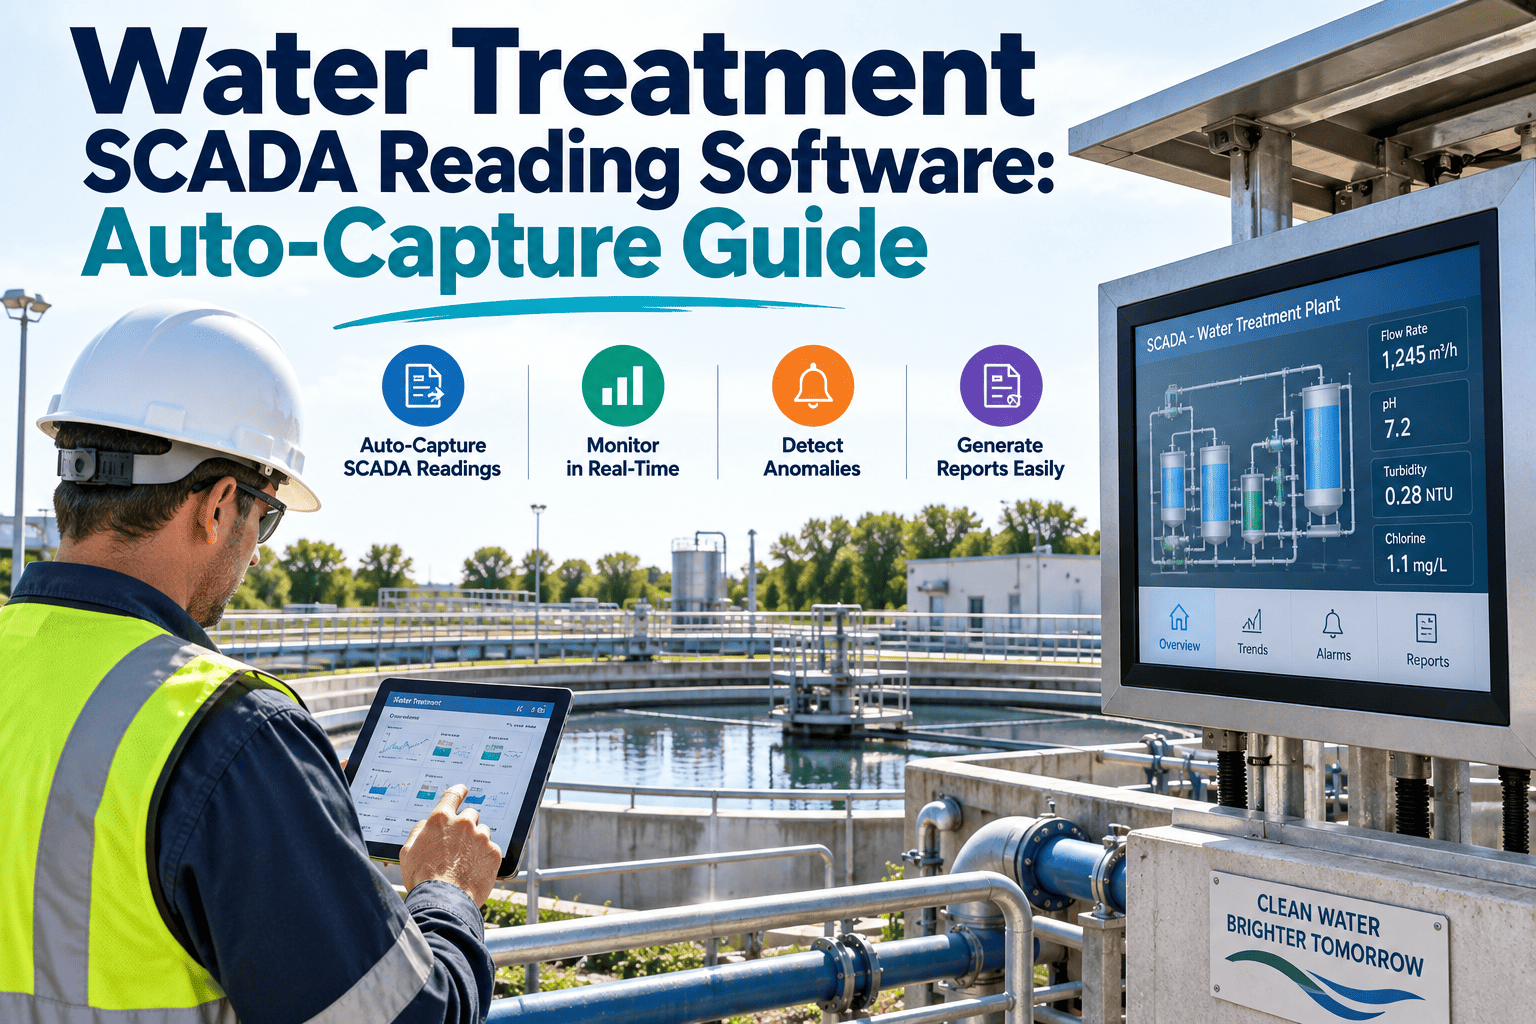
Every gravity filter at a surface water treatment plant is running a quiet countdown that most CMMS platforms never see — head loss climbing, turbidity drifting, media slowly binding with the solids it was built to catch. Under the Surface Water Treatment Rule, a filter that misses its backwash window is not just an operations problem, it is a treatment technique violation waiting to happen, since effluent turbidity above 0.3 NTU in 95 percent of readings or a single spike above 1.0 NTU triggers mandatory reporting. Backwash timing, air scour duration, and media loss tracking are not paperwork — they are the operational discipline that keeps every filter bed compliant, every log defensible, and every sanitary survey a formality instead of a scramble, and the plants that treat filtration PM as a first-class discipline are consistently the ones that pass their sanitary surveys without a single finding. Start free with Oxmaint to bring every filter cell onto one backwash schedule this week.
The Three Signals That Trigger a Backwash
Operators do not backwash on a fixed clock alone — a filter tells you when it needs washing through three independent signals, and a plant that tracks only one of them is flying partially blind. Missing any one of these is how a filter run silently overstays its welcome.
Head Loss
Rising differential pressure
As media clogs with captured solids, the pressure drop across the bed climbs toward the terminal head loss limit. Trending DP against baseline is the earliest mechanical warning a filter gives.
Turbidity
Effluent quality drift
Filter effluent turbidity creeping toward the 0.3 NTU compliance ceiling — even while still technically passing — signals declining filtration efficiency before a violation occurs.
Run Time
Maximum time in service
Every filter carries a maximum run time regardless of head loss or turbidity readings, because media biology and mudball formation continue even when readings look acceptable.
Oxmaint tracks all three backwash triggers per filter cell simultaneously — head loss, turbidity, and run time — and generates the work order the moment any threshold is crossed, before a compliance exceedance can occur.
Anatomy of a Backwash Cycle
A properly executed backwash is a sequence, not a single action — skip a step or shorten a phase and the filter returns to service with media still partially fouled, which is exactly the pattern that produces the post-backwash turbidity spikes regulators flag during sanitary surveys. Understanding each phase is what lets an operator diagnose a problem filter instead of just repeating the same wash cycle and hoping for a different result.
1
Filter to waste
Filter is taken offline and the surface water is diverted to waste, isolating the bed from the distribution system before disturbance begins.
2
Air scour
Compressed air is introduced beneath the media to break up compacted solids and mudballs before water flow begins, dramatically improving wash efficiency.
3
Backwash water flow
Wash water flows upward through the bed at a rate sufficient to expand and fluidize the media, carrying dislodged solids up and out to the wash water trough.
4
Surface wash or sweep
Fixed or rotating surface wash arms break up the top layer of media where mudballs and surface crust are most likely to form and resist standard flow alone.
5
Rinse and settle
Wash water flow tapers off, media resettles by size and density, and the bed stabilizes before the filter is returned to normal filtration mode.
6
Ripening and return to service
Filtrate is monitored as the bed ripens — turbidity typically spikes briefly before settling below 0.5 NTU within about fifteen minutes on a healthy filter.
Reading a Ripening Curve: Healthy vs Warning
The turbidity profile immediately after backwash is one of the most diagnostic pieces of data a plant generates — and most facilities never trend it systematically. A filter that ripens cleanly tells you the media is sound. One that lingers above threshold is telling you something is wrong before it shows up anywhere else.
Healthy filter
0 min
5 min
10 min
15 min
Recovers below 0.1 NTU within 15 minutes — normal, no action needed
Warning filter
0 min
5 min
10 min
15 min
Still above 0.5 NTU past 15 minutes — flag for media inspection
Media Loss: The Cost Curve Nobody Tracks Until It's Expensive
Every backwash carries a small amount of filter media out with the wash water — that is normal and expected. What separates a well-run plant from one heading toward an unplanned media replacement is whether that loss rate is actually measured and trended per filter, rather than discovered years later when bed depth comes up short during an inspection and the entire cell needs to be taken offline for a full media replacement nobody budgeted for this cycle.
0.3 NTU
SWTR ceiling
Maximum effluent turbidity allowed in 95% of monthly readings before a treatment technique violation
1.0 NTU
Single-reading limit
Any single turbidity reading above this threshold triggers immediate reporting regardless of the monthly average
2–3x
Weekly wash frequency
Typical backwash frequency per filter cell depending on raw water quality and seasonal loading
15 min
Ripening window
Time a healthy filter should take to recover below the return-to-service turbidity threshold
What a Missed Backwash Actually Costs
The consequence of a skipped or delayed backwash cascades well beyond one filter cell. It shows up first in operations, then in compliance risk, then in the capital budget when media replacement arrives years earlier than it should have.
Missed backwash
- Terminal head loss reached mid-run, filter forced offline unexpectedly
- Effluent turbidity drifts toward or past the 0.3 NTU compliance threshold
- Mudballing and surface crust develop, reducing effective filtration area
- Media loses uniformity, shortening the interval before full media replacement
- Sanitary survey finds gaps in backwash logs and differential pressure records
Scheduled backwash discipline
- Backwash triggers before terminal head loss, filter never forced offline
- Effluent turbidity stays well within compliance margin across every filter run
- Air scour and surface wash prevent mudball formation before it starts
- Media life extends toward its full design interval before replacement
- Every event exports as a complete, timestamped compliance record
How Oxmaint Runs Filter Backwash PM for Water Treatment Plants
Oxmaint treats backwash as an independent recurring PM discipline tied directly to each filter cell — not a generic maintenance task, but a compliance-critical event with its own trigger logic, its own checklist, and its own audit trail. Every filter in the plant carries its own history, its own baseline, and its own trend line, because a filter that has performed reliably for years and one that has been drifting for months need very different levels of operator attention even when today's readings look identical.
Trigger
Multi-signal PM scheduling
Backwash work orders generate automatically at configured head loss, turbidity, or run-time thresholds — whichever trips first per filter cell.
Log
Per-event cycle records
Air scour duration, wash water flow rate, surface wash time, and ripening turbidity are all captured against the specific backwash event, not just the filter.
Trend
Media loss tracking
Bed depth checks and estimated media loss per cycle roll into a trend line per filter, flagging cells approaching their media replacement window early.
Inspect
Mudballing and cracking checks
Monthly media surface inspection work orders capture visual condition against a standard checklist, linked to the same filter asset history.
Connect
SCADA and historian integration
Turbidity and differential pressure data ingest directly from existing SCADA systems via standard APIs, without replacing control room infrastructure.
Export
SWTR-ready compliance package
Monthly operating report data and backwash event logs export in state-agency format, with a full sanitary survey package generated in under two hours.
Plants running Oxmaint's filtration PM module report complete backwash and inspection records ready before the sanitary survey team ever asks. See what a live filter dashboard looks like for your plant's filter bank.
Manual Logs vs Backwash-Cycle CMMS
Most plants already track backwash events somewhere — a control room logbook, a spreadsheet, a SCADA historian nobody exports until an auditor asks. The gap is not data capture, it is turning that data into a trended, per-filter compliance record without hours of manual reconciliation every month.
| Dimension |
Manual logbook or spreadsheet |
Backwash-cycle CMMS |
| Trigger detection |
Operator judgment, checked periodically |
Automatic at head loss, turbidity, or run-time threshold |
| Per-filter trending |
Manual chart building, often skipped |
Continuous trend line per filter cell, always current |
| Ripening curve capture |
Rarely recorded beyond pass or fail |
Full recovery profile logged per event |
| Media loss visibility |
Discovered at bed depth inspection, if at all |
Trended per cycle, flagged before replacement is urgent |
| Monthly operating report |
Manually compiled from multiple sources |
Auto-populated from completed work order records |
| Sanitary survey prep |
Days of gathering scattered records |
Compliance package exported in under two hours |
Filter-to-Waste: The Step Plants Skip Under Pressure
When a filter returns to service after backwash, the first several minutes of filtrate often exceed the compliance threshold as the bed ripens — which is exactly why filter-to-waste exists. Diverting that initial flow to waste rather than the clearwell is standard practice at well-run plants, but it is also the step most likely to get shortened when a plant is running short-staffed or racing to bring capacity back online during a demand spike.
Why
Ripening turbidity is real
The brief spike immediately after backwash is not a measurement error — it reflects genuine reduced filtration efficiency as the bed re-establishes its filtering matrix.
Risk
Skipping it under pressure
Operators under demand pressure sometimes shorten or skip filter-to-waste to bring a filter back online faster — exactly the shortcut that produces a compliance exceedance.
Fix
Automated duration triggers
Tying filter-to-waste duration to actual turbidity recovery data rather than a fixed timer ensures the step never gets shortened past what the filter genuinely needs.
Seasonal Backwash Frequency Shifts
Backwash frequency is not a constant across the year — raw water quality swings with runoff, algae blooms, and turbidity events upstream, and a filter PM schedule that does not account for that seasonality either wastes wash water in the quiet months or falls behind during high-turbidity events.
Sp
Spring runoff
Snowmelt and rain events spike raw water turbidity, shortening filter run times and pushing backwash frequency toward the upper end of the typical range.
Su
Summer algae loading
Warm water conditions favor algae blooms that clog media faster than sediment alone, sometimes requiring more frequent air scour to prevent mudball formation.
Fa
Fall stabilization
Raw water quality typically stabilizes, run times extend, and this is the ideal window for the annual underdrain inspection before winter operating conditions begin.
Wi
Winter cold water
Colder water increases viscosity and can extend head loss buildup time even at similar turbidity, meaning run-time triggers may dominate over head loss triggers.
Five Mistakes That Show Up in Sanitary Surveys
State inspectors see the same gaps repeatedly across plants of every size. None of these require new equipment to fix — they require the discipline of capturing data that is already being generated at the plant every single day.
Common findings
- Backwash logs missing air scour duration or wash water flow rate
- No documented ripening turbidity profile for individual filter runs
- Media inspection records inconsistent or completed on paper only
- Underdrain inspections overdue or undocumented for years
- Differential pressure trends never reviewed against baseline
CMMS-documented practice
- Every backwash event captures air scour, flow rate, and duration automatically
- Ripening turbidity profile logged and trended per filter, per event
- Media inspection completed as a mobile work order with photo evidence
- Underdrain inspections scheduled annually with automatic reminders
- Differential pressure trend visible on a live dashboard, not a manual chart
Filter Media Types and What Changes for Backwash
Not every filter bed washes the same way — media type determines expansion rate, wash water demand, and how aggressively air scour needs to run. A backwash program tuned for single-media sand will underperform on a dual-media anthracite-sand bed, and getting this wrong is a common source of the mudballing and channeling that inspectors flag.
Single
Sand media beds
The simplest and most common configuration. Requires precise wash rate control since sand is denser and expands less readily than coarser media, making it more prone to mudballing if underwashed.
Dual
Anthracite-sand beds
Coarser anthracite on top of finer sand extends run times and captures more solids per cycle, but requires careful backwash rate control to prevent the two media layers from intermixing.
Multi
GAC and multi-media
Granular activated carbon layers add taste and odor control but are lighter and more prone to loss during backwash, making media loss tracking especially important on these beds.
Frequently Asked Questions
What turbidity level requires a filter to be taken offline under SWTR?
Effluent turbidity above 1.0 NTU in a single reading, or exceeding 0.3 NTU in more than 5% of monthly readings, constitutes a treatment technique violation requiring corrective action.
Track thresholds automatically free.
How often should a filter be backwashed at a typical surface water plant?
Most filters backwash two to three times per week depending on raw water quality and seasonal solids loading, though the actual trigger is head loss, turbidity, or maximum run time — whichever threshold is reached first.
What does a turbidity spike after backwash that lasts more than 15 minutes mean?
A ripening period extending well past 15 minutes, especially compared to other filters at the same plant, typically indicates media degradation, incomplete backwash, or an issue isolated to that specific filter rather than raw water quality.
Can Oxmaint integrate with our existing SCADA and turbidity monitoring system?
Yes — Oxmaint connects to existing SCADA, historian databases, and process control systems through standard APIs, ingesting turbidity and differential pressure data without replacing your control room infrastructure.
Book a walkthrough to see the integration.
How long does sanitary survey preparation take with a backwash-cycle CMMS?
Plants using structured digital backwash records typically generate a complete sanitary survey package — daily turbidity logs, CT records, filter performance history, and PM documentation — in under two hours instead of days of manual compilation.
Turn every backwash into a compliance record, not a guess
Oxmaint tracks head loss, turbidity, and run time per filter cell, logs every backwash event with full cycle detail, and exports SWTR-ready compliance packages in minutes. Give your operators the discipline that keeps every filter bed defensible.